On January 9, 2014, a faulty storage tank leaked 10,000 gallons of an industrial coal-processing liquid into the Elk River in West Virginia, contaminating the drinking water of the 9 counties collectively known as the Kanawha Valley.Reference Ward 1 The main chemical contained in the liquid was 4-methylcyclohexane methanol (crude MCHM), for which little toxicological information is available.Reference Lan, Hu and Gao 2 , 3 At 6 PM on the day of the leak, Governor Earl Ray Tomblin appeared on television and issued a “Do Not Use” order, and approximately 300,000 residents (16% of the state population) were told that their tap water was not safe for “drinking, cooking, washing, or bathing” and to be aware of signs and symptoms of exposure to the chemical such as rashes, nausea, vomiting, and wheezing.Reference Goodwin 4 The “Do Not Use” order remained in effect for much of the area for the next 10 days.
Scientists and practitioners have long recognized the importance of evaluating emergency risk communications and investigating the factors that influence the effectiveness of emergency risk communications activities conducted before, during, and after an emergency.Reference Savoia, Lin and Viswanath 5 , Reference Lin, Savoia and Agboola 6 Lessons learned from past events suggest that failure to communicate risk in a timely fashion and failure to take into consideration the audience’s background and the environment in which the messages are delivered may compromise the effectiveness of the emergency risk communications strategy.Reference Savoia, Lin and Viswanath 5 - Reference Galarce, Minsky and Viswanath 9 Furthermore, the literature indicates that there are significant differences in how people access, process and interpret, and react upon the information received according to a population’s characteristics, risk perceptions, and social factors.Reference Lin, Savoia and Agboola 6 - Reference Viswanath and Ackerson 10 Such differences, known as communication inequalities, may lead to inequalities in the level of knowledge acquired during a crisis and compliance with recommended behaviors.Reference Savoia, Lin and Viswanath 5 , Reference Lin, Jung and McCloud 7 , Reference Galarce, Minsky and Viswanath 9 - Reference Taylor-Clark, Viswanath and Blendon 11
Events such as the 2014 West Virginia water crisis serve as unique opportunities to study how effectively risk communication messages are conveyed to and received by different segments of the population during an emergency situation. In the context of this event, this study explored the relationship between a population’s sociodemographic characteristics and (1) the timeliness with which residents learned about the crisis, (2) the source of information, (3) opinions on the source of information, (4) information-seeking behaviors, and (5) knowledge of recommended behaviors.
METHODS
Between February 7 and 26, 2014, we surveyed adult residents of West Virginia including those living in the geographic areas affected by the chemical spill and those living outside this area. The reason we surveyed people living outside the affected areas was due to the assumption that the dissemination of information during an emergency has the potential to impact knowledge and behaviors beyond the area affected by the incident. The total population-based sample size was 690 and resulted from the combination of 2 samples, namely, 145 subjects drawn from the local KnowledgePanel (Gfk, Palo Alto, CA) sample and 545 subjects recruited solely for the purpose of this study by use of a convenience sample. The KnowledgePanel recruitment (in this case used for recruiting the initial 145 subjects) uses dual sample frames: random-digit dialing and address-based sampling to construct the existing panel. As a result, panel members come from listed and unlisted telephone numbers, telephone and nontelephone households, and cell phone–only households, as well as households with and without Internet access, which creates a representative sample. Only persons sampled through these probability-based techniques are eligible to participate in the KnowledgePanel surveys and non-Internet-capable households are provided with a laptop computer and free Internet access. As explained above, the remaining participants (545) were recruited solely for the purpose of this survey (opt-in panel or convenience panel) by use of the KnowledgePanel calibration technique,Reference DiSogra, Cobb and Chan 12 including an oversampling of residents of low socioeconomic position (below the poverty level) and low educational level (less than high school). Participants were eligible to win prizes drawn through monthly sweepstakes. Once the sample was selected and fielded, a post-stratification weight was computed to adjust for any survey nonresponse. Qualified respondents were weighted to look like the population of US adults aged ≥18 years who reside in West Virginia. Weighting benchmarks were based on the March 2013 Supplement Census Current Population Survey.
The questions for this survey were adapted from a survey implemented in the aftermath of the 2010 Boston water crisis;Reference Galarce and Viswanath 13 the survey was administered in English and online. A copy of the survey is available online: http://goo.gl/NAJTT0. Pilot testing of the survey was conducted on 45 individuals prior to its fielding, and minor modifications were made after the pilot phase. The study was approved by the Harvard T.H. Chan Institutional Review Board.
Measures
Independent and dependent variables were originally selected on the basis of substantive and theoretical relevance in accordance with the Structural Influence Model of Communication in Public Health Emergency Preparedness.Reference Savoia, Lin and Viswanath 5 , Reference Lin, Savoia and Agboola 6 , Reference Viswanath, Minsky and Ramamurthi 14 This heuristic model focuses on the role of communication in explaining the relationship between social determinants and health outcomes and has been successfully used to examine communications during the H1N1 pandemic.Reference Lin, Savoia and Agboola 6 , Reference Lin, Jung and McCloud 7 , Reference Savoia, Testa and Viswanath 15 The framework was originally developed in the context of health communicationsReference Viswanath, Ramanadhan and Kontos 16 and was subsequently adopted to public health emergency preparedness communications to the public.Reference Viswanath, Minsky and Ramamurthi 14
Independent Variables
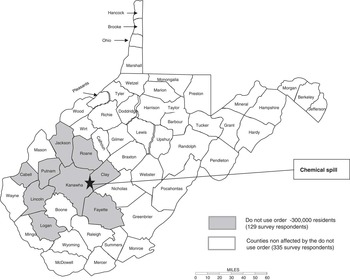
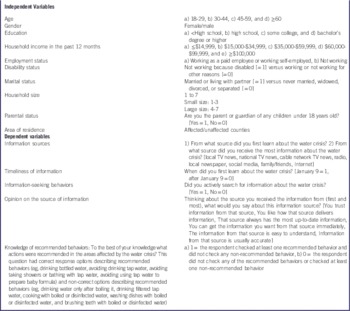
The following 10 sociodemographic characteristics were included as independent variables: residence in the affected counties (Boone, Cabell, Clay, Jackson, Kanawha [which includes the city of Charleston], Lincoln, Logan, Putnam or Roane; Figure 1), age, gender, education, parental status, disability, marital status, household income, employment status, and household size. More details on how each variable was defined and categorized are provided in Table 1.
Map of Affected Counties and Incident Site.

Definitions of the Variables

Dependent Variables
The dependent variables included in this analysis were as follows: the timeliness with which residents learned about the crisis, the source of information, information-seeking behavior, opinions on the source of information, and knowledge about recommended behaviors. Two questions were used to identify the source of information: (1) From what source did you first learn about the water crisis? and (2) From what source did you receive the most information about the water crisis? Timeliness of information was measured by the question, (3) When did you first learn about the water crisis? Information-seeking behavior was measured by the question, (4) Did you actively search for information about the water crisis? Opinions on the source of information were measured by the following question: (5) Thinking about the source you received the information from (first and most), what would you say about this information source? Response options for these questions are described in Table 1.
Statistical Analysis
We performed descriptive statistics to calculate the frequency of both dependent and independent variables. Multivariable models were conducted to test for the association between each predictor and the outcome variables while controlling for other sociodemographic factors. Owing to limits in the number of tables to be included in the article, we will report the main findings on the final models performed on the main variables listed above. We also conducted binary logistic regression analyses to determine the influence of the respondents’ social determinants on the first and most used source of information, on active search for information, and on when information about the crisis was first heard. Because several of the information sources were accessed by very few respondents, for the multivariate models we only considered those selected by more than 10% of the respondents, which included local television news, national television news, local newspaper, radio, the Internet, social media, and family and friends. All analysis models reflected the post-stratification sampling weight of the survey, and a P value equal to or smaller than 0.25 was used as a cutoff for the univariate analyses between each predictor and dependent variable. Analyses were performed by using Stata statistical software, release 13 (College Station, TX).
RESULTS
Sample Characteristics
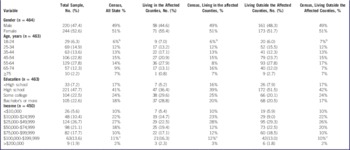
We sampled 690 individuals, of whom 592 started the survey and 464 (67%) responded to all questions and were included in the final analysis. Of the 464 respondents, 129 (27.8%) lived in 1 of the 9 counties affected by the crisis, whereas the remaining 335 (72.1%) lived outside this area. A map of the state and the affected counties and the location of the chemical spill is provided in Figure 1. Data from respondents from all counties were analyzed and differences were investigated between those from the affected areas and those from the rest of the state when appropriate. The proportion of respondents living in the affected counties did not vary between the KnowledgePanel and opt-in panel subsample (27% versus 28%). Sociodemographic characteristics of the sampled population and corresponding Census Bureau data are shown in Table 2. Despite intentional oversampling in the opt-in sample for low educational level, when the sample characteristics were compared with the Census data, our sample was found to underrepresent the category “less than high school.” Yet, post-stratification weights based on age, gender, race/ethnicity, education, and income were included in the statistical analysis to take into account differences with Census data.
Sample Characteristics Versus US Census Bureau (American Community Survey, 2009-2013)Footnote a

a Missing values: data on residence were not available for 1 respondent in the gender category “male” and for 2 respondents in the educational level category “high school.”
b Refers to age category 20-24 years.
c Refers to income category $100,000-174,999.
Timeliness of Information
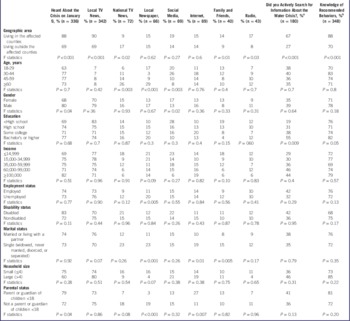
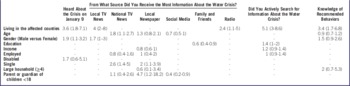
Seventy-four percent of respondents across the state and 88% in the affected counties answered that they heard about the water crisis on the same day the water contamination was reported (January 9). The cumulative percentages of those who heard about the crisis rose to 93% by January 10 and 98% by January 12. The distribution of respondents reporting to have heard about the crisis the same day of occurrence versus those who heard about the crisis on the following days displayed by sociodemographic characteristics is provided in Table 3. As a result of the multivariable analysis (Table 4), we found that people living in the affected counties had 260% increased odds of having heard the news the day the spill occurred compared to people living outside this area (adjusted odds ratio [ORadj]=3.6; 95% confidence interval [CI]: 1.8-7.1). Among the sociodemographic characteristics being tested, only gender was associated with timely receipt of information, with male respondents having 90% increased odds (ORadj=1.9; 95% CI: 1.1-3.2) of receiving the news of the crisis the same day it occurred compared to female respondents (Table 4).
Percentage of Respondents Who Heard About the Crisis on January 9, Received Most of the Information From Specific Sources (Local TV, National TV, Local Newspaper, Social Media, Internet, Family and Friends, Radio), Actively Searched for Information, and Knew About the Recommended Behaviors

a Reporting proportions on response=Yes.
b Reporting on proportions of respondents who checked at least one recommended behavior and did not check any nonrecommended behavior.
Final Multivariable Models: Determinants of Timely Receipt of Information, Information Source, Information-Seeking Behaviors, and Knowledge About Recommended BehaviorsFootnote a

a Variables are adjusted odds ratios and 95% confidence intervals from logistic regression models. No variable was associated with the Internet as source from which most of information was received. Dashed line indicates P<0.25.
Source of Information
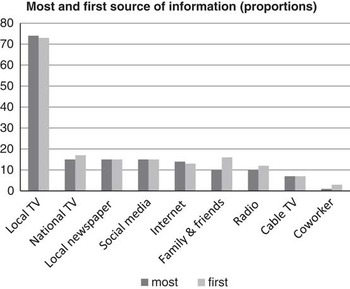
When asked from which source they heard about the water crisis, survey respondents said that local television news was the source from which people heard about the crisis first and received most of the information. More specifically, the top 3 sources from which people heard about the crisis at first were as follows: local television (73%), national television (17%), and family and friends (16%). On average, people shared the information with 8 other family members or friends. During the crisis, the top 3 sources from which people received the most information were as follows: local television (74%), social media (15%), and national television (15%). The distribution of responses for all sources of information is provided in Figure 2.
Source of Information From Which Respondents First Heard About the Crisis and From Which They Received Most of Their Information.

The use of sources of information differed among the various sociodemographic segments of the population. Proportions of respondents by most used channel of information and sociodemographic characteristics are presented in Table 3.
While most people received their information from local television news, respondents living in the affected counties had 300% increased odds of receiving information from this source, but also had 140% increased odds of using the radio (ORadj=2.4; 95% CI: 1.1-5). Age was associated with the use of national television news with 80% increased odds of receiving information from this source for each increase in age category (ORadj=1.8; 95% CI: 1.1-2.7). Single respondents had 100% increased odds (ORadj=2; 95% CI: 1.1-3.9) of using the local newspaper and 160% increased odds (ORadj=2.6; 95% CI: 1.4-5) of using the national television news as a source of information compared to those who were married or living with a partner. Parents and guardians of children less than 18 years had also increased odds of receiving the information from the local newspaper (ORadj=4.7; 95% CI: 1.2-18.2).
Opinion on the Source of Information
A previous study on the West Virginia water crisis presented public opinions on the source of information based on the agency that delivered such information being a local, state, or federal government agency or the water company.Reference Schade, Wright and Gupta 17 In our study, respondents’ opinions on the source from which they received most of the information were gathered by asking respondents to think about the channel they received the most information from and how much they agreed or disagreed with the following statements: the source is trustable, the source delivers information in a likeable way, the source is up-to-date, the source delivers information immediately, the source is easy to understand, and information from the source is accurate. The most appreciated source of information was found to be cable television news across all categories, followed by radio. Radio was appreciated because it delivers information that is up-to-date, and local newspapers were considered to be easy to understand and accurate. The Internet was appreciated for being a source from which respondents could get information immediately. The distribution of opinions by source of information is provided in Table 5. When opinions on the source of information were analyzed in multivariable models across segments of the population defined by their sociodemographic characteristics, respondents living in the affected counties had 130% increased odds of liking the way the information was delivered to them (ORadj = 2.3; 95% CI: 1.4-3.8) compared to those living outside this area, while respondents who were employed had 40% decreased odds of liking their source of information (ORadj = 0.6; 95% CI: 0.4-0.9) compared to those who were not employed. Finally, male respondents had 70% increased odds of finding the information easy to understand compared to women (ORadj = 1.7; 95% CI: 1.7-2.7). These findings from the multivariable models were not included in a table owing to lack of space.
Proportion of Respondents Reporting Their Opinion by Channel of Communication From Which they Received Most of the Information About the Water Crisis

Information-Seeking Behaviors
When asked if they actively searched for information, 37% of respondents answered that they did. Interestingly, people holding a bachelor’s degree or higher were more frequently active searchers of information compared to those with less than a high school degree (55% versus 19%). Male respondents were also more frequently seeking information than were female respondents (39% versus 35%), and those living in large households (with 4 or more members) were also seeking information in an active manner more frequently than were respondents living in smaller households (46% versus 36%). Proportions by sociodemographic characteristics are presented in Table 3. More specifically, in the multivariable model we found that respondents in the affected counties had a 410% increased odds of actively searching for information about the water crisis (ORadj = 5.1; 95% CI: 3-8.6) compared with respondents living outside this area after adjustment for all sociodemographic factors (Table 4).
Knowledge of Recommended Behaviors
Most respondents (74%) knew about the recommended behaviors. People living in the affected counties had 240% increased odds (ORadj = 3.4; 95% CI: 1.7-6.8) of having a higher level of knowledge about recommended behaviors such as avoiding drinking tap water or using tap water in general compared with people living outside this area (Table 4). Those who obtained risk information from social media had 120% increased odds of having a higher level of knowledge about the recommended behaviors compared with people who did not use this source of information (ORadj = 2.2; 95% CI: 1.1-4.7). People who did not have a favorable opinion of the source of information—be it a lack of trust, difficulty in understanding, dislike of the delivery strategy, simple failure to find information immediately from the source, or not finding the information up-to-date or accurate—had a 70% decreased odds of knowing about the recommended behaviors (ORadj = 0.3; 95% CI: 0.1-0.7) compared with those who had a good opinion of their source of information. These findings from the multivariable models were not included in a table because of lack of space.
Interestingly, knowledge was not significantly associated with compliance with recommended behaviors. A more extensive analysis focusing on the factors associated with compliance with recommended behaviors is provided elsewhere.Reference Savoia, Stoto and Gupta 18
DISCUSSION
Public health emergencies heighten several challenges in risk communications, such as providing timely information from trusted sources, reaching marginalized populations, and minimizing fear and public confusion. During emergency situations, information may not diffuse equally among all social groups, and gaps in knowledge may increase when key channels of information are not used or differences in audiences are not taken into consideration. Knowledge gaps may vary by social structure and the size, socioeconomic status, and diversity of the population exposed to the incident. Our study aimed to investigate such differences by examining information exposure and information-seeking behaviors during a crisis. Our results highlight the importance of understanding how risk communications messages are received by the various segments of the population during an emergency situation. They also highlight the fact that a “general public” does not exist and a cross-sectional study like the one we describe can help in identifying differences in audiences that need to be taken into consideration when developing an emergency risk communications strategy.
The literature shows how populations’ perceptions and beliefs may be related with communication and preparedness outcomesReference Savoia, Lin and Viswanath 5 , Reference Lin, Savoia and Agboola 6 and how a number of psychosocial as well as social factors influence action, even when information about a probable hazard is available and promptly communicated to the public. For example, hearing impairment may leave elderly people more vulnerable to information processing and cause difficulty in understanding evacuation orders,Reference Cretikos, Eastwood and Dalton 19 and individuals with low literacy may be challenged in interpreting written messages and are likely to benefit from preparedness resources that are easy to read and visually appropriate.Reference Davis, Stephenson and Flowers 20
This study showed that crisis communications efforts following the 2014 West Virginia water crisis were timely, with 88% of respondents in the affected counties hearing about the crisis on the day it occurred. We compared our results with the results from a previous study on the risk communications response to the 2010 Boston water emergency, to our knowledge the only similar event in which a cross-sectional study was conducted to investigate the impact of an emergency risk communications strategy. In West Virginia, male respondents got the news sooner than did female respondents, contrary to what found during the 2010 Boston water emergency, in which females were more likely to get the news in a timely fashion. With the information at hand, it is not possible to understand the reason for this difference, which could have been due to the day and time the emergency occurred and when and how it was communicated. The Boston water crisis occurred in the morning on a weekend, whereas the West Virginia water crisis occurred on a weekday and the news was officially communicated at night.
During the West Virginia water crisis, male respondents had increased odds of finding the information received easy to understand, which may have impacted how quickly they understood the severity of the incident. Furthermore, the use of reverse 911 was one of the main channels of communication during the Boston emergency but was not widely used during the West Virginia water crisis; it is possible that this means of communication is more likely to reach women and the elderly.
In both situations, word of mouth played an important role in disseminating risk information, with each person alerting an average of 8 to 10 people of the emergency. Both emergencies highlight the importance of local television news, the source from which most people heard about the crisis and received most of their information.
From the study of the West Virginia crisis, we can derive that the Internet and social media played a role in the dissemination of information. However, these channels were used more as a source to obtain additional information on the situation as opposed to a first source of information. During both emergencies, a good proportion of respondents reported to have searched for additional information; in West Virginia those with a higher educational level and male respondents had increased odds of doing so.
Interestingly, opinions on the source of information were associated with the respondents’ ability to understand the recommendations provided. People not having a favorable opinion of their source of information (ie, lack of trust) had decreased odds of knowing about the recommended behaviors (ie, do not drink tap water).
The radio was frequently used in the affected areas and was liked by the users; this finding supports the use of this means of communication in emergency situations even when other channels are functioning. In sum, local media such as television and radio remain crucial channels during local emergencies, a fact that must be taken into consideration when designing and coordinating risk communication strategies by public agencies. In the literature, higher socioeconomic position, as measured by level of education and income or socioeconomic index, has proven to be related to a higher level of knowledge regarding the risk and preventive measures associated with better preparedness outcomes, including higher compliance with preventive practices.Reference Hilyard, Freimuth and Musa 21 - Reference Janssen, Tardif and Landry 23 Such relationships may be due to lack of resources or understanding of the message, which is often delivered at a literacy level higher than that achievable by the population.
Limitations
In our study we did not find an association between socioeconomic position and use of specific information channels or knowledge about recommended behaviors. However, this finding may have been due to a limitation of our sampling strategy not including a sufficient number of respondents from low-income groups and low educational level, which might have limited our ability to describe the use of source of information and opinions among this group. However, all statistical analysis took sociodemographics characteristics into consideration by including study-specific post-stratification weights. Another limitation of our study was the use of a cross-sectional study design, which limited the ability to investigate how information exposure varies over time. Owing to the nature of the cross-sectional study design, limitations included the impossibility of making causal inferences and the fact that we could have obtained different results and differences across groups if another timeframe had been chosen.
CONCLUSION
The results of this study suggest the need to develop communications plans that include strategies on how to reach and inform various segments of the population based on their ability to receive and process the information. Such information could be gathered during nonemergency situations either by the use of surveys, interviews, or focus groups aimed at understanding access to information, literacy levels, beliefs, and trust in the source of information as an example. In our study, information exposure and information-seeking behaviors across segments of the population differed based on population characteristics such as gender and education. A favorable opinion on the source of information was also associated with better understanding of the message received and compliance with recommended behaviors. Our results also indicate the need to develop strong relationships between the media and the responding agency so that television and radio can be promptly used to disseminate the information when needed.
Acknowledgments
We acknowledge funding support from the US Centers for Disease Control and Prevention (CDC) cooperative agreement numbers 5PO1TP000307-05 supplement (Preparedness and Emergency Response Research Center) and 1U90TP000417-05 (Preparedness and Emergency Response Learning Center. The content of this publication as well as the views and discussions expressed in this paper are solely those of the authors and do not necessarily represent the views of any partner organizations, the CDC, or the US Department of Health and Human Services nor does mention of trade names, commercial practices, or organizations imply endorsement by the US government. We are also grateful to Jing Wen for her work during the initial statistical analysis.