Introduction
This paper is motivated by the desire to address two under-researched aspects of long-term care provision for people living in the community: firstly, the needs of working-age people alongside the more thoroughly investigated needs of older people (Brawn et al., Reference Brawn, Bush, Hawkings and Trotter2013) and, secondly, who is at risk of an unmet need for care. Long-term care is often conceived as relating principally to the older population. Formal services, both residential and care provided in people's own homes, are indeed concentrated on the over-65s (OECD, 2011). However, indicators of potential need for care, as opposed to the use of formal services, give a rather different picture. For example, there are an estimated 42 million working-age disabled people in EU-27 countries, of whom 14 million have disabilities in four or more areas of life, and this compares to 31 million disabled people aged 65 or over, of whom 12 million have disabilities in four or more areas of life (Eurostat, 2015). So if we take disabilities in four or more areas as a proxy for potential care needs, it appears that just over half of the European population who have potential care needs are of working age.
For both age groups, care is organised in three main ways: informal (usually unpaid) care by family and friends, formal publicly-funded services (which may be provided by a public, voluntary or private organisation), and formal services paid for privately.Footnote 1 Demographic demand places pressures on all types of care, but there are also distinct pressures within each system – from a shrinking supply of some types of unpaid carer, from public spending cuts, and from the increased cost of provision (Pickard, Reference Pickard2015; Burchardt et al., Reference Burchardt, Obolenskaya, Vizard, Lupton, Burchardt, Hills, Stewart and Vizard2016; Gurnon, Reference Gurnon2017). This paper seeks to investigate whether the complex web of care provision, and associated pressures, have led to people falling between the cracks in formal and informal care, and who is most at risk of unmet need among older and working-age disabled people.
We begin by reviewing the organisation and coherence of formal and informal care across OECD countries and within the UK, and the existing evidence on unmet needs. The paper then introduces the UK Family Resources Survey and presents our methodology for analysing the need for, and receipt of, formal and informal care among the working-age and older populations. Our results indicate overlaps and complementarity between care systems but also high levels of potential unmet need, with some groups at particular risk of receiving neither formal nor informal care. The concluding section of the paper reflects on the implications of these results for the future of policy to support people with care needs in the community, both in the UK and internationally.
Provision of long-term care
Public entitlements to long-term care (universal, insurance-based or means-tested), sit alongside privately paid-for services (insurance or out-of-pocket), and informal care (sometimes supported through public services and allowances). Residential, community and domiciliary services are provided by public organisations, for-profit and not-for-profit organisations. The mix varies widely internationally and has changed over time (OECD, 2011). In Italy and Spain, there are virtually no national universal entitlements and the family is expected to take on a considerable share of responsibility (Geerts and Van den Bosch, Reference Geerts and Van den Bosch2012). UK provision is heavily means-tested (with the exception of free personal care for the over-65s in Scotland), and cuts to services in England produced a fall of 25 per cent in the number of people receiving community-based publicly-funded services between 2009/10 and 2013/14, achieved in part through raising the threshold of care needs that are eligible (Burchardt et al., Reference Burchardt, Obolenskaya, Vizard, Lupton, Burchardt, Hills, Stewart and Vizard2016). Reforms in Germany, Austria and France during the 1990s moved in the opposite direction, introducing some universal long-term care entitlements, while in Scandinavia and the Netherlands, where universal provision of care for the elderly population is the established norm, pressures on public funds have resulted in stricter eligibility criteria and the provision of care only for those most severely care-dependent and lacking family support (Geerts and Van den Bosch, Reference Geerts and Van den Bosch2012).
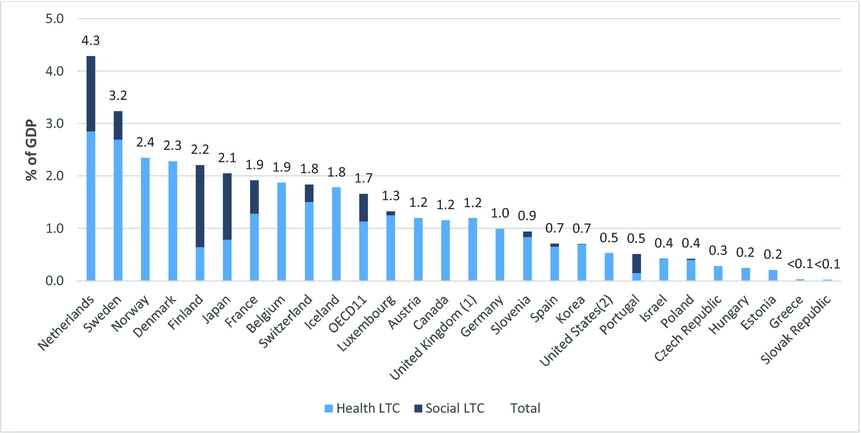
These variations between systems are associated with a wide variation in public spending on long-term care (Figure 1). OECD (2015) suggests that the total public spending on long-term care (including both the health and social care componentsFootnote 2) accounted for 1.7 per cent of GDP on average across 11 OECD countries in 2013 (or the nearest year), and ranged from 4.3 per cent in the Netherlands to 0.5 per cent in Portugal. The figure for the UK was 1.2 per cent, but it only includes the health component (OECD, 2016)Footnote 3.
Long-term care public expenditure (health and social components), as share of GDP, 2013 (or nearest year)

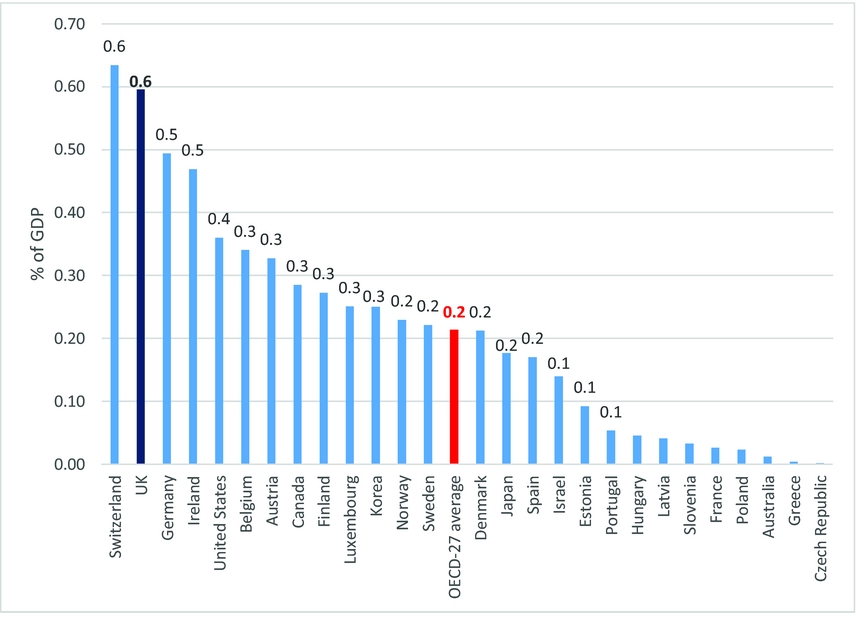
There is also variation across countries in the extent of privately paid-for services: in part, but not wholly, this is a mirror image of public spending. On average for the OECD-27 countries for which privately funded LTC (health component) expenditure is available for 2013 (or nearest year), this expenditure makes up 0.2 per cent of GDP (authors’ calculations using OECD 2016 figures) (Figure 2)Footnote 4. The UK (0.6 per cent of GDP) comes second only to Switzerland (OECD, 2016; OECD, 2015).
Long-term care (health component) private expenditure, as share of GDP, 2013 or nearest year

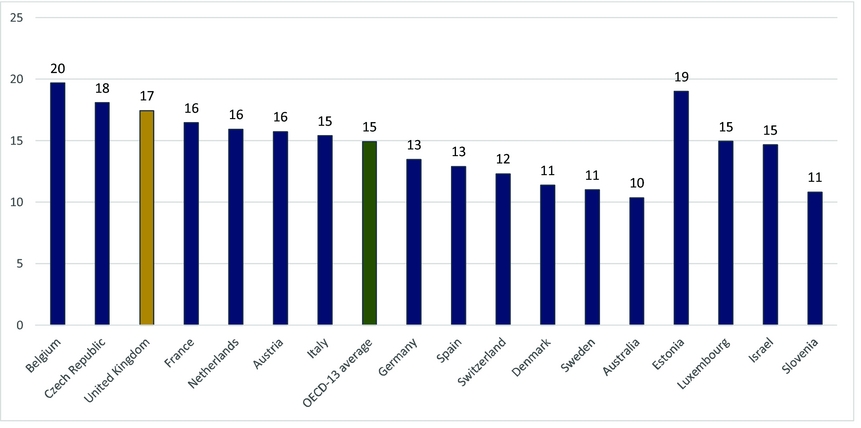
Public and private services together make up ‘formal’ provision. The extent of informal care also varies across countries (Figure 3). The proportion of those aged 50 and over with informal care responsibilities ranges from 1 in 5 in Belgium to 1 in 10 in Australia, with the UK being the third highest in 2013 (or nearest year) across 13 OECD countries.
Population aged 50 and over reporting that they are informal carers, 2013 (or nearest year), OECD

Expanding the age range of carers to those aged 25 to 75, and using the European Social Survey for 2014, Verbakel et al. (Reference Verbakel, Tamlagsrønning, Winstone, Fjær and Eikemo2017) find a higher overall prevalence of informal caregiving (an average of 34 per cent for 20 European countries, with the UK just below the average at 31 per cent), but also find that the UK has a comparatively high rate of intensive care givers (9.0 per cent, against an average of 7.6 per cent providing 11 hours a week or more).
Interlocking systems?
The balance between formal and informal care varies across European countries depending on traditions, norms, economic, social and demographic conditions and the associated designs of welfare systems, according to Bolin et al. (Reference Bolin, Lindgren and Lundborg2008). Using the 2004 wave of the Survey of Health, Ageing, and Retirement in Europe, they show that overall, informal care is a substitute for formal care provision for elderly people in their homes, but informal care is complementary to hospital stays and doctor visits. Informal care in Southern Europe, where it dominates provision, is to a greater degree a substitute for formal care than it is in central and Northern European countries, where there is higher public spending on care for older people. Bonsang (Reference Bonsang2009) extends this analysis and shows that the substitution of formal care by informal care is particularly evident for older people with lower needs and disability levels and therefore requiring lower levels of skilled support. Conversely, Pickard (Reference Pickard2012) argues that the provision of residential formal care services can relieve family carers of the responsibility to provide the most high-intensity informal care.
Differences in care provision across countries are mirrored in the way informal care is treated when assessment for publicly-funded long-term care is being made. For example, in England and Australia, the amount of informal care provided by relatives is considered in care needs assessments, whereas in other countries, such as France and Japan, it is not (Robertson et al., Reference Robertson, Gregory and Jabba2014).
In principle, public care should plug the gaps left by the unaffordability of private care (for example for low-income households) and the unavailability of informal care (for example for people without family in close proximity), creating an interlocking system to meet people's need. In practice, however, some people fall between the cracks.
Unmet need
International evidence on unmet need for long-term care in the community is patchy, definitions of ‘unmet need’ are not consistent between studies, and most studies focus on the older population. Zhu (Reference Zhu2015) found rates of unmet need for help with personal care amongst the over-80s of 53 per cent to 65 per cent using the Chinese Longitudinal Healthy Longevity Study. Location, economic status, health and disability, and the relationship with the caregiver were important determinants of the risk of unmet need. In the US, Komisar et al. (Reference Komisar, Feder and Kasper2005) highlighted high levels of unmet need for help with Activities of Daily Living (ADLs) among low-income elderly and disabled people, ranging from 48 per cent for those who need help with one or two ADLs to 72 per cent of those who needed help with five or six ADLs. The authors argued that this group were falling between the stools of federal and state provision, despite being eligible for both Medicare and Medicaid. More recent work on these so-called ‘dual eligibles’ found evidence of serious problems resulting from unmet need, including going without meals, having to remain in bed, and making mistakes in taking medication (Allen et al., Reference Allen, Piette and Mor2014). Bien et al. (Reference Bien, McKee, Dohner, Triantafillou, Lamura, Doroszkiewicz, Krevers and Kofahl2013) examined the unmet care needs (as assessed by family carers) of older people with high levels of disability across six European countries, in 2003/4. They found a higher prevalence of unmet need in Southern-Eastern countries compared to Northern-Western countries, ranging from 4 per cent in Sweden to 12 per cent in the UK and 39 per cent in Greece.
In England, Vlachantoni et al. (Reference Vlachantoni, Shaw, Willis, Evandrou, Falkingham and Luff2011) used the 2001/2 General Household Survey (GHS) and the 2008 English Longitudinal Study of Ageing (ELSA) to estimate unmet need among people aged 65 or over. They showed that in 2001/02, 39 per cent to 61 per cent of those needing help with bathing, dressing and/or getting in or out of bed received no help from either formal or informal sources, and that 32 per cent to 62 per cent of those needing help with bathing and/or dressing received no help in 2008. Lower estimates for unmet need among over 65s in England are provided by Whalley (Reference Whalley2012) using the Health Survey for England (HSE) for 2011–12Footnote 5. The findings show that among those who needed help with at least one ADL, 22 per cent of men and 30 per cent of women received none in the last month; and among those who needed help with at least one ‘instrumental activity of daily living’ (IADL), 14 per cent of men and 15 per cent of women did not receive any. Vlachantoni et al. (Reference Vlachantoni, Shaw, Evandrou and Fankingham2015) find health to be a significant determinant of the receipt of informal support – physical health in the case of men and mental health in the case of women. But they also show that the level and nature of support received by older people varies by socio-economic factors. While the number of difficulties people have with ADLs/IADLs is the largest predictor of receipt of informal, public or paid-for care, marital status and household wealth are also important in some cases.
There is even less evidence on unmet need among the working-age population. In the US, Mitra et al. (Reference Mitra, Bogen, Long-Bellil and Heaphy2011) found that over two-thirds of their working-age disabled respondents in Massachusetts reported an unmet need for home and community-based services and one in four of their sample reported unmet needs in four or more categories. In another US study, Newcomer et al. (Reference Newcomer, Kang, LaPlante and Kaye2005) report on perceptions of unmet need for personal assistance with ADL and IADL of a nationally representative sample of adults of all ages. They found that, consistently across all ADLs, just under 1 in 5 people with a specific ADL limitation had unmet needs for assistance with that ADL. Moreover, they found an increase in the likelihood of unmet need for ADL assistance with the number of ADL limitations experienced by an individual. In England, based on a survey of over 600 disabled adults aged 18 to 64, Brawn et al. (Reference Brawn, Bush, Hawkings and Trotter2013) found that 36 per cent of the sample reported unmet basic needs (eating home-cooked food, washing once a day, getting dressed or getting out of the house) due to withdrawal of funding by their local authority. Those with ‘moderate’ care needs were more likely to report unmet basic needs (41 per cent) compared to those with ‘substantial’ needs (17 per cent).
Even those who receive some support may not always get an adequate amount, or quality, of support to ensure that their needs are met in full. Lloyd and Ross (Reference Lloyd and Ross2014) use the 2012–13 ELSA to show that almost 7 per cent of those receiving support do not find it adequate to meet all of their needs. A study of perceptions of unmet need among care-recipients and carers in England also reported high levels of expressed unmet need and, interestingly, carers were more likely than the people they cared for to perceive that there were unmet needs (Brimblecombe et al., Reference Brimblecombe, Pickard, King and Knapp2017).
We have seen, then, that the mix of formal and informal care provided across OECD countries varies markedly and that there are different patterns of substitution and complementarity between modes of care in different contexts. The mix does not always produce a comprehensive solution. We have identified evidence of significant levels of unmet need for long-term care, both internationally and within the UK. However, much of this evidence overlooks the needs of working-age disabled adults – despite their numerical importance in the population of people with needs – and has relatively little to say about the characteristics of those most at risk of falling between the cracks of different modes of care. It is to those issues we now turn, presenting results from original analysis of UK data.
Data and methodology
To explore the characteristics of those experiencing unmet need for long-term care in the community, we use data from the UK Family Resources Survey (FRS), a survey of private households sponsored by the Department for Work and Pensions. Although the survey does not contain as much detail on disability or the receipt of care as, for example, HSE or ELSA, it has the advantage of including the working-age population (ages 20–64) as well as older people (65 plus). We pool data for the years 2012/13 and 2013/14, giving a total sample size of 70,701.
Our definition of ‘need’ is based on responses to three questions: long-standing illness or condition, number of types of impairment, and the effect on day-to-day activities.Footnote 6 Specifically, we categorise as ‘high need’ those who have a long-standing illness or condition, who identify four or more types of impairment (for example mobility, vision, dexterity and memory), and who report that their ability to carry out day-to-day activities is reduced ‘a lot’. We categorise as ‘moderate need’ those who have a long-standing illness or condition, who identify four or more types of impairment but who report that their ability to carry out day-to-day activities is reduced only ‘a little’, or who identify one to three types of impairment but report that their ability to carry out day-to-day activities is reduced ‘a lot’, or ‘a little’. Everyone else we categorise as ‘low/no need’. We experimented extensively with different specifications of the ‘need’ variable, including varying the threshold for ‘high need’. Our final version draws on information about both the range of impairments and the degree to which their combined effect limits day-to-day activities, and enables us to focus on a group with unequivocally high needs (four or more types of impairment that together limit activities ‘a lot’) whilst retaining a sufficiently large sample size to support the analysis we want to conduct. The measure is not directly comparable to those derived from other sources because of differences in the survey questions.
Help received is identified by a series of questions about who within the household is receiving help or support because of physical or mental ill-health or disability or old age, the frequency of help provided and, for those who receive help once a week or more often, by whom the help is provided (including a list of both formal and informal sources). We define informal care as any help or support (at least once a week) from co-resident or non-co-resident relatives, friends or neighbours. We define formal care as any help (at least once a week) from a Local Authority home help or home care worker, private domestic help, District nurse, health visitor or other kind of nurse, or other outside helpers. Regrettably, ambiguity in the question wording does not allow us to reliably separate publicly-funded from privately-purchased formal care, so we focus on the comparison between formal and informal care. Receipt of both types of care is likely to be underestimated in FRS because the household respondent answers these questions on behalf of all household members, rather than each person responding for themselves.Footnote 7 For this reason we place more emphasis on the comparison of receipt of care and unmet need between different groups of people than on the estimates of the overall level of unmet need.
Finally, we define as having ‘unmet need’ those who have high (or, separately, moderate) need and who receive neither formal nor informal care. Thus we adopt broad measures of need but a high threshold for unmet need: namely, those receiving no help at all. Of course many other people are receiving some help but help which is inadequate to meet their needs; they are not included in our definition here.
The analysis consists of bivariate and multivariate analysis of the correlates of receiving formal and informal help, and of unmet need. Firstly we describe the profile of high and moderate needs among the working-age and older populations, and their receipt of care. Secondly, we model the extent to which receiving help is associated with indicators of need (such as the number and type of impairments, self-reported health statusFootnote 8 and age). Thirdly we extend these models to include socio-economic characteristics that we expect to be associated positively with the affordability of private formal care or negatively with the eligibility for public formal care (for example, high-income households are more likely to be able to afford private care and are less likely to be eligible for public care). Socio-economic variables include household income, employment status for working-age respondents, and region/country within the UK. Finally we add demographic characteristics that we have reasons to believe may be associated with availability of informal care: gender, ethnicity, other adults in the household.Footnote 9 The models based on ELSA reported in Vlachantoni et al. (Reference Vlachantoni, Shaw, Evandrou and Fankingham2015) were helpful in guiding our variable selection, although not all variables in ELSA are available in FRS and vice versa. In principle, we would like to include an indicator of the existence or otherwise of non-co-resident family members (especially adult offspring) but this is not, unfortunately, available in FRS. The models are probit regressions on binary indicators of care/no care (for each of formal, informal, and any care) and we report the average marginal probabilities associated with each explanatory variable (see notes to Table 1 for details). To aid interpretation, reference categories for categorical variables are, in most cases, selected to be those associated with lower likelihoods of receiving care. The data are weighted using survey weights to account for sample design and non-response bias.
Summary table of regression results: Probability of receiving (A) any care, (B) any formal care and (C) any informal care, by disability, demographic and socio-economic characteristics. People with high need; working-age and older populations, UK, 2012/13 and 2013/14.

Source: authors’ calculations using FRS, 2012/13 and 2013/14
Key:
Statistically significant at * 90% ** 95% *** 99%
# ‘ Mixed ethnic group’ predicts outcome perfectly in these models (due to small cell size), so mixed ethnicity individuals omitted
Notes on model specifications and interpretation:
Probit regression with sample weights, and robust standard errors.
The marginal probabilities shown in the table are average marginal probabilities for all members of the estimation sample. For categorical variables, they show the average change in probability of having a positive outcome (e.g. in Panel A: receiving some care) associated with moving from the reference category to the category in question (e.g. from lowest to highest income quintile group), controlling for other characteristics. To aid interpretation, the reference categories have in most cases been selected as those associated with a lower likelihood of receiving care. For binary variables, the marginal probabilities show the average change in probability associated with moving from 0 to 1 (e.g. from no difficulty with vision, to difficulty with vision). For continuous variables, they show the average change in probability associated with a one unit change (e.g. from 4 difficulties to 5 difficulties).
McFadden's Pseudo R2 is an indicator of the model's goodness-of-fit. It indicates the level of improvement over the intercept model offered by the full model and ranges between 0 and 1 with a higher value indicating a better fit.
Notes on covariates:
Subjective poor health: ‘How is your health in general?’, responses from 1 (Very good) to 5 (Very bad)
Number of difficulties: ranging from 4 to 9
Impairment type: ‘Do any of these conditions or illnesses affect you in any of the following areas?’, response categories: ‘Vision (for example blindness or partial sight) / Hearing (for example deafness or partial hearing) / Mobility (for example walking short distances or climbing stairs) / Dexterity (for example lifting and carrying objects, using a keyboard) / Learning or understanding or concentrating / Memory / Mental Health / Stamina or breathing or fatigue / Socially or behaviourally (for example associated with autism, attention deficit disorder or Asperger's syndrome)’.
Ethnic groups: 1 White / 2 Mixed or Multiple ethnic groups / 3 Asian or Asian British / 4 Black or African or Caribbean or Black British /5 Other ethnic group.
Adults in hh: whether a single adult household, respondent has a partner in the household, or respondent has another adult not his/her partner in household
Income group: fifths of the whole population by household income (i.e. income quintile groups). Household income is defined as net after housing costs income, equivalised for differences in household composition using the Modified OECD equivalence scale. This is one of the standard income variables (OQINAHC) used in the Households Below Average Income publication (DWP, 2015a).
Employment status: Employed or self-employed full-time /Employed or self-employed part-time / Unemployed / Out of work for other reasons (including long-term sick or disabled, full-time education or training, retired, looking after family
Results
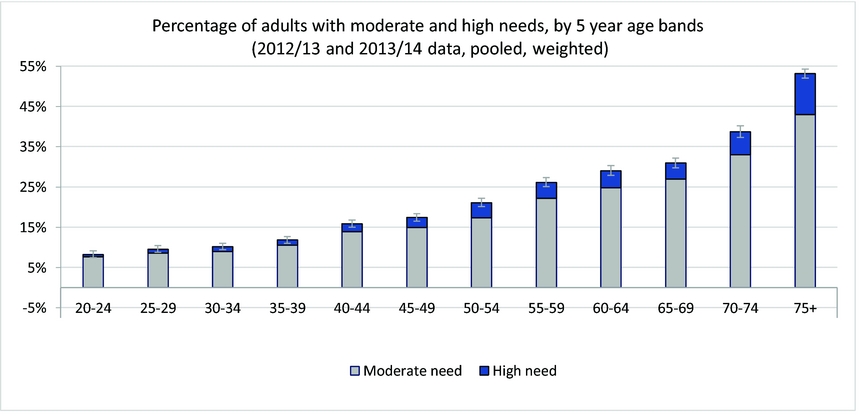
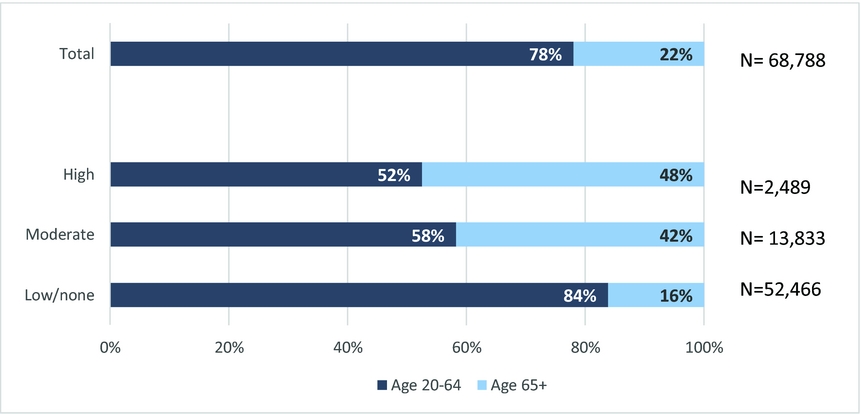
Figure 4 confirms the strong age gradient in need – both for moderate and high need. A higher proportion of older people (aged 65 or over) have high needs than people of working age. But because there are more than three times as many people of working age in total than people aged 65 or over, in fact just over half of those with high needs are people of working age (Figure 5), as are more than half of those with moderate needs. The high needs groups correspond to just over 800 thousand people of working age and just under 800 thousand people age 65 or over in the UK in 2013.
Percentage of adults with moderate and high needs, by 5 year age bands

Composition of high, moderate and low/no need groups by broad age group

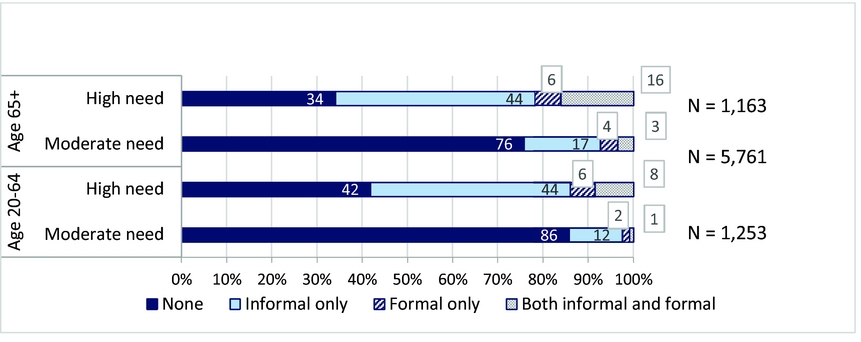
How are their needs met? Among the moderate need group, large majorities do not report receipt of any help (76 per cent of older people and 86 per cent of working-age people), whether formal or informal (Figure 6). Most of the moderate need group report that their health conditions or impairments limit their activities ‘a little’, so it seems likely that they are managing by themselves. However a significantly higher proportion of older people than working-age people with moderate needs are receiving at least some formal services (7.2 per cent and 2.5 per cent respectively: ‘Formal only’ or ‘Both informal and formal’, statistically significant difference at 95 per cent level), and a higher proportion of older people than working-age people are receiving at least some informal care (20.4 per cent and 12.5 per cent respectively: ‘Informal only’ or ‘Both informal and formal’, statistically significant difference at 95 per cent level).
Type of care received by adults with moderate and high needs, by age group

Among those with higher levels of need, the picture is somewhat different. A majority of each age group with high needs reports receipt of some informal care (60.2 per cent of older people and 52.7 per cent of working-age people). A minority – 21.8 per cent of older people and 14.0 per cent of working-age people – are receiving formal care services, and this minority overlaps with those receiving informal services, as indicated by the relatively large size of the ‘Both informal and formal’ sections of the bars. This confirms that, among the high need group, formal and informal care are partly complementary. However, this still leaves surprisingly high proportions who report receiving no help at all: 34.0 per cent and 41.8 per cent of the older and working-age groups respectively. Bearing in mind that these are people who have four or more types of impairment (for example, vision, mobility, dexterity and memory) and who say that their health conditions or impairments limit their ability to carry out day to day activities ‘a lot’, it is striking that up to one-third of older people and two-fifths of working-age people are apparently receiving no regular help or support.
The differences between the working-age and older-age groups in the pattern of support they receive could be explained by a number of factors. It may be that levels of need among the older age group are higher, within each broad need group. The mean number of impairment types (for example, vision, dexterity. . .) among the high need group for the two age groups is similar (4.9 for the older age group and 5.0 for the working-age group), but the severity and complexity of the specific impairments are not observed in our data and may differ between the two age groups. There may also be differences in reporting behaviour of the two age groups; older people may internalise a higher threshold for what constitutes a health condition or impairment (Hoeymans et al., Reference Hoeymans, Feskens, Kromhout and Van Den Bos1997) and/or may be more likely to recognise receipt of care. In either case, it seems that there is a prima facie case for recognising the possibility of substantial levels of unmet need for care among both working-age and older disabled people.
To understand more about who does and does not receive support, we turn to multivariate analysis, concentrating on the high need group and continuing to compare the working-age and older populations. In an equitable system of provision, one would expect levels of need to be the most important – or perhaps the sole? – determinant of who receives help. Our first set of models, therefore, includes a range of indicators of need as predictors of receiving any help (types of impairment, number of types of impairment, self-reported health status and age: details in online supplementary material: Appendix Table A). A logistic (probit) regression for working-age people among the high need group suggests that those who have poor general health and who have more impairment types are more likely (at 95 per cent level of significance) to be receiving some support (formal or informal), compared to those in better health or with fewer impairment types. People with impairments leading to social or behavioural problems (listed in the questionnaire as ‘for example associated with autism, attention deficit disorder or Asperger's syndrome’) are more likely to receive some support than people who do not have this type of difficulty. There is no clear age gradient within the working-age group independently of these other factors.
Among the older population with high need, general health is not significant but the number of impairment types remains a significant predictor (at 90 per cent level) of receiving some help. People with difficulties learning, concentrating or understanding are significantly more likely (at 95 per cent level) than others to receive help, although those identified as having difficulties with memory are not.
Overall then, indicators of need are important predictors of who receives support, among both the working-age and the older population, with some variation by type of impairment. But indicators of need alone account for only a small proportion of overall variance (pseudo R2 at 4.1 per cent and 5.9 per cent for working-age and older age regressions respectively). Clearly there are other important determinants. In the second set of models (Table 1), we add demographic characteristics that may be associated with the availability of informal care for a given type and level of need, and socio-economic characteristics that may be associated with the affordability of private formal care or eligibility for public formal care. Panel A reports predictors of receiving any care, panel B reports predictors of receiving formal care and panel C reports predictors of receiving informal care, separately for the working-age and older populations. Once again we focus on people with high need.
In interpreting the results it is useful to bear in mind that we might expect formal and informal help to be complementary systems. People with high levels of need who do not receive any informal care (for example, because they have no nearby relatives) have a greater requirement for formal help than those who do receive informal care. People with high levels of need who do not receive any formal services (for example, because they are ineligible for public care and unable to afford private care) have a correspondingly greater requirement for informal help. Controlling for need, then, are the characteristics associated with a lower chance of receiving formal care in turn associated with a higher chance of receiving informal care, and vice versa? If so, the risk of receiving no care at all, for a given level of need, would be evenly distributed – is this in fact the case?
The top section of Table 1 repeats the indicators of need discussed above and reported in Appendix Table A (see online supplementary material). The pattern of association between the likelihood of receiving ‘any care’ (panel A) and health, the number of difficulties and impairment types is broadly unchanged for people of working age: those with worse health, more difficulties, or social/behavioural impairments are more likely to be in receipt of some care. However in this model, controlling for other demographic and socio-economic characteristics, age becomes a significant predictor. Middle-aged people (age brackets 40 to 59) are generally more likely than the reference group (35 to 39) to be receiving some care, while the probabilities for younger groups and the oldest working-age group (60 to 64) are not statistically significantly different from the reference group. Looking across the table to panel B (formal care) and panel C (informal care), we can see that this profile is driven by the availability of informal care, which peaks among the working-age group in late middle age; while there are almost no statistically significant differences by age in the likelihood of receiving formal care, controlling for other characteristics.
For people aged 65 or over, neither their health nor the number of difficulties is a significant predictor of receipt of care after controlling for other characteristics. Possibly their significance is absorbed on the one hand by the more general indicator of age and on the other hand by indicators of specific impairment types (especially learning, understanding and concentrating, and mental health). The younger-old group (65–69) and the oldest old group (age 75+) have higher probabilities of receiving any care than the middle-old group (70–74), for a given type and level of need. Again, looking across the panels, we can see this is a combination of an elevated chance of receiving formal care for the 75+ age group and a decreased chance of receiving informal care for the 70–74 age group. The middle-old age group seems to be at an increased risk of falling between the cracks.
Moving on to other demographic characteristics reported in the lower rows in the table, it is reassuring to note that neither gender nor ethnicity is significantly associated with either an increased or a decreased chance of receiving care overallFootnote 10, although several of the point estimates for ethnic minority groups are lower than for the White majority. However there does appear to be a significantly decreased chance of receiving formal care (panel B) – after controlling for indicators of need, informal care availability and economic means – for Black ethnic minority people of working age, and for Asian ethnic minority people aged 65 or over, and these results deserve further investigation (see also Greenwood et al., Reference Greenwood, Habibi, Smith and Manhtorpe2014).
As anticipated, among people of working age, having a partner or another adult in the household substantially increases the chance of receiving informal care, relative to being an adult living alone. For older people, having another adult in the household – perhaps a son or daughter – is also strongly protective. Conversely, for both age groups, having a partner substantially reduces the likelihood of receiving formal care, as does having another adult in the household for older people (though not for younger people). The combined effect for people of working age is that those with a partner or another adult are more likely to receive some care than people living alone, while for older people, those with a partner are actually less likely to receive care than people living alone because the increased availability of informal care only partially compensates for the substantial reduction in formal care.
Turning finally to the socio-economic characteristics included in the models, there are significant associations with household income, employment status for working-age people, and region/country within the UK. Compared to those in the lowest fifth of household incomesFootnote 11, those with incomes in the top three-fifths of the distribution are at an advantage across the board: more likely to receive informal care, more likely to receive formal care and, therefore, less likely to be without any care at all. The magnitude of these effects is substantially larger than many of those we have discussed hitherto. For example, a working-age adult in the top fifth of the distribution is 21 per cent more likely to receive some care than a similar adult in the bottom fifth of the distribution.Footnote 12 Similarly, an older adult in the top fifth of the distribution is 19 per cent more likely than an older adult in the bottom fifth to receive some care.
In relation to formal care, there are two opposite mechanisms: public long-term care is means-tested, giving greater access to those with low household incomes, while private care is expensive, giving greater access to those with high household incomes. The combined effect is that there is no statistically significant difference in the likelihood of the bottom two income groups receiving some formal care; and the overall gradient of probability of receiving care with income is flatter than would otherwise be the case. Means-tested long-term care ameliorates some of the inequality of access to care that would otherwise arise from differences in affordability, but does not eliminate it. This holds for both the working-age and older populations; the estimated gaps in the probability of receiving formal care between highest and lowest income households are similar for both age groups.
In relation to informal care, there is also a pronounced income gradient, with higher income groups being more likely to receive informal care than the lowest income group among the working-age population (fourth and fifth income quintile group are 23 per cent and 19 per cent more likely respectively) and to a lesser extent also among the older population (fourth income quintile group is 21 per cent more likely, top income group is not statistically significant).
The models for working-age people include employment status. Being in the labour force – whether that is employed or self-employed, full-time or part-time, or even unemployed and looking for work – is associated with a lower likelihood of receiving care, and this pattern holds for both formal and informal care. Many of those out of work but not classified as unemployed are unable to work as a result of long-term illness or disability, so given that we already control for household income, it may be that this variable reflects the severity of impairment and a recognised status as ‘long-term sick or disabled’ as much as it does economic status.
The reference category for the regional and country analysis is the North West of England. Compared to this region, and controlling for other characteristics including need, older people in Wales, Scotland and Northern Ireland appear to have relatively low likelihood of receiving any care (low point estimate but not significant in Wales, low and significant at 90 per cent level in Scotland and Northern Ireland). In the case of Wales, this reflects decreased chances of receiving formal care, relative to the reference region. In the case of Scotland and Northern Ireland, it is driven by limited access to informal care, with formal care partially but not fully compensating for this limited access. In Scotland, access to local authority personal care (a sub-set of social care) for the over-65s is not means-tested, and this may partly explain the positive coefficient on receipt of formal care here.
Turning to people of working age, those in Wales are more favourably situated. Other country differences are not significant for this age group, but there are differences within England. Receipt of informal care is comparatively high in the North East, the West Midlands, the East of England and London, but only in the case of the North East and the West Midlands does this feed through into increased chances of receiving some care overall. These regional differences in the availability of informal care, for people with a given level and type of need and after controlling for household characteristics, would merit further investigation.
Discussion and conclusion
There are limitations in what we are able to ascertain from the FRS data. Our indicators of need are broad-brush and not linked to specific activities, and we do not know which needs are being met by the care received, or to what extent. Moreover it is frustrating not to be able to separately identify the receipt of public and private formal care, although we know there are distinct barriers to accessing those services. On the other hand, FRS does contain a rich set of demographic and socio-economic information on a large and nationally representative sample of the UK household population. Uniquely, the questions about receipt of care cover the working-age disabled population as well older people: a key advantage from our point of view. The empirical results we have presented and discuss below are specific to the UK, but the challenge of meeting the needs of both working-age and older populations with care needs through a combination of formal and informal care is a universal one, so we believe our results have resonance with concerns across a wide range of rich and middle-income countries.
While the proportion of older people with high care needs is much higher, our findings confirm that the working-age population with care needs is large. Indeed working-age people make up around half of the total population with high care needs, according to the definitions used here, and this is consistent with the statistics quoted in the Introduction for EU-27 countries as a whole. Without in any way wishing to diminish the importance of investigating and addressing the growing needs of older people, we think it is important to ensure that working-age people with needs for long-term care are included in the debate about the future provision of support. This is especially important because there are differences between working-age and older people in their need profile and in how those needs are currently being met. This paper shows that people of working age with apparently similar levels of need (although there may be differences we do not observe in these data) are less likely to be receiving either formal or informal care services than their older counterparts; again this is a finding that is consistent with previous evidence for elsewhere in Europe (Eurostat, 2015).
On the whole, our results indicate that the systems of formal and informal care combine to meet a range of different needs effectively. We found no significant differences in the risk of unmet need between men and women, for example, and no systematic differences by type of impairment. There is a possible concern, however, that both formal and informal care tend to focus on people with high levels of need – leaving those with moderate, or high but not the highest levels of need, more exposed to receiving no help at all. This is particularly the case for people of working age within the ‘high needs’ group, for whom a lower number of difficulties was a significant predictor of receiving no help at all. Constraints on the provision of publicly-funded care services have been tightening across most countries, and the need for informal care is likewise outstripping supply: in these circumstances, it is understandable that resources are targeted on those with the highest need, but the corollary is that those with lesser, but still significant, needs are exposed to the risk of having those needs unmet.
Being in receipt of both formal and informal care is common, as we have seen, accounting for 8 per cent of working-age people and 16 per cent of older people in the high needs group in the UK. Of course services may be meeting different needs of the same person. This is consistent with international evidence suggesting that services are not perfect substitutes and may be partly complementary (Bolin et al., Reference Bolin, Lindgren and Lundborg2008). Formal care services need to be designed with this in mind: on the one hand, not to assume that the presence of an unpaid carer means that no formal intervention is required, and on the other hand, not to dismiss the carer's role once a formal service has been engaged.
Our results also provide support for the idea that the formal care system to some extent works to fill the gaps in population coverage left by informal care, and vice versa. People with partners and other adults in the household are more likely to receive informal care than adults living alone, for obvious reasons; adults living alone are correspondingly more likely than those with partners to receive formal services.
Despite these overlaps and complementarity between different modes of care, the analysis also highlights some significant gaps in provision, according to administrative area, household income and ethnicity. Although the findings are specific to the UK, these characteristics associated with variations in the risk of unmet need have broader relevance, since the implementation of long-term care provision is at least partially devolved to regional or local authorities in almost all rich and middle-income countries, and many countries have adopted charges or means-testing for some services. Disparity in access to services for ethnic minority groups is also a widespread problem (Sienkiewicz, Reference Sienkiewicz2010). Within the UK, formal services in Scotland and Northern Ireland for older people with high needs do not seem to be doing enough to compensate for a lower-than-average availability of informal care, and the barriers to accessing formal services for working-age Black ethnic minority groups with high levels of need, and for older Asian ethnic minority people, demand attention and are not compensated by any greater availability of informal care according to our analysis.
The concentration of publicly-funded long-term care on people with low incomes (through means-testing) appears to off-set the ability of those with higher incomes to purchase the care they need to some extent. The income gradient in the chance of receiving formal care is flatter at the bottom of the distribution than we would expect in the absence of publicly-funded care: we see no statistically significant difference between the bottom two-fifths of the income distribution among either the working-age or the older population. The bottom fifth are no less likely to receive formal care than the second fifth, even though the latter are more likely to be able to afford some paid-for care. But there is also an income gradient in the receipt of informal care, so the combined effect of the two systems is to put lower income households at greater risk of receiving no help at all than higher income households. People with high needs in the bottom fifth of the income distribution are around 20 per cent less likely to receive any care than those in the top fifth, among both the working-age and older population, even after controlling for other differences in their characteristics and circumstances.
There are no quick fixes for meeting these unmet needs but a closer appreciation of the particular shape of the formal and informal care systems in the country in question, and where they overlap, re-enforce, complement or operate in ignorance of one another should help to guide the development of policy in the future. Groups at elevated risk of unmet need – including those with high but not the highest levels of need, adults living alone, and low to middle income households – should be at the forefront. Addressing their needs might take the form of expanding and targetting publicly-funded services; providing easier and cheaper access to paid-for formal services could also have a role for those in the middle of the income distribution. Valuing and supporting informal care is also likely to be important, and we have noted that this is often complementary to, rather than a substitute for, formal services. It is also uneven in its geographical and demographic coverage.
Beyond the question of quantity of care with which this paper has principally been concerned, is the question of the quality and nature of care and caring relationships (Lewis and West, Reference Lewis and West2014; Fine, Reference Fine2007). Carers themselves, whether paid or unpaid, and the conditions they work in, are critical to that dimension. Systems of care, in whatever mix of formal and informal services, will only deliver the outcomes people need if carers and the people they care for – both working-age and older – are at the heart of designing and developing them.
Acknowledgements
We are very grateful to Nic Brimblecome, Polly Vizard, participants at the APPAM annual conference in July 2016, and JSP editors and reviewers for comments and discussion on earlier drafts.
Some of the early work underpinning this manuscript was supported by the ‘Social Policy in a Cold Climate’ programme at the Centre for Analysis of Social Exclusion, funded by the Nuffield Foundation, Joseph Rowntree Foundation and Trust for London. We are enormously grateful to these funders for their support; any opinions expressed in this paper are those of the authors and not necessarily those of the funders.
We are grateful to the UK Data Archive and the Department for Work and Pensions for making available data from the Family Resources Survey (DWP et al., 2014; 2015b). Crown copyright material is reproduced with the permission of the Controller of HMSO and the Queen's Printer for Scotland. Although all efforts are made to ensure the quality of the materials, neither the original data creators, depositors or copyright holders, the funders of the data collections, nor the UK Data Archive, nor the UK Data Service bear any responsibility for the accuracy or comprehensiveness of these materials.
Supplementary material
To view supplementary material for this article, please visit https://doi.org/10.1017/S0047279417000903