





Institutional rearing is associated with severe psychosocial deprivation and places children at heightened risk for long-term neurodevelopmental challenges, including differences in cognitive and psychosocial functioning (King et al., Reference King, Guyon-Harris, Valadez, Radulescu, Fox, Nelson, Zeanah and Humphreys2023; Nelson et al., Reference Nelson, Fox and Zeanah2014). Since Roy et al. (Reference Roy, Rutter and Pickles2000) first noted that children raised in institutional care had lower inhibitory control performance and greater symptoms of inattention and hyperactivity than those in stable foster care, multiple studies have documented a link between institutional care and differences in executive functions, the broad set of cognitive processes involved in monitoring and adjusting one’s behavior to achieve behavioral goals (Bick et al., Reference Bick, Zeanah, Fox and Nelson2018; Buzzell et al., Reference Buzzell, Troller-Renfree, Wade, Debnath, Morales, Bowers, Zeanah, Nelson and Fox2020; Debnath et al., Reference Debnath, Troller-Renfree, Zeanah, Nelson and Fox2023; Dydenkova et al., Reference Dydenkova, McGlone, Mayorova and Nikolaeva2024; Frenkel et al., Reference Frenkel, Donzella, Frenn, Rousseau, Fox and Gunnar2020; Gunnar & Reid, Reference Gunnar and Reid2019; Hostinar et al., Reference Hostinar, Stellern, Schaefer, Carlson and Gunnar2012; Lewis et al., Reference Lewis, Lopez, Hunt, Hodel, Gunnar and Thomas2024; Loman et al., Reference Loman, Johnson, Westerlund, Pollak, Nelson and Gunnar2013; McDermott et al., Reference McDermott, Troller-Renfree, Vanderwert, Nelson, Zeanah and Fox2013; Peñarrubia et al., Reference Peñarrubia, Palacios and Román2020; Tibu et al., Reference Tibu, Sheridan, McLaughlin, Nelson, Fox and Zeanah2016; Troller-Renfree et al., Reference Troller-Renfree, Nelson, Zeanah and Fox2016; Wade et al., Reference Wade, McLaughlin, Buzzell, Fox, Zeanah and Nelson2023; Zeytinoglu et al., Reference Zeytinoglu, Tang, Zeanah, Nelson, Almas and Fox2023). Error monitoring, the ability to detect one’s own mistakes, is a key facet of executive functioning that is particularly valuable to developmental researchers because it is linked to both internalizing and externalizing psychopathology and can be reliably measured across modalities including with EEG (Olvet & Hajcak, Reference Olvet and Hajcak2008). The present study investigates the long-term impact of a foster care intervention as an alternative to institutional care on young adults’ error monitoring skills and links to psychopathology and cognitive function.
The Bucharest Early Intervention Project (BEIP) is a randomized controlled trial in which institutionalized infants in Bucharest, Romania were randomized to be either removed from institutions and placed into high-quality foster care (FCG) or receive care as usual (CAUG), along with a group of never institutionalized (NIG) children (Zeanah et al., Reference Zeanah, Nelson, Fox, Smyke, Marshall, Parker and Koga2003) matched on demographics. The BEIP aimed to investigate the physical, cognitive, neural, and psychosocial consequences of institutional care and the effects of foster care intervention (Nelson et al., Reference Nelson, Fox and Zeanah2014; Zeanah et al., Reference Zeanah, Nelson, Fox, Smyke, Marshall, Parker and Koga2003). Findings both from BEIP and other independent samples have revealed long-term error monitoring differences in previously institutionalized children that persist at least through adolescence (Buzzell et al., Reference Buzzell, Troller-Renfree, Wade, Debnath, Morales, Bowers, Zeanah, Nelson and Fox2020; Debnath et al., Reference Debnath, Troller-Renfree, Zeanah, Nelson and Fox2023; Frenkel et al., Reference Frenkel, Donzella, Frenn, Rousseau, Fox and Gunnar2020; Loman et al., Reference Loman, Johnson, Westerlund, Pollak, Nelson and Gunnar2013; McDermott et al., Reference McDermott, Troller-Renfree, Vanderwert, Nelson, Zeanah and Fox2013; Troller-Renfree et al., Reference Troller-Renfree, Nelson, Zeanah and Fox2016).
One of the most well-studied measures of error monitoring is the error-related negativity (ERN), an event-related potential (ERP) measured via EEG (Falkenstein et al., Reference Falkenstein, Hohnsbein, Hoormann and Blanke1991). The ERN is a negative voltage deflection that is sensitive to error commission. It is maximal at frontocentral electrode sites, generated primarily by the anterior cingulate cortex and posterior cingulate cortex (Buzzell et al., Reference Buzzell, Troller-Renfree, Barker, Bowman, Chronis-Tuscano, Henderson, Kagan, Pine and Fox2017; Conte et al., Reference Conte, Richards, Fox, Valadez, McSweeney, Tan, Pine, Winkler, Liuzzi, Cardinale, White and Buzzell2023; Dehaene et al., Reference Dehaene, Posner and Tucker1994; Van Veen & Carter, Reference Van Veen and Carter2002), and generally peaks within 100 ms following error commission. Meta-analytic evidence supports the ERN as a potential biomarker for psychopathology, with anxiety symptoms associated with larger (more negative) amplitudes (Moser et al., Reference Moser, Moran, Schroder, Donnellan and Yeung2013) and externalizing symptoms associated with smaller (less negative) amplitudes (Lutz et al., Reference Lutz, Kok, Verveer, Malbec, Koot, van Lier and Franken2021).
Previous work consistently finds differences in ERN amplitude between children and adolescents exposed to early institutional care and those who have never been institutionalized (Debnath et al., Reference Debnath, Troller-Renfree, Zeanah, Nelson and Fox2023; Loman et al., Reference Loman, Johnson, Westerlund, Pollak, Nelson and Gunnar2013; McDermott et al., Reference McDermott, Troller-Renfree, Vanderwert, Nelson, Zeanah and Fox2013; Troller-Renfree et al., Reference Troller-Renfree, Nelson, Zeanah and Fox2016). Effects of foster care on the ERN appear to be late-emerging, with no significant group differences between foster care and continued institutional care from middle childhood to age 12 years (Loman et al., Reference Loman, Johnson, Westerlund, Pollak, Nelson and Gunnar2013; McDermott et al., Reference McDermott, Troller-Renfree, Vanderwert, Nelson, Zeanah and Fox2013; Troller-Renfree et al., Reference Troller-Renfree, Nelson, Zeanah and Fox2016). However, at BEIP’s age 12 follow-up, there was a marginally significant effect of intervention on the ∆ERN (the amplitude difference between the ERN and its correct-trial counterpart, the correct-related negativity or CRN), and greater time spent in institutional care predicted smaller (less negative) ∆ERNs, potentially signaling an emerging intervention effect (Troller-Renfree et al., Reference Troller-Renfree, Nelson, Zeanah and Fox2016). By age 16 years, intervention effects were more clearly evident such that the CAUG showed significantly smaller (less negative) ∆ERNs than the FCG (Debnath et al., Reference Debnath, Troller-Renfree, Zeanah, Nelson and Fox2023). Nevertheless, across multiple ages and even in the absence of intervention group differences, ERN amplitude has been associated with psychosocial functioning in the BEIP at age 8, 12, and 16 years (Debnath et al., Reference Debnath, Troller-Renfree, Zeanah, Nelson and Fox2023; McDermott et al., Reference McDermott, Troller-Renfree, Vanderwert, Nelson, Zeanah and Fox2013; Troller-Renfree et al., Reference Troller-Renfree, Nelson, Zeanah and Fox2016), albeit sometimes in different directions, likely due to differences in analytic approach (e.g., focusing on the ∆ERN vs. the ERN). Together, these findings support the ERN as a relevant and sensitive biomarker among previously institutionalized children.
In addition to ERP measures, error-monitoring-related EEG activity can also be characterized in terms of power at specific frequency bands. Mid-frontal oscillatory activity in the theta band (4–8 Hz) is thought to be a mechanism by which populations of neurons compute and coordinate top-down control across broad brain networks (Beatty et al., Reference Beatty, Buzzell, Roberts and McDonald2020; Buzzell et al., Reference Buzzell, Barker, Troller-Renfree, Bernat, Bowers, Morales, Bowman, Henderson, Pine and Fox2019, Reference Buzzell, Troller-Renfree, Wade, Debnath, Morales, Bowers, Zeanah, Nelson and Fox2020; Cavanagh & Frank, Reference Cavanagh and Frank2014; Shner-Livne et al., Reference Shner-Livne, Buzzell, Fox and Shechner2024; Valadez & Simons, Reference Valadez and Simons2018). Three studies examined mid-frontal theta activity in previously institutionalized youth. In the BEIP, adolescents in the CAUG had lower mid-frontal theta power compared to those in the FCG at 16 years (Buzzell et al., Reference Buzzell, Troller-Renfree, Wade, Debnath, Morales, Bowers, Zeanah, Nelson and Fox2020; Debnath et al., Reference Debnath, Troller-Renfree, Zeanah, Nelson and Fox2023; Wade et al., Reference Wade, McLaughlin, Buzzell, Fox, Zeanah and Nelson2023), and lower theta power was associated with both greater exposure to stressful life events (Wade et al., Reference Wade, McLaughlin, Buzzell, Fox, Zeanah and Nelson2023) and elevated symptoms of general and externalizing psychopathology (Buzzell et al., Reference Buzzell, Troller-Renfree, Wade, Debnath, Morales, Bowers, Zeanah, Nelson and Fox2020; Debnath et al., Reference Debnath, Troller-Renfree, Zeanah, Nelson and Fox2023). Together, these findings suggest the development of adolescent mid-frontal theta is affected by institutional care and may also be linked to psychosocial functioning.
It remains unclear whether the effects of institutional care (or subsequent placement into foster care) on children’s brain functioning persist beyond adolescence. The current study addresses this question by examining young adults’ data from BEIP’s most recent follow-up. Specifically, we used behavioral and EEG measures collected during a flanker task administered at age 22 years. Consistent with BEIP findings examining the effect of institutional rearing on adolescent error monitoring (Buzzell et al., Reference Buzzell, Troller-Renfree, Wade, Debnath, Morales, Bowers, Zeanah, Nelson and Fox2020; Debnath et al., Reference Debnath, Troller-Renfree, Zeanah, Nelson and Fox2023; Wade et al., Reference Wade, McLaughlin, Buzzell, Fox, Zeanah and Nelson2023), we predicted that the FCG would show behavioral and neural differences from the CAUG, evidenced by better task performance, larger (more negative) ∆ERN amplitude, and greater error-related mid-frontal theta power. We also explored whether this profile of behavioral and neural functioning was associated with cognitive and psychosocial functioning in early adulthood. We did not make explicit hypotheses about whether error monitoring would differ between the FCG and NIG.
Method
Participants
At the baseline assessment, participants were 136 children who had been placed into institutional care in Bucharest, Romania. These children were randomized to either remain in institutions and receive care as usual (CAUG; n = 68) or be placed in foster care (FCG; n = 68; see CONSORT diagram in Figure 1). A group of 72 children with no history of exposure to institutional care (NIG) were also recruited at baseline. At the 22-year assessment, 43 CAUG (21 female), 47 FCG (26 female), and 43 NIG (28 female) completed a flanker task. The mean age at the 22-year assessment was 23.47 years (SD = 0.95) for CAUG, 23.39 years (SD = 0.91) for FCG, and 23.60 years (SD = 1.02) for NIG. Although many of the participants experienced placement changes at some point during childhood or adolescence, analyses presented here use an intent-to-treat (ITT) approach, such that data are analyzed using each child’s initial random group assignment. This conservative approach maintains the integrity of the initial randomization and ensures that observed group differences can be attributed to the intervention rather than subsequent caregiving experiences. The University Institutional Review Boards of the principal investigators (Fox, Nelson & Zeanah) and the University of Bucharest approved the 22-year study protocol. Informed consent was obtained from each participant.
CONSORT diagram.

Figure 1. Long description
The flowchart is divided into two main sections: Institutional Rearing and Community Controls. Institutional Rearing starts with 187 participants assessed for eligibility, with 51 excluded for not meeting criteria, leaving 136 randomized at baseline into two groups: foster care and care as usual. Each group undergoes multiple follow-ups at ages 8, 12, 16, and 22 years, with assessments and various outcomes such as adoption, return to biological family, and discontinuation. Community Controls start with 78 participants, with 6 excluded, leaving 72 never institutionalized. Follow-ups at ages 8, 12, 16, and 22 years show assessments, retention, and discontinuation. The flowchart details the progression and outcomes at each stage, highlighting the long-term impact of institutional rearing versus community controls.
Flanker task
Participants completed a flanker task that was identical to that administered at earlier BEIP time points (Debnath et al., Reference Debnath, Troller-Renfree, Zeanah, Nelson and Fox2023; Troller-Renfree et al., Reference Troller-Renfree, Nelson, Zeanah and Fox2016). In each trial, stimuli consisted of five arrows presented horizontally on a computer screen with E-Prime software (Psychology Software Tools, Inc., Pittsburgh, PA). Half of the trials were congruent trials, meaning that all the arrows faced the same direction (<<<<< or >>>>>), whereas the other half were incongruent trials with the middle arrow facing the opposite direction from the four flanking arrows (<<><< or >><>>). Participants were instructed to respond as quickly and accurately as possible, indicating the direction of the middle arrow with either a left or right button press. Participants completed 20 practice trials followed by 160 test trials (80 congruent, 80 incongruent). Trials began with the presentation of a warning cue (*****) lasting 500 ms, followed by a brief blank screen, the presentation of the flanker stimulus, and another blank screen for 500 ms.
To help ensure adequate numbers of errors for EEG analysis, the duration of the stimulus presentation was continuously adapted based on performance on earlier trials. Specifically, if a participant’s cumulative accuracy was greater than 60%, the subsequent trial’s stimulus presentation was shortened by 50 ms. If cumulative accuracy was greater than 60%, the subsequent trial’s stimulus presentation was lengthened by 50 ms. Additionally, stimulus presentation durations were randomly jittered by one of three values: −60, −10, and +40 ms. The intertrial interval was also randomly jittered to one of four durations: 773, 790, 807, or 824 ms. Response time and accuracy were recorded for each trial.
EEG data recording and preprocessing
EEG data were recorded with a 64-channel HydroCel Geodesic Sensor Net connected to a NetAmps 300 amplifier (Electrical Geodesics, Inc., Eugene, OR). The Cz electrode was used as the online reference, and data were sampled at 500 Hz. Impedances were kept below 50 kΩ. EEG data were processed in MATLAB (MathWorks, Natick, MA) with the MADE preprocessing pipeline (Debnath et al., Reference Debnath, Buzzell, Morales, Bowers, Leach and Fox2020), which uses the EEGLAB toolbox (Delorme & Makeig, Reference Delorme and Makeig2004) and its plugins “firfilt,” “FASTER” (Nolan et al., Reference Nolan, Whelan and Reilly2010), “ADJUST” (Mognon et al., Reference Mognon, Jovicich, Bruzzone and Buiatti2011), and “Adjusted-ADJUST” (Leach et al., Reference Leach, Morales, Bowers, Buzzell, Debnath, Beall and Fox2020). All default options of the MADE pipeline were used. Data were re-referenced to an average reference and filtered with a Hamming windowed digital finite impulse response filter. Data were high-pass filtered at 0.3 Hz with a half-amplitude cutoff frequency of 0.15 Hz. Data were low-pass filtered at 40 Hz with a half-amplitude cutoff frequency of 45 Hz. FASTER was used to identify globally bad channels. Additionally, channels were marked bad at the epoch level if voltage exceeded ±125 μV within the epoch, and any epochs in which more than 10% of non-ocular channels exceeded this threshold were marked bad. Otherwise, bad channels were interpolated via a spherical-spline interpolation. Ocular artifact detection and removal were performed with independent component analysis (ICA) paired with Adjusted-ADJUST, an automated algorithm for identifying artifactual ICA components. EEG data were then segmented into 6-s epochs starting 3,000 ms before and ending 3,000 ms after response onset. Epochs with such long lengths were extracted to prevent edge artifacts that can be associated with power spectra calculation. All subsequent EEG analysis steps were performed using the FieldTrip toolbox (Oostenveld et al., Reference Oostenveld, Fries, Maris and Schoffelen2010).
ERP analysis
In line with prior BEIP reports (Debnath et al., Reference Debnath, Troller-Renfree, Zeanah, Nelson and Fox2023; Troller-Renfree et al., Reference Troller-Renfree, Nelson, Zeanah and Fox2016), participants were included in ERP and time–frequency analyses if they had at least 10 artifact-free incongruent error trials or 10 artifact-free incongruent correct trials following preprocessing. This resulted in excluding 33 participants’ error-trial measures (CAUG = 7, FCG = 10, NIG = 16) and 10 participants’ correct-trial measures (CAUG = 4, FCG = 1, NIG = 5) from analyses. However, participants were included in analyses if they had at least one of these measures; therefore, only six participants were ultimately excluded from analyses (CAUG = 1, FCG = 1, NIG = 4), for a final analyzed sample size of N = 127 (CAUG = 42, FCG = 46, NIG = 39).
To compute ERPs, incongruent correct and incongruent error trials were separately averaged for each participant and baseline corrected using the average voltage from −200 to −100 ms relative to the button response. As in previous BEIP work, the CRN and ERN were quantified as the average voltage at FCz (where amplitude was maximal) from −50 to +100 ms relative to the response during incongruent correct and incongruent error trials, respectively.
Time–frequency analysis
Time–frequency analysis was performed with procedures first described by Tallon-Baudry and colleagues (Tallon-Baudry et al., Reference Tallon-Baudry, Bertrand, Delpuech and Pernier1997). Complex Morlet wavelets were multiplied with single-trial data in the frequency domain from 1 to 30 Hz (in 60 logarithmically spaced bins) prior to inverse Fourier transform, in steps of 50 ms. The wavelet cycles were set at three cycles at the lowest frequency (1 Hz), increasing logarithmically to seven cycles at the highest frequency (30 Hz). The time–frequency representation of power was calculated by squaring the magnitudes of the resulting complex vectors and then averaging these values across same-type trials. Spectral power was calculated separately for incongruent correct and incongruent error trials and was expressed as decibels (dB) relative to the −200 to −100 ms baseline period. As in previous BEIP reports, the primary activity of interest was theta (4–8 Hz) power at FCz, averaged from 0 to 200 ms relative to the response.
Wechsler Adult Intelligence Scale-Fourth Edition (WAIS-IV)
The WAIS-IV (Wechsler, Reference Wechsler2008) is a standardized, individually administered assessment of adult cognitive abilities. At the 22-year assessment, 10 subtests were administered by trained and reliable Romanian psychologists, assessing perceptual reasoning, verbal comprehension, working memory, and processing speed. In the present study, Full Scale IQ, a composite measure of overall intellectual ability, was used in analyses to test potential correlations with neural measures. Full Scale IQ scores are standardized to have a population mean of 100 and standard deviation of 15. Scores were standardized based on participants’ actual ages at the time of testing.
Adult Self-Report (ASR)
The ASR (Achenbach & Rescorla, Reference Achenbach and Rescorla2003) is a self-report questionnaire that asks about 123 emotional and behavioral problems rated from 0 (not true) to 2 (very true or often true). Raw total scores from the 22-year assessment were used as a measure of overall psychosocial functioning to test potential correlations with neural measures, though results involving internalizing and externalizing subscale scores are also presented. In the current sample, the ASR had high internal consistency (Cronbach’s alpha = 0.95, McDonald’s omega = 0.96).
Data analytic plan
Accuracy effects were assessed using repeated-measures analyses of variance (ANOVAs) using R Version 4.52. Group (CAUG, FCG for ITT analyses; CAUG, FCG, NIG for complete group analyses) served as a between-subjects factor and trial type (congruent, incongruent) served as a within-subjects factor. Reaction time (RT) effects were also assessed using repeated-measures ANOVA with group as a between-subjects factor and trial type (congruent, incongruent) or response type (correct, incorrect) served as within-subjects factors. Significant group effects were followed up with pairwise comparisons, which are reported with both unadjusted and Benjamini–Hochberg (BH)-adjusted significance values. Extreme RTs (< 200 or >1200) were excluded as outliers.
EEG analyses focused only on incongruent trials and used linear mixed-effects models (LMMs) to account for data missingness. LMMs were implemented with the “lmer” function from the R package “lme4” (version 1.1–38) and included response type (correct, incorrect) and group (CAUG, FCG for ITT analyses; CAUG, FCG, NIG for complete group analyses) as fixed-effect factors, along with their interaction. To account for participant-level variability, a random intercept was included. Significance testing for fixed effects was performed using Type III Sums of Squares with denominator degrees of freedom estimated with Kenward–Roger approximation. This approximation method was chosen due to being relatively conservative and more reliable for moderate sample sizes. Pairwise post hoc comparisons of marginal means are reported with both unadjusted and Tukey-adjusted p-values. Using this LMM approach, potential group differences in the ∆ERN could be evaluated by examining the group × response type interactions. This explicit modeling of the interaction was chosen over the more common subtraction-based difference scores because subtraction-based scores compound the imperfect reliabilities of the two constituent scores, especially when the constituent scores are strongly correlated (Clayson et al., Reference Clayson, Baldwin and Larson2021; Meyer et al., Reference Meyer, Lerner, Reyes, Laird and Hajcak2017) as is typically the case with the ERN and CRN. Finally, to examine whether group effects were specific to the ERN/CRN and theta power, analyses of the error positivity (Pe) ERP component and delta power (1.5–3 Hz) were also performed and are reported in the supplement.
Results
Accuracy
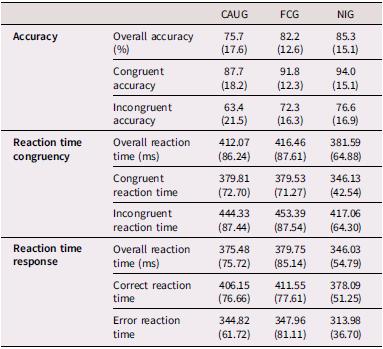
See Table 1 for descriptive statistics of task behavior. ITT analyses (CAUG vs. FCG) revealed a main effect of trial type, F(1,81) = 149.60, p < .001, η 2 p = 0.649, with higher accuracy across groups on congruent (M = 89.84%, SD = 15.54) than incongruent trials (M = 67.97%, SD = 19.44). Neither the main effect of group (F(1, 81) = 3.74, p = .057, η 2 p = 0.044) nor the group × trial type interaction (F(1, 81) = 1.87, p = .175, η 2 p = 0.023) were significant.
Reaction time and accuracy across groups

Table 1. Long description
A table comparing reaction time and accuracy across three groups: CAUG, FCG, and NIG. The table has three main sections: Accuracy, Reaction time congruency, and Reaction time response. Each section contains multiple rows with specific metrics. Accuracy section includes Overall accuracy, Congruent accuracy, and Incongruent accuracy. Reaction time congruency section includes Overall reaction time, Congruent reaction time, and Incongruent reaction time. Reaction time response section includes Overall reaction time, Correct reaction time, and Error reaction time. Each metric is presented with mean values and standard deviations for each group. For example, in the Accuracy section, CAUG has an Overall accuracy of 75.7 percent (17.6), FCG has 82.2 percent (12.6), and NIG has 85.3 percent (15.1). The table provides a detailed comparison of these metrics across the groups.
Note. Standard deviations in parentheses. CAUG = care-as-usual group; FCG = foster care group; NIG = never-institutionalized group.
Complete group analyses comparing the CAUG and FCG with the NIG revealed a main effect of trial type, F(1, 122) = 242.26, p < .001, η 2 p = 0.665), such that participants across groups responded more accurately on congruent (M = 91.17%, SD = 15.36) compared to incongruent trials (M = 70.88, SD = 18.93). Analyses also indicated a main effect of group (F(2, 122) = 4.33, p = .015, η 2 p = 0.066) with participants in the NIG (t(162) = 2.99, p = .003, p-adj = .005, d = 0.47) outperforming those in the CAUG. The FCG also somewhat outperformed the CAUG, but this effect was only marginally significant after adjusting for multiple comparisons (t(164) = 2.04, p = .043, p-adj = .052, d = 0.32). There was no difference in accuracy of the NIG and FCG, t(168) = 1.19, p = .234, p-adj = .283, d = 0.18. The group × trial type interaction was not significant, F(2, 122) = 2.43, p = .093, η 2 p = 0.038.
Congruency reaction time
ITT analyses revealed a main effect of congruency, F(1,81) = 261.17, p < .001, η 2 p = .763, with slower responses on incongruent (M = 448.86 ms, SD = 87.09) compared to congruent trials (M = 379.67 ms, SD = 71.53). Both the main effect of group, F(1,81) = 0.07, p = .798, η 2 p = 0.001, and the group × congruency interaction effect, F(1,81) = 1.18, p = .280, η 2 p = 0.014, were not significant.
The complete group analysis including the NIG revealed a main effect of congruency, F(1,122) = 436.14, p < .001, η 2 p = 0.781, with slower responses on incongruent trials (M = 438.29 ms, SD = 81.31) compared to congruent trials (M = 368.40 ms, SD = 65.07). Results also revealed a significant main effect of group, F(2,122) = 3.09, p = .049, η 2 p = 0.048, with post hoc pairwise comparisons indicating that the NIG (M = 381.59 ms, SD = 64.88) responded significantly faster than both the FCG (M = 416.46 ms, SD = 87.61; t(168) = −2.94, p = .005, p-adj = .015, d = −0.45) and CAUG (M = 412.07 ms, SD = 86.24; t(162) = −2.57, p = .016, p-adj = .024, d = −0.40), who did not differ from one another (t(164) = 0.33, p = .725, p-adj = .725, d = 0.05). The group × congruency interaction was not significant, F(2,122) = 0.67, p = .513, η 2 p = 0.011.
Response type reaction time
ITT analyses revealed a significant main effect of response type, F(1,81) = 203.21, p < .001, η 2 p = 0.715, with faster responses on incorrect trials (M = 346.47 ms, SD = 72.03) compared to correct trials (M = 409.10 ms, SD = 76.72). Neither the main effect of group, F(1,81) = 0.07, p = .788, η 2 p = 0.001, nor the group × response type interaction, F(1,81) = 0.07, p = .798, η 2 p = 0.001, were significant.
A complete group analysis including the NIG revealed a significant main effect of response type, F(1,122) = 329.07, p < .001, η 2 p = 0.730, with faster responses on incorrect trials (M = 335.54 ms, SD = 64.11) compared to correct trials (M = 398.58 ms, SD = 70.54), as well as a main effect of group, F(2,122) = 3.54, p = .032, η 2 p = 0.055. Post hoc pairwise comparisons indicated that the NIG (M = 346.03 ms, SD = 54.79) responded significantly faster than both the FCG (M = 379.75 ms, SD = 85.14; t(168) = −3.06, p = .003, p-adj = 0.009, d = −0.47) and CAUG (M = 375.48 ms, SD = 75.72; t(162) = −2.86, p = .011, p-adj = .016, d = −0.45), which did not differ (t(164) = 0.34, p = .707, p-adj = .707, d = 0.05). The group × response type interaction was not significant, F(2,122) = 0.06, p = .943, η 2 p = 0.001.
ERN/CRN amplitude
ERP waveforms are shown in Figure 2. ITT analyses (CAUG vs. FCG) revealed a main effect of group, F(1,84.27) = 5.14, p = .026, η 2 p = 0.06, with larger (more negative) amplitudes in the CAUG (M = −0.41 microvolts, 95% CI [−0.93, 0.12]) compared to the FCG group (M = 0.42 microvolts, 95% CI [−0.08, 0.92]). There was also a main effect of response type, F(1,77.93) = 13.48, p < .001, η 2 p = 0.15, with larger (more negative) amplitudes on error trials (M = −0.49 microvolts, 95% CI [−0.96, −0.03]) compared to correct trials (M = 0.50 microvolts, 95% CI [0.07, 0.94]). The group × response type interaction was not significant, F(1,77.93) = 0.15, p = .704, η 2 p = 0.002.
Response-locked waveforms at FCz. Note. CAUG = care-as-usual group; FCG = foster care group; NIG = never-institutionalized group.

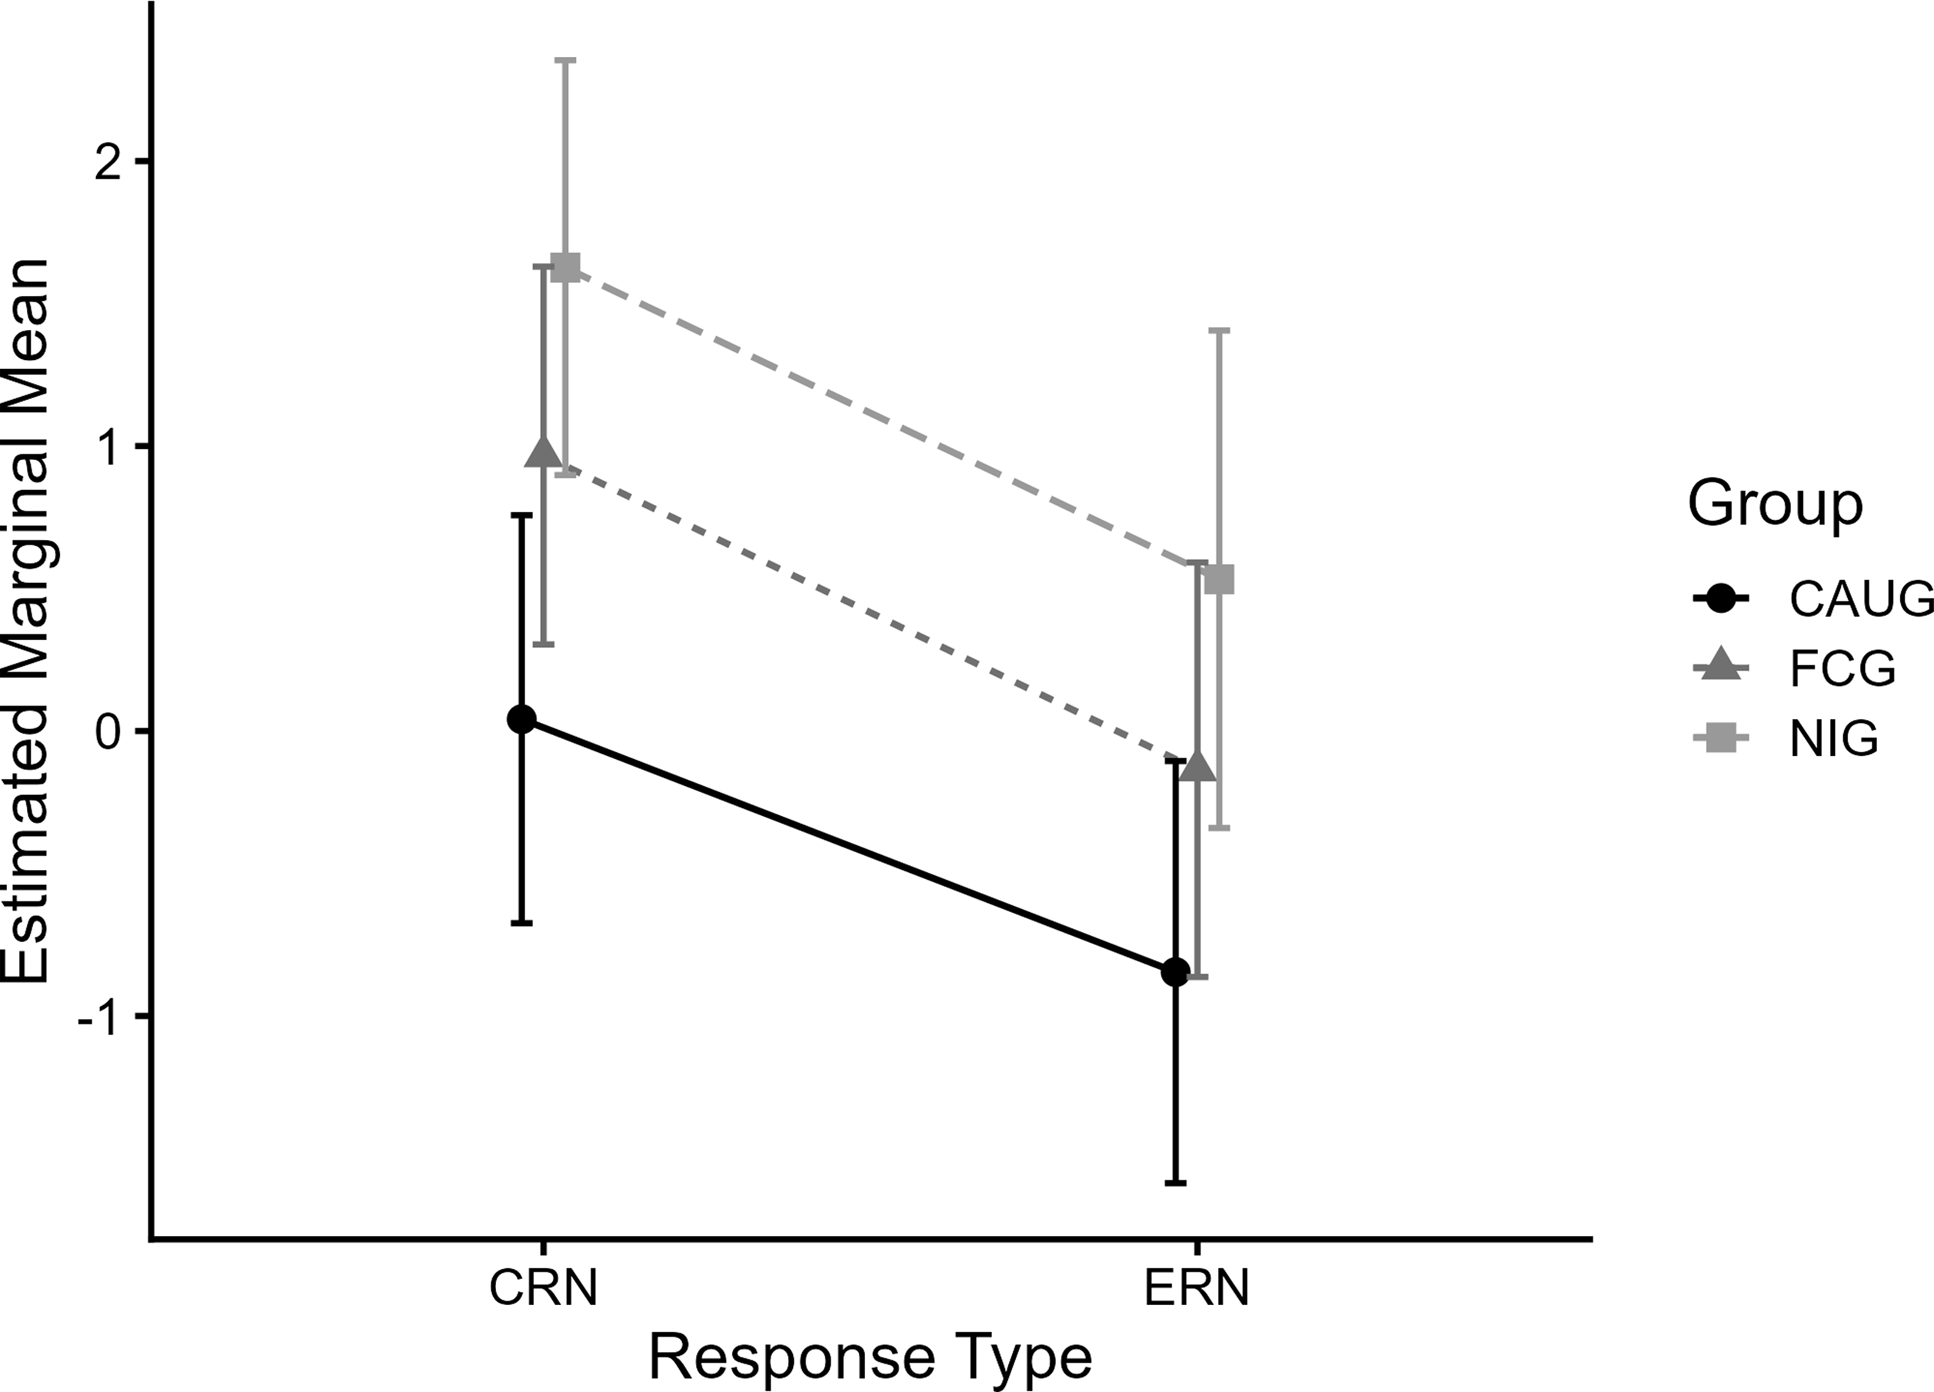
The complete group analysis including the NIG (Figure 3) also revealed a main effect of group, F(2,123.61) = 5.45, p = .005, η 2 p = 0.08, with post hoc pairwise comparisons indicating significantly larger (more negative) amplitudes in the CAUG (M = −0.40 microvolts, 95% CI [−1.01, 0.20]) compared to the NIG group (M = 1.08 microvolts, 95% CI [0.42, 1.74]; t(127) = −3.28, p = .001, p-adj = .004, d = −0.85). None of the other pairwise group comparisons was significant (CAUG vs. FCG: t(118) = −1.93, p = .056, p-adj = .135, d = −0.47; FCG vs. NIG: t(127) = −1.50, p = .136, p-adj = .213, d = -0.38). There was also a main effect of response type, F(1,107.70) = 17.32, p < .001, η 2 p = 0.14, with larger (more negative) amplitudes on error trials (M = −0.15 microvolts, 95% CI [−0.60, 0.30]) compared to correct trials (M = 0.88 microvolts, 95% CI [0.47, 1.28]). The group × response type interaction was not significant, F(1,81.14) = 0.73, p = .396, η 2 p = 0.01.
Event-related potential model-estimated means. Note. Figure shows results from the full model comparing all three groups. The intent-to-treat model comparing the care-as-usual group (CAUG) to the foster care group (FCG) revealed significantly larger (more negative) event-related potential amplitudes in CAUG compared to FCG (p = .026). The full model including the never-institutionalized group (NIG) also revealed a main effect of group, with pairwise comparisons indicating significantly larger (more negative) amplitudes in the CAUG compared to the NIG (p = .001, p-adj = .004). Both models additionally revealed a main effect of response type (ps < .001). CRN = correct-related negativity; ERN = error-related negativity. Error bars show 95% confidence intervals.

Theta power
Time–frequency representations of power are shown in Figure 4. The ITT analyses revealed a main effect of response type, F(1,81.14) = 71.80, p < .001, η 2 p = 0.47, with greater theta power on error trials (M = 1.55 dB, 95% CI [1.16, 1.92]) compared to correct trials (M = −0.65 dB, 95% CI [−1.00, −0.29]). There was no significant main effect of group, F(1,82.00) = 1.91, p = .170, η 2 p = 0.02, or group × response type interaction, F(1,81.14) = 0.73, p = .396, η 2 p = 0.01.
Response-locked time–frequency representations of power at FCz. Note. CAUG = care-as-usual group; FCG = foster care group; NIG = never-institutionalized group.

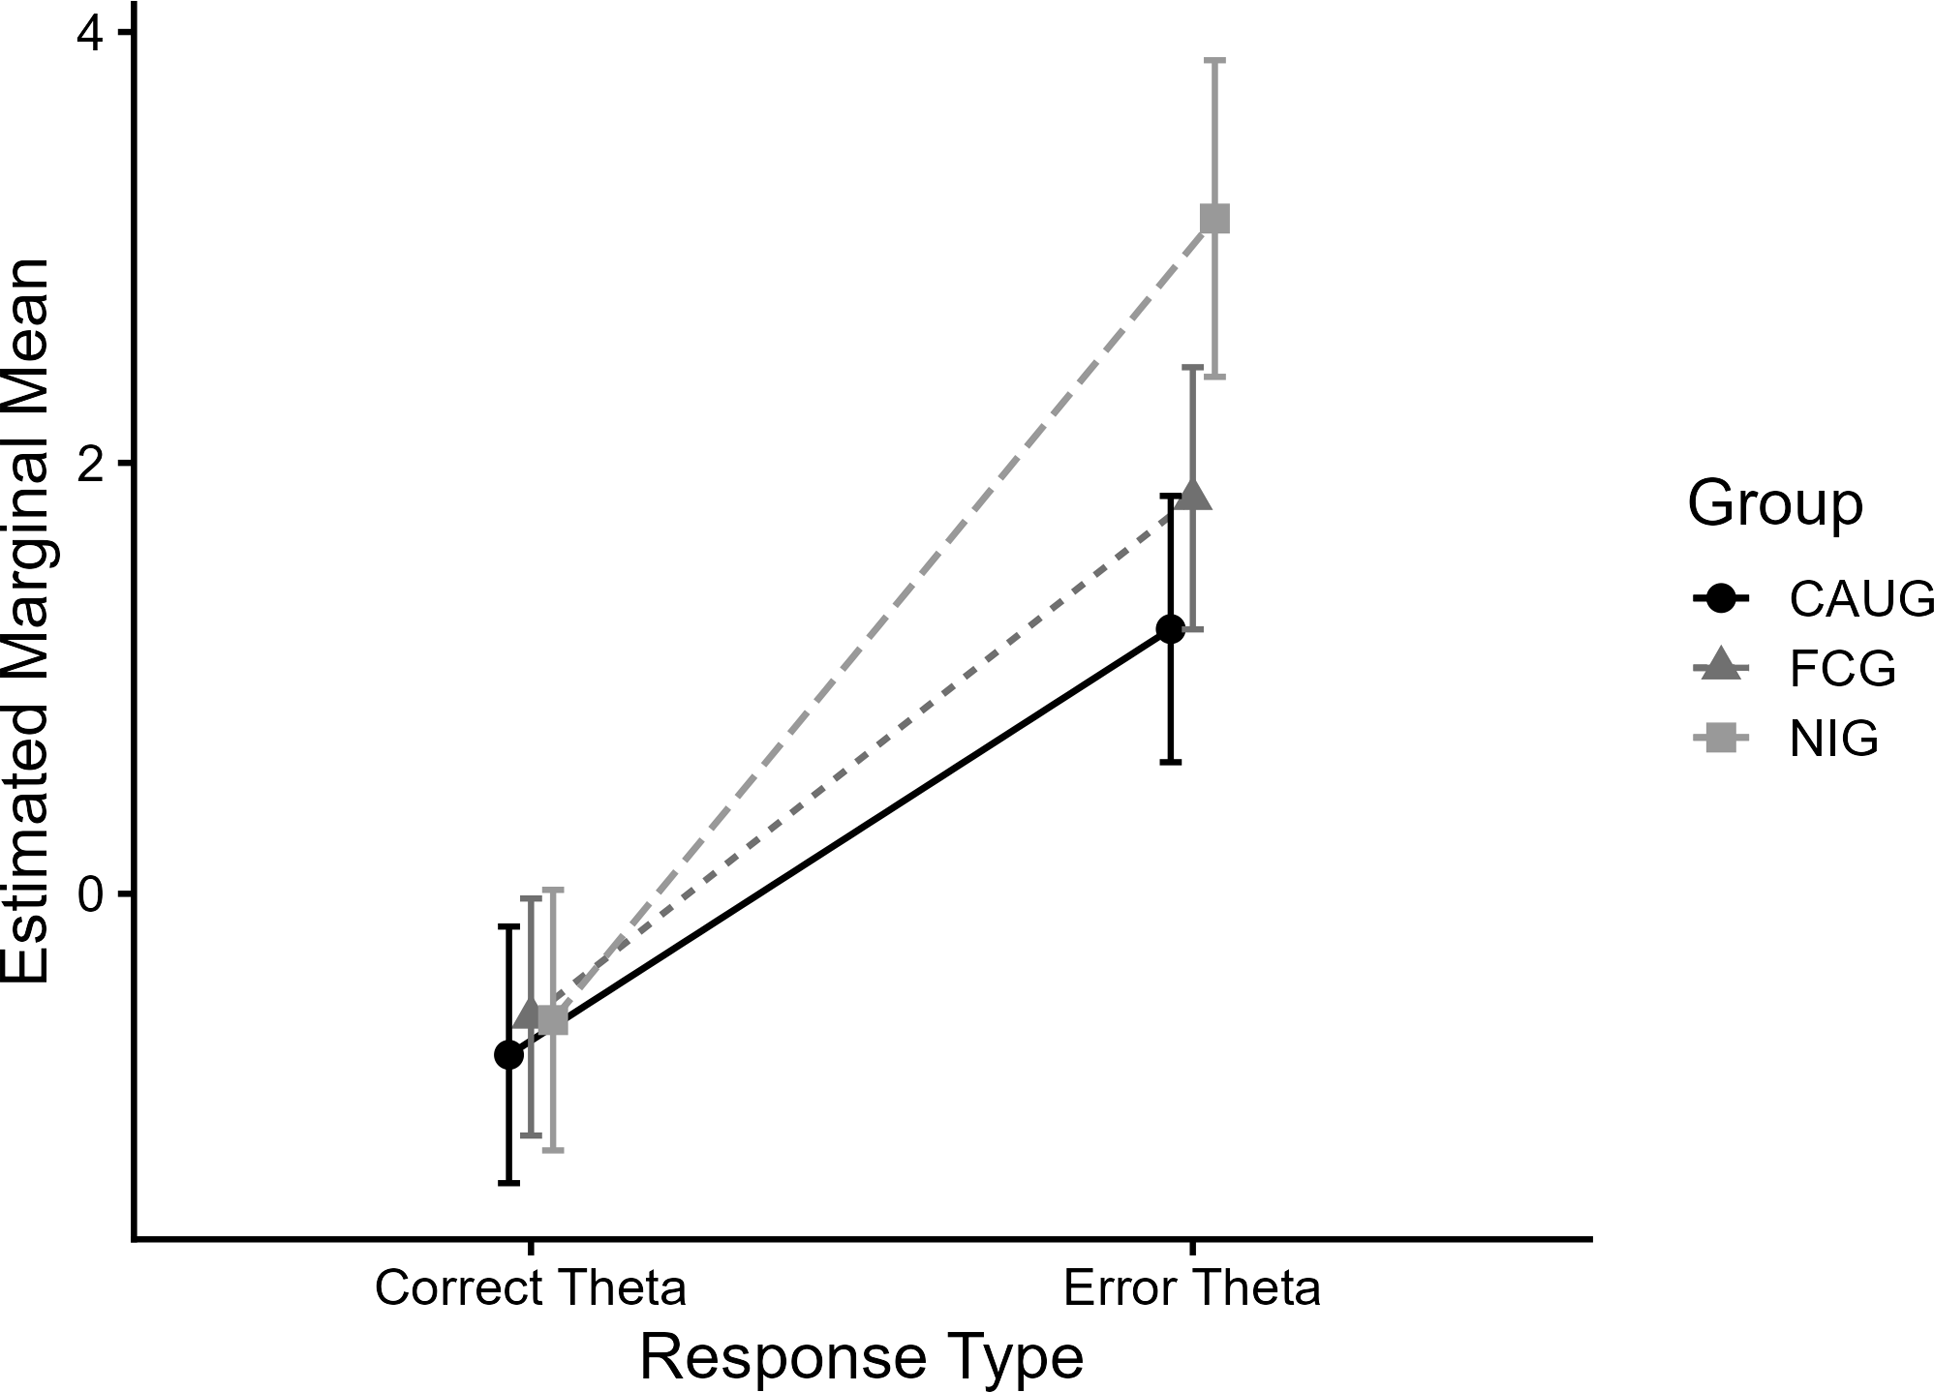
The complete group analysis including the NIG (Figure 5) also revealed a main effect of group, F(2,122.47) = 4.04, p = .020, η 2 p = 0.06, with post hoc pairwise comparisons indicating significantly greater theta power in the NIG (M = 1.27 dB, 95% CI [0.74, 1.81]) compared to the CAUG group (M = 0.24 dB, 95% CI [−0.25, 0.73]; t(126) = −2.83, p = .005, p-adj = .015, d = −0.66). Neither of the other two pairwise group comparisons was significant (CAUG vs. FCG: t(117) = −1.15, p = .254, p-adj = .487, d = −0.25; FCG vs. NIG: t(126) = −1.79, p = .076, p-adj = .176, d = −0.41). There was a significant main effect of response type, F(1,110.27) = 151.03, p < .001, η 2 p = 0.58, with greater theta power on error trials (M = 2.07 dB, 95% CI [1.69, 2.45]) compared to correct trials (M = −0.64 dB, 95% CI [−0.97, −0.30]). The group × response type interaction was also significant, F(2, 109.74) = 5.16, p = .007, η 2 p = 0.09. Post hoc analyses of the simple effects revealed there were only significant group differences on error trials, such that the NIG had significantly greater error-related theta power than both the CAUG (t(212) = −3.91, p < .001, p-adj < .001, d = −1.22) and FCG (t(213) = −2.68, p = .008, p-adj = .021, d = −0.83). The CAUG and FCG did not significantly differ in error-related theta power (t(208) = −1.38, p = .169, p-adj = .353, d = −0.39).
Theta power model-estimated means. Note. Figure shows results from the full model comparing all three groups. There was a significant main effect of response type (p < .001) and a significant group × response type interaction (p = .007), such that the never-institutionalized group (NIG) had significantly greater error-related theta power than both the care-as-usual group (CAUG; p < .001, p-adj < .001) and the foster care group (FCG; p = .008, p-adj = .021). Error bars show 95% confidence intervals.

Associations between EEG and cognitive/psychosocial functioning
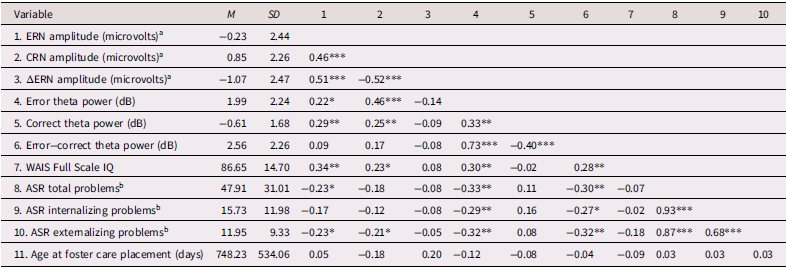
Bivariate correlations involving EEG measures are shown in Table 2. Most notably, Full Scale IQ was associated with both ERN amplitude and error-related theta. Specifically, higher IQ scores were associated with smaller (less negative) ERN amplitudes, r(88) = .34, p = .001, smaller (less negative) CRN amplitudes, r(112) = .23, p = .014, and greater error theta power, r(88) = .30, p = .004. For mental health symptoms, the opposite pattern was observed, with greater total problems associated with larger (more negative) ERN amplitudes, r(84) = −.23, p = .031, and lower error theta power, r(84) = −.33, p = .002 (the ASR-CRN association did not reach significance: r(104) = −.18, p = .059). Follow-up multiple regression models revealed that these associations did not significantly differ by group (all group × brain interaction ps > 0.05). Within the FCG, age at foster care placement was not significantly associated with any neural, cognitive, or psychosocial scores (ps > 0.05).
Means, standard deviations, and Pearson correlations of key study variables
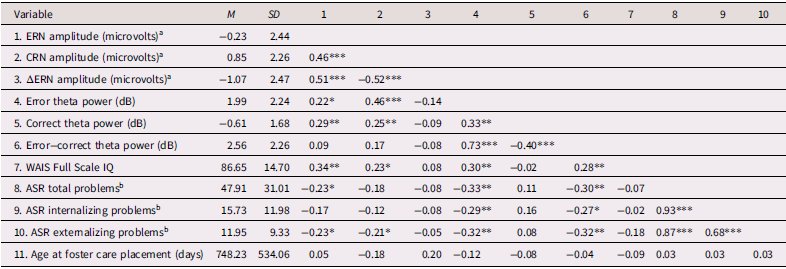
Table 2. Long description
The table presents means, standard deviations, and Pearson correlations of key study variables. It consists of 11 rows and 13 columns. The columns are labeled as follows: Variable, M, SD, 1, 2, 3, 4, 5, 6, 7, 8, 9, 10. The rows are labeled with the following variables: ERN amplitude (microvolts), CRN amplitude (microvolts), ΔERN amplitude (microvolts), Error theta power (dB), Correct theta power (dB), Error-correct theta power (dB), WAIS Full Scale IQ, ASR total problems, ASR internalizing problems, ASR externalizing problems, Age at foster care placement (days). Each row provides the mean (M) and standard deviation (SD) for each variable, followed by Pearson correlation coefficients between the variables. Notable trends include significant correlations between Full Scale IQ and both ERN amplitude and error-related theta power, as well as associations between mental health symptoms and ERN amplitude and error theta power.
Note. With the exception of age at foster care placement, all measures were assessed at the 22-year time point. Only incongruent trials were included in EEG measures. ERN = error-related negativity; CRN = correct-related negativity; WAIS = Wechsler Adult Intelligence Scale; ASR = Adult Self-Report.
aNegative ERN, CRN, and ΔERN scores indicate larger amplitudes.
bASR raw scores are presented.
*p < .05, **p < .01, ***p < .001.
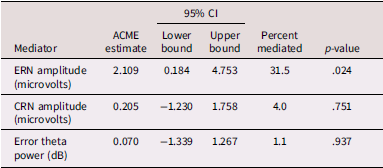
In light of past BEIP findings indicating ITT effects on IQ (King et al., Reference King, Guyon-Harris, Valadez, Radulescu, Fox, Nelson, Zeanah and Humphreys2023), and because IQ was associated with ERN and CRN amplitudes and error-trial theta power, exploratory mediation analyses were performed to test whether these neural measures mediated the link between ITT group assignment and IQ. Mediation analyses were performed using the “mediation” package for R (version 4.5.1)(Tingley et al., Reference Tingley, Yamamoto, Hirose, Keele and Imai2014) with 10,000 permutations. Because there was a significant association between IQ and the amount of artifact-free incongruent error trials (r(121) = −.19, p = .036) and incongruent correct trials that survived EEG preprocessing (r(121) = .19, p = .037), these trial counts were included as covariates in the mediation models, as relevant. These models revealed a significant indirect effect of ITT group on IQ, mediated by ERN amplitude (average mediation estimate = 2.11, 95% CI [0.18, 4.75], p = .024). This estimate indicates the average change in IQ that was explained by the foster care intervention’s impact on the ERN. After accounting for the indirect effect via the ERN, the direct effect of ITT group on IQ was not significant (direct effect = 4.58, 95% CI [−0.83, 9.90], p = .100; total effect = 6.69, 95% CI [1.09, 12.34], p = .021), suggesting the ERN may fully mediate this effect. No significant indirect effects were observed in the CRN or error-related theta models (ps > 0.75; see Table 3).
Results of exploratory mediation models

Table 3. Long description
A table with three rows and six columns. The columns are labeled Mediator, ACME estimate, 95% CI Lower bound, 95% CI Upper bound, Percent mediated, and p-value. The rows are labeled with different mediators: ERN amplitude (microvolts), CRN amplitude (microvolts), and Error theta power (dB). Row 1: ERN amplitude (microvolts), ACME estimate 2.109, 95% CI Lower bound 0.184, 95% CI Upper bound 4.753, Percent mediated 31.5, p-value 0.024. Row 2: CRN amplitude (microvolts), ACME estimate 0.205, 95% CI Lower bound -1.230, 95% CI Upper bound 1.758, Percent mediated 4.0, p-value 0.751. Row 3: Error theta power (dB), ACME estimate 0.070, 95% CI Lower bound -1.339, 95% CI Upper bound 1.267, Percent mediated 1.1, p-value 0.937.
Note. All mediation models included intent-to-treat group assignment (care-as-usual group = 0; foster care group = 1) as the predictor, the mediator listed in the table, and Full Scale IQ as the outcome. Because IQ was significantly associated with the number of artifact-free error and correct trials that survived EEG preprocessing, these trial counts were also included as covariates, as relevant. The average causal mediation estimate (ACME) is the average unstandardized change in IQ that was explained by the foster care intervention’s effect on the mediator. Because the mediator and outcome were measured at the same 22-year assessment, alternate versions of each model were also tested in which the mediator and outcome were switched. Of these alternate models, only the error-related negativity (ERN) model revealed a significant indirect effect (p = .013), such that the foster care intervention’s effect on IQ explained 36.7% of the total effect of intervention on the ERN. CRN = correct-related negativity.
Discussion
The present study tested whether effects of early-life institutional rearing and placement into foster care on error-monitoring-related brain activity persisted into early adulthood. Informed by prior work in previously institutionalized adolescents, we hypothesized that young adults randomized to foster care as infants would show better behavioral task performance, larger ∆ERN amplitude, and greater error-related mid-frontal theta power than young adults who had been randomized to receive care as usual. In terms of task behavior, the FCG performed slightly more accurately than the CAUG, although this effect became only marginally significant after adjusting for multiple comparisons. The NIG, on the other hand, had greater accuracy than the CAUG and faster RTs than both the CAUG and FCG. Importantly, however, the adaptive nature of the task (i.e., the task sped up or slowed down based on overall accuracy) limits the ability to draw conclusions based on task behavior alone.
Stronger evidence of ITT effects was observed in the ERP measures. In contrast to the current study, previous BEIP work in adolescence focused on the ∆ERN, the amplitude difference between the ERN and its correct-trial counterpart, the CRN (Debnath et al., Reference Debnath, Troller-Renfree, Zeanah, Nelson and Fox2023; Troller-Renfree et al., Reference Troller-Renfree, Nelson, Zeanah and Fox2016). Instead of relying on a traditional subtraction-based ∆ERN difference score, the current study used a statistical modeling approach that flexibly allowed us to simultaneously assess group effects on overall ERPs as well as group-by-response type interactions. That we did not observe a group-by-response type interaction indicates groups did not significantly differ in terms of ∆ERN amplitude, with groups instead differing in their overall ERP amplitude. The ITT model revealed a main effect of group such that, across the ERN and CRN, the CAUG had larger (more negative) amplitudes than the FCG. Across groups, larger ERP amplitudes (but not ∆ERN amplitude) were associated with lower overall cognitive functioning and greater total mental health problems, suggesting the CAUG is displaying a neural profile associated with elevated cognitive and psychosocial risk. With regard to externalizing symptoms, specifically, a previous meta-analysis found that elevated externalizing problems were associated with smaller ERN amplitudes (Lutz et al., Reference Lutz, Kok, Verveer, Malbec, Koot, van Lier and Franken2021); however, in the present study externalizing problems were instead associated with larger ERN amplitudes (and larger CRN amplitudes). One possible explanation for this discrepancy is that early psychosocial deprivation associated with institutional rearing may heighten adults’ response monitoring generally rather than error detection specifically. This indiscriminately intensified response monitoring strategy is likely inefficient and could be driven by affective processes, which would explain its associations with elevated psychiatric symptoms and lower cognitive functioning, as discussed further below.
Given previous BEIP work revealing relatively sustained ITT effects of foster care intervention on cognitive functioning (King et al., Reference King, Guyon-Harris, Valadez, Radulescu, Fox, Nelson, Zeanah and Humphreys2023), exploratory mediation analyses further tested whether EEG measures significantly mediated the intervention’s effect on IQ. These analyses revealed a significant indirect effect through the ERN, such that the foster care intervention’s effect on the ERN accounted for a roughly 2-point IQ increase and fully mediated the intervention’s effect on IQ. Taken together with prior BEIP findings, these results suggest that sustained intervention effects on neural performance monitoring may help shape overall cognitive functioning in this high-risk cohort.
At the 16-year BEIP follow-up, group differences in theta power were observed, such that CAUG had significantly lower theta power (measured as the difference between error-related and correct-related theta power) than each of the other two groups, which did not differ from each other (Debnath et al., Reference Debnath, Troller-Renfree, Zeanah, Nelson and Fox2023). At the current 22-year assessment, we observed a comparable group-by-response type interaction on theta power. However, probing this interaction revealed that both the CAUG and FCG had lower error-related theta power compared to the NIG, with no theta differences between the CAUG and FCG. In other words, there was only an effect of exposure to institutionalization on theta power, with no ITT effect. It should be noted that, whereas the ERN reflects mid-frontal theta activity that is phase-locked across trials, the theta power measure employed here represents the total of both phase-locked and non-phase-locked theta activity (Beatty et al., Reference Beatty, Buzzell, Roberts and McDonald2020; Cavanagh & Frank, Reference Cavanagh and Frank2014; Shner-Livne et al., Reference Shner-Livne, Buzzell, Fox and Shechner2024). Thus, the theta power measure captures unique information absent from the ERN measure, which could account for the distinct pattern of group differences across the two measures. Indeed, these two measures related to cognitive and psychosocial functioning in opposite directions: larger (more negative) ERNs were associated with lower IQ and greater total mental health symptoms, whereas greater error-related theta power was associated with higher IQ and lower total mental health symptoms. This divergence is consistent with some recent work finding that theta power may reflect more adaptive cognitive processes than does the ERN, as only theta power is associated with greater accuracy on error-following trials (Beatty et al., Reference Beatty, Buzzell, Roberts and McDonald2020; Shner-Livne et al., Reference Shner-Livne, Buzzell, Fox and Shechner2024; Valadez & Simons, Reference Valadez and Simons2018). The ERN and error-related theta are likely two parts of the same complex of brain signals that help the individual to not only answer the question “What just happened?” but also “What can I do about it?” in response to the same events (Valadez & Simons, Reference Valadez and Simons2018). The present pattern of findings may indicate that early psychosocial deprivation heightens the affective and reactive component of performance monitoring (“What just happened?”, as indicated by larger ERN and CRN amplitudes) while dampening the more adaptive and proactive component (“What can I do about it?”, as indicated by lower error-related theta power), with enduring protective effects of foster care on the former but not the latter.
The current study has several notable strengths, including the use of random assignment and the long-term longitudinal design, and limitations highlight important future directions. Although retention of CAUG and FCG participants at the 22-year assessment was high (77.9% and 79.4%, respectively), the presence of any attrition introduces the possibility of selection bias. To help mitigate this possibility, we used an analytic approach that used all the available data, allowing us to retain in analyses nearly all participants who had any flanker EEG data. Additionally, because the purpose of the present study was to test whether effects of early institutional care and subsequent foster care persisted to adulthood, we focused on data from the 22-year assessment; however, because previous flanker task reports from BEIP varied in preprocessing pipelines, EEG scoring approaches, and statistical approaches, it remains unclear whether disparate findings across BEIP waves may be due to these factors versus due to developmental change. Therefore, longitudinal analyses using harmonized preprocessing and scoring approaches across ages are needed to clarify whether groups differ in their error monitoring trajectories across time.
In sum, neural measures of performance monitoring revealed sustained group differences that endured into young adulthood. ERPs showed sustained ITT effects, which may explain foster-care-related gains in cognitive functioning, whereas error-related theta power reflected persistent effects of early institutionalization rather than foster care intervention. Together, these dissociations underscore that distinct neural indices of performance monitoring may reflect different pathways of risk and adaptation following early adversity – and that the consequences of institutional rearing are not fully remediated by high-quality early intervention. Future longitudinal analyses using harmonized data preprocessing pipelines will be critical for clarifying how these neural systems may diverge or converge across development.
Supplementary material
The supplementary material for this article can be found at https://doi.org/10.1017/S0954579426101928.
Data availability statement
Raw data presented in this paper are available through contact of the BEIP at fox@umd.edu.
Acknowledgements
We are grateful to all the children and caregivers who participated in the BEIP and to our dedicated lab staff in Romania.
Funding statement
This study was funded by the John D. and Catherine T. MacArthur Foundation, the Binder Family Foundation, the Jacobs Foundation, and the National Institute of Mental Health of the National Institutes of Health under Awards R01MH091363 (to Charles A. Nelson) and K23MH130751 (to Emilio A. Valadez).
Competing interests
The authors declare none.
Pre-registration statement
This study was not pre-registered.





 Open access

