





1. Introduction
Atmospheric aerosols are a complex combination of solid and liquid particles suspended in the air, ranging from 0.001–100 µm in size, and characterized by highly variable chemical composition, concentration, physicochemical properties and morphologies (Colbeck and Lazaridis, Reference Colbeck and Lazaridis2010; Seinfeld and Pandis, Reference Seinfeld and Pandis2012; Hinds and Zhu, Reference Hinds and Zhu2022). Aerosols can originate from a wide range of sources, including natural contributors such as sea spray and mineral dust from crustal erosion, as well as from anthropogenic sources including industrial and transportation emissions. Snowfall is an effective wet deposition process that scavenges airborne particles and incorporates them into the snowpack. These particles are preserved either as insoluble impurities, directly observable under an optical microscope and occasionally even visible to the naked eye, or as soluble impurities, detectable only through chemical analysis. This process is particularly significant in high-elevation or high-latitude regions, where snowfall predominates over rainfall and dry deposition (Pan and Wang, Reference Pan and Wang2015; Mamun and others, Reference Mamun, Cheng, Zhang, Dabek-Zlotorzynska and Charland2019, Reference Mamun, Cheng, Zhang, Celo, Dabek‐Zlotorzynska and Charland2022). Therefore, the snowpack is a reliable medium to indirectly assess the type of aerosols present in the atmosphere and their variation patterns in a given region during the snow accumulation period (Song and others, 2024). This characterization is achieved through the chemical analysis of the snowpack, which is influenced by atmospheric circulation patterns at synoptic, regional and local scales, by the distance to the emission source and by post-depositional processes within the snowpack (Dadashazar and others, Reference Dadashazar, Ma and Sorooshian2019; Zhang and others, Reference Zhang2022).
Although high-mountain regions experience isolation and limited accessibility, many of them are located not far from major urban or industrial centres, which constitute significant sources of anthropogenic emissions (Ming and others, Reference Ming, Cunde, Zhen-Cai and Flanner2009). In other cases, these regions are located near vast arid or semi-arid areas, which are primary sources of mineral dust (Pey and others, Reference Pey, Querol, Alastuey, Forastiere and Stafoggia2013). Consequently, through atmospheric scavenging, snowpacks in these regions can reflect both the chemical composition and temporal variability of inputs from both sources (Mayewski and others, Reference Mayewski, Lyons and Ahmad1983).
High Mountain Asia (HMA), located in the central part of the Asian continent, is often referred to as the ‘Third Pole’, because it holds the largest volume of snow and ice outside the polar regions (IPCC, Reference Stocker, Qin, Plattner, Tignor, Allen, Boschung, Nauels, Xia, Bex and Midgley2013). In recent decades, numerous field studies have been conducted across different parts of HMA to characterize the chemical composition of the snowpack, including research in the Himalaya (Mayewski and others, Reference Mayewski, Lyons and Ahmad1983; Marinoni, Reference Marinoni2001; Kang and others, Reference Kang, Mayewski, Qin, Sneed, Ren and Zhang2004; Liu and others, Reference Liu, Geng and Hou2010; Panicker and others, Reference Panicker2019; Clifford and others, Reference Clifford2021), the Tibetan Plateau (Wake and others, Reference Wake, Mayewski, Zichu, Ping and Li1993; Shichang and others, Reference Shichang, Jie and Yanwei2008; Zhang and others, Reference Zhang, Kang, Zhang, Cong, Zhang and Gao2010, Reference Zhang2017), the Altai Range (Wang and others, Reference Wang, Wang, Kang and Kou2011), the Pamir Mountains (Wu and others, Reference Wu, Yao, Xu, Tian, Li and Duan2008), the Karakoram Range (Thakur and others, Reference Thakur2021) and the HMA south-eastern sector (Zongxing and others, Reference Zongxing2009; Niu and others, Reference Niu2014).
Characterizing the chemical composition of impurities in HMA snow is essential, as this extremely sensitive ecosystem is home to the headwaters of several major Asian rivers, including the Indus, Ganges, Brahmaputra, Yangtze and Yellow Rivers, which together provide water resources for approximately 20% of the global population (CIESIN and CIAT, 2005; Immerzeel and others, Reference Immerzeel, Van Beek and Bierkens2010; IPCC, Reference Stocker, Qin, Plattner, Tignor, Allen, Boschung, Nauels, Xia, Bex and Midgley2013, Reference Immerzeel2020). Meltwater chemistry largely reflects the chemical composition of the snowpack, and solute release during snowmelt can modulate downstream drinking-water quality through the transfer of pollutants retained in the snow. Degraded water quality is widely recognized as being linked to increased health risks (Lin and others, Reference Lin, Yang and Xu2022). Meltwater can also act as a vector for the transport of soluble substances that may affect the quality and ecological dynamics of soils and aquatic systems (Meyer and others, Reference Meyer, Lei, Muradi and Wania2009a, Reference Meyer, Lei, Muradi and Wania2009b; Codling and others, Reference Codling2014). Another important process is the hydrological contribution of seasonal snow and ice meltwater to many major South Asian rivers, which helps buffer precipitation deficits during summer, dry seasons and droughts (Pritchard, Reference Pritchard2019).
HMA is surrounded by important urban and industrial centres, receiving substantial inputs of anthropogenic aerosols, which can subsequently be deposited and preserved in the snowpack (Prasad and others, Reference Prasad, Singh and Kafatos2006; Nair and others, Reference Nair2007). On the other hand, mineral dust is also a common aerosol in the region, since the surrounding territory consists mainly of arid or semi-arid zones, including the Taklamakan Desert (Chen and others, Reference Chen2017; Kang and others, Reference Kang2020; Xing and others, Reference Xing2024).
In this study, we analyse the soluble inorganic chemistry of the seasonal snowpack accumulated on the Godwin-Austen Glacier (Karakoram Range) during the winter of 2018–19, with a focus on variations in the concentrations of major ions. Our main objective is to make these data available to the scientific community, given the limited number of studies of this nature in the western region of HMA. In addition, we explore the potential sources of these ions by examining the most significant concentrations and their correlations. To complement the ion-based interpretations, selected trace element measurements are included to provide additional insight into source attribution. This study aims to support a better understanding of snowpack composition and ion deposition dynamics in high-mountain environments.
2. Geographical framework
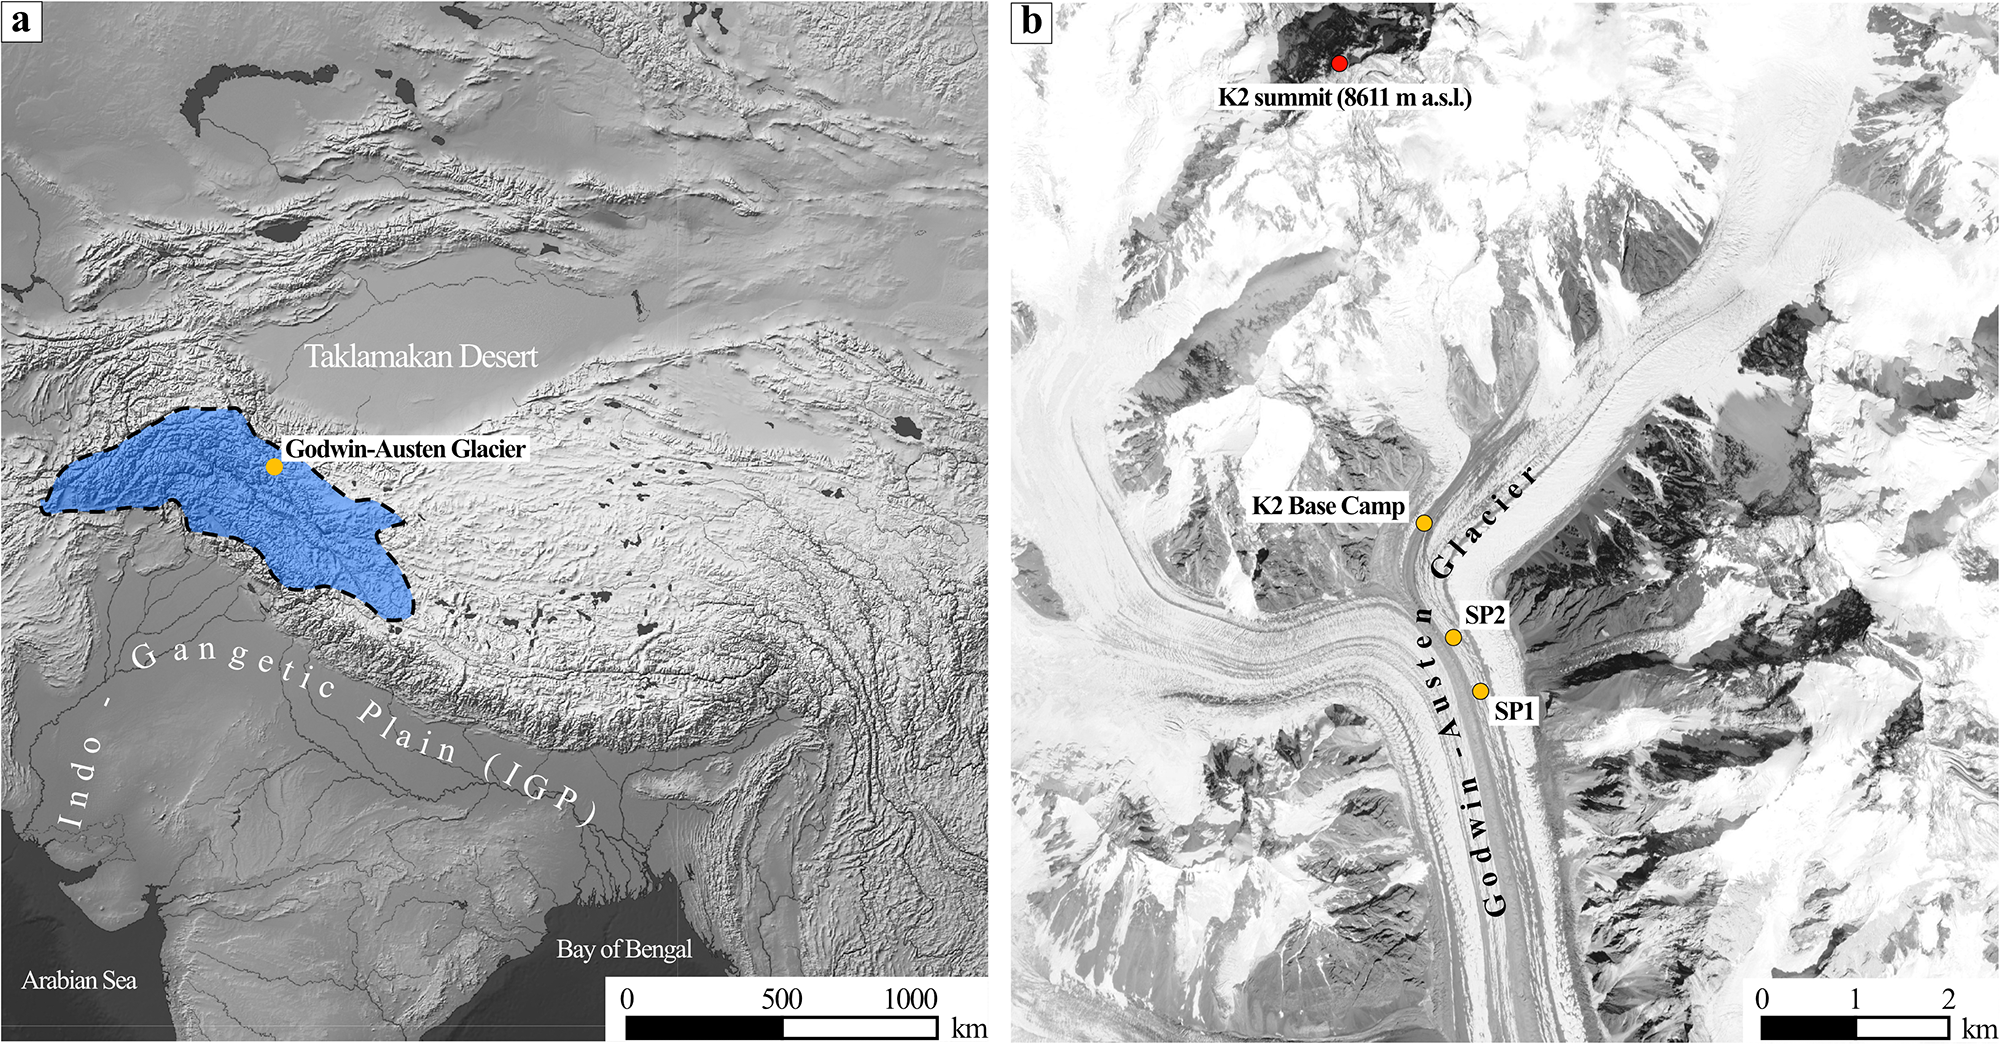
The Godwin-Austen Glacier, located in the central region of the Karakoram Range (Fig. 1a), constitutes the northern branch of the Baltoro Glacier and lies within the Shigar River basin (35.2°N–37°N, 74.5°E–76.5°E). This basin covers 6921 km2, 40% of which is glacierized, and has an altitudinal range from 2000–8611 m a.s.l. Precipitation in the region peaks in winter due to the influence of the westerlies, while it remains low during summer (Mukhopadhyay and others, Reference Mukhopadhyay, Khan and Gautam2015). Precipitation varies markedly with altitude: in the area surrounding K2 (the highest mountain in the Karakoram, flanked by the Godwin-Austen Glacier), the mean annual precipitation ranges from 100–150 mm∙a−1 at 2000–3200 m a.s.l., increases to about 1600 mm∙a−1 at 6100 m a.s.l. and reaches up to 2500 mm∙a−1 near 8000 m a.s.l. (Decheng, Reference Decheng1978). The Shigar River is a major tributary of the Indus River, and its flow is supplied by meltwater from snowpacks and glacier ice, mainly from the Baltoro, Panmah, Biafo and Chogolungma glaciers (Khan and others, Reference Khan, Richards, Parker, McRobie and Mukhopadhyay2014; Hassan and others, Reference Hassan, Chen, Muhammad and Bazai2021). The Shigar basin is part of the Upper Indus Basin (UIB; Fig. 1a), where snow can cover up to 85% of the surface during winter (Shrestha and others, Reference Shrestha2015). The high snow accumulation in UIB implies that the Indus River derives 82% of its annual discharge from melt of seasonal and perennial snowpacks, whereas only 18% comes from glacier ice melt (Yang and others, Reference Yang2013). Therefore, seasonal snowmelt in this region is a key factor in regulating the Indus River flow.
(a) Geographic setting of the study area. The blue area with a dashed outline indicates the Upper Indus Basin (UIB); the yellow dot marks the Godwin-Austen Glacier. (b) Location of snow pit 1 (SP1), snow pit 2 (SP2) and K2 Base Camp.

1 Long description
A) Map highlighting the Upper Indus Basin in blue, located near the Godwin-Austen Glacier. The map includes the Taklamakan Desert, Gangetic Plain and Bay of Bengal. A scale bar indicates distances of 500 and 1000 km. B) Detailed map of the Godwin-Austen Glacier area, showing the K2 summit at 8611 m above sea level, K2 Base Camp and locations of snowpits SP1 and SP2. A scale bar indicates distances of 1 and 2 km.
3. Methods
In February 2019, two snow pits were excavated through the snowpack down to the underlying ice of the Godwin-Austen Glacier (Fig. 1b). In the study area, the snowpack follows a seasonal cycle: it begins to form in autumn with the first snowfalls of the accumulation season, builds up during the coldest months and disappears completely through the ablation season, spanning spring and summer (Ahmad and others, Reference Ahmad2020; Lund and others, Reference Lund2020; Yi and others, Reference Yi, Liu, Zhu, Wu, Xie and Saifullah2021; González-Santacruz and others, Reference González-Santacruz2025). The first snow pit (SP1) reached a depth of 200 cm (35°49.184′N, 76°30.920′E; 4927 m a.s.l.), while the second (SP2), excavated 500 m further north, reached 120 cm (35°49.486′N, 76°30.779′E; 4937 m a.s.l.). During the field campaign, an automatic weather station (AWS) was installed in the study area to record local meteorological conditions, including air temperature, atmospheric pressure, relative humidity, wind direction and speed. Selected AWS observations were later used as contextual support for the interpretation of some snow pit records. Field meteorological and site conditions recorded during the excavation of SP1 and SP2 are summarized in Table SM1. A previous study revealed that SP1 preserves a more complete environmental record of the 2018–19 accumulation season, whereas SP2, located in a more exposed area, was more strongly affected by post-depositional processes, likely related to enhanced wind redistribution, sublimation and surface energy inputs, which may have altered or removed sections of the stratigraphic record (González-Santacruz and others, Reference González-Santacruz2025). For this reason, the chemical characterization is based on the SP1 record, while SP2 will be used to analyse the changes in the original ion concentrations.
Snow samples were collected from the snow pits every 6–8 cm, with volumes of 1300–1800 cm3, using clean plastic tools, and stored in Whirl-Pak™ bags (Fig. SM1). All sampling was conducted wearing clean protective clothing to minimize contamination, and sampling equipment was kept sealed in clean bags until use. The material used for sampling one snow pit was not reused for the other. Samples were melted at room temperature (∼10°C), homogenized, and transferred into 100 mL polypropylene bottles, which were kept at 1°C–5°C during shipping for laboratory analysis. A total of 44 samples were analysed for soluble inorganic species, including 25 from SP1 and 19 from SP2.
Anions (Cl−, NO3−, NO2− and SO42−) and cations (Ca2+, Mg2+, K+, Na+ and NH4+) were determined by ion chromatography (IC) at the facilities of the Pyrenean Institute of Ecology (IPE-CSIC). The IC was conducted using a Metrohm 930 IC Flex coupled to a 919 IC Autosampler Plus. Anions were analysed with a Metrosep A Supp 5 (250/4.0 mm) column using 1.0 mM NaHCO3 + 3.2 mM Na2CO3 as eluent. Cations were analysed with a Metrosep C 6 (250/4.0 mm) column using 1.0 mM oxalic acid + 3.0 mM HNO3 as eluent. Samples were stored at 4°C and analysed in a laboratory maintained at 20°C–23°C. Given the expected low concentrations, VHG multi-point calibrations were used: 7 points (10 µg⋅L−1–10 mg⋅L−1) for minor analytes (F−, Br−, NO2− and NH4+) and 9 points (30 µg⋅L−1–100 mg⋅L−1) for major analytes.
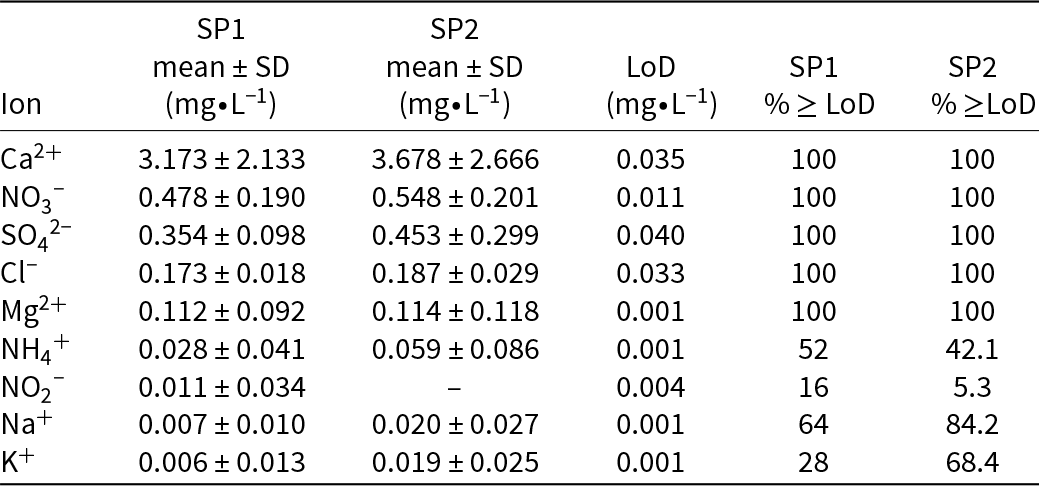
Fluoride, bromide and phosphate concentrations were always below the limit of detection (LoD; 0.001, 0.004 and 0.013 mg L−1, respectively; see Table 1 for ion-specific LoD values). For nitrite (NO2−), approximately 10% of the samples (5 out of 44) had values at or above the LoD, whereas potassium and ammonium exceeded the LoD in nearly half of the total samples. Chloride, sulphate, calcium and magnesium concentrations were always above the LoD. Because nitrite is both produced and consumed within the snowpack and is highly reactive during sampling and storage, its values are reported for completeness only. We place limited quantitative weight on them and do not use them as primary constraints in our interpretations. Soluble trace elements were quantified by acidifying aliquots with ultrapure nitric acid (HNO₃; Suprapur® grade, Merck) to a final concentration of 5% and analysing them by inductively coupled plasma mass spectrometry at the Centre for Research in Sustainable Chemistry.
Mean concentration and standard deviation of major ions measured in snow pits SP1 and SP2 (mg∙L−1), together with the ion-specific limits of detection (LoD) and the percentage of samples at or above the LoD for each snow pit.

Table 1 Long description
Major ion concentrations in snowpits SP1 and SP2 are summarized as mean with standard deviation in milligrams per liter, alongside each ion’s limit of detection and the percent of samples meeting or exceeding that limit. Calcium is highest in both pits (SP1 3.173 plus or minus 2.133; SP2 3.678 plus or minus 2.666), followed by nitrate (SP1 0.478 plus or minus 0.190; SP2 0.548 plus or minus 0.201). Sulfate and chloride are lower but consistently detected in all samples for both pits (sulfate SP1 0.354 plus or minus 0.098; SP2 0.453 plus or minus 0.299; chloride SP1 0.173 plus or minus 0.018; SP2 0.187 plus or minus 0.029). Magnesium is also detected in all samples and remains low (about 0.11 in both pits). Ammonium shows partial detection (52 percent in SP1 and 42.1 percent in SP2) and higher variability relative to its mean. Nitrite is rarely detected (16 percent in SP1 and 5.3 percent in SP2), and SP2 has no reported mean value for nitrite. Sodium and potassium are low and more often detected in SP2 than SP1 (sodium 84.2 percent versus 64 percent; potassium 68.4 percent versus 28 percent). Limits of detection range from 0.001 to 0.040 milligrams per liter, so means near these limits should be interpreted cautiously, especially where detection percentages are low.
To investigate the potential source regions of the ionic content preserved in the snowpack, from a regional to large-scale atmospheric circulation perspective, we used the Hybrid Single-Particle Lagrangian Integrated Trajectory model (Stein and others, Reference Stein, Draxler, Rolph, Stunder, Cohen and Ngan2015; Rolph and others, Reference Rolph, Stein and Stunder2017). The model was applied to compute a total of 180 daily 10-day back trajectories arriving at the Godwin-Austen Glacier, using meteorological fields from the Global Data Assimilation System provided by NOAA and NCEP, with a spatial resolution of 0.5° × 0.5°. Back trajectories were calculated for the period spanning the accumulation season, from October 2018 until snow pit excavation (24–27 February 2019), while also including late September to account for air-mass transport preceding the onset of seasonal snow accumulation. Trajectories were computed at three arrival heights (500, 1000 and 1500 m a.g.l.) to capture vertical variability in air-mass transport. To facilitate interpretation, trajectories were grouped on a monthly basis using Total Spatial Variance and K-means cluster analysis (Hartigan and Wong, Reference Hartigan and Wong1979; NOAA, 2023a, 2023b), allowing the identification of dominant air-mass pathways potentially responsible for transporting ionic species subsequently preserved in the snowpack.
4. Results
Mean concentrations of the major ions in each snow pit (SP1 and SP2) are summarized in Table 1. Concentrations of all ions are higher in SP2. In both snow pits, Ca2+, NO3− and SO42− dominate the ionic content, followed by Cl−, Mg2+ and NH4+, whereas Na+ and K+ show the lowest concentrations. Calcium (Ca2+) clearly dominates the ionic content, with concentrations approximately one order of magnitude higher than those of the other ions. A sample-by-sample analysis indicates that Ca2+ accounts for 54–86% of the total ionic content in SP1 and 51–87% in SP2, followed by NO3− and SO42−, which together represent most of the remaining fraction; all other ions individually contribute less than 10% on average. Nitrite (NO₂−) was detected only once in SP2 (0.112 mg∙L−1) and is therefore treated as an episodic signal and excluded from mean-based summaries. However, NO2− preservation in snow and ice is inherently challenging because it is both produced and consumed within the snowpack through rapid photochemical cycling and air–snow exchange, while post-depositional processes such as photolytic loss, re-oxidation and redistribution may further alter its preservation and concentrations within the snowpack.
4.1. Correlation and principal component analysis
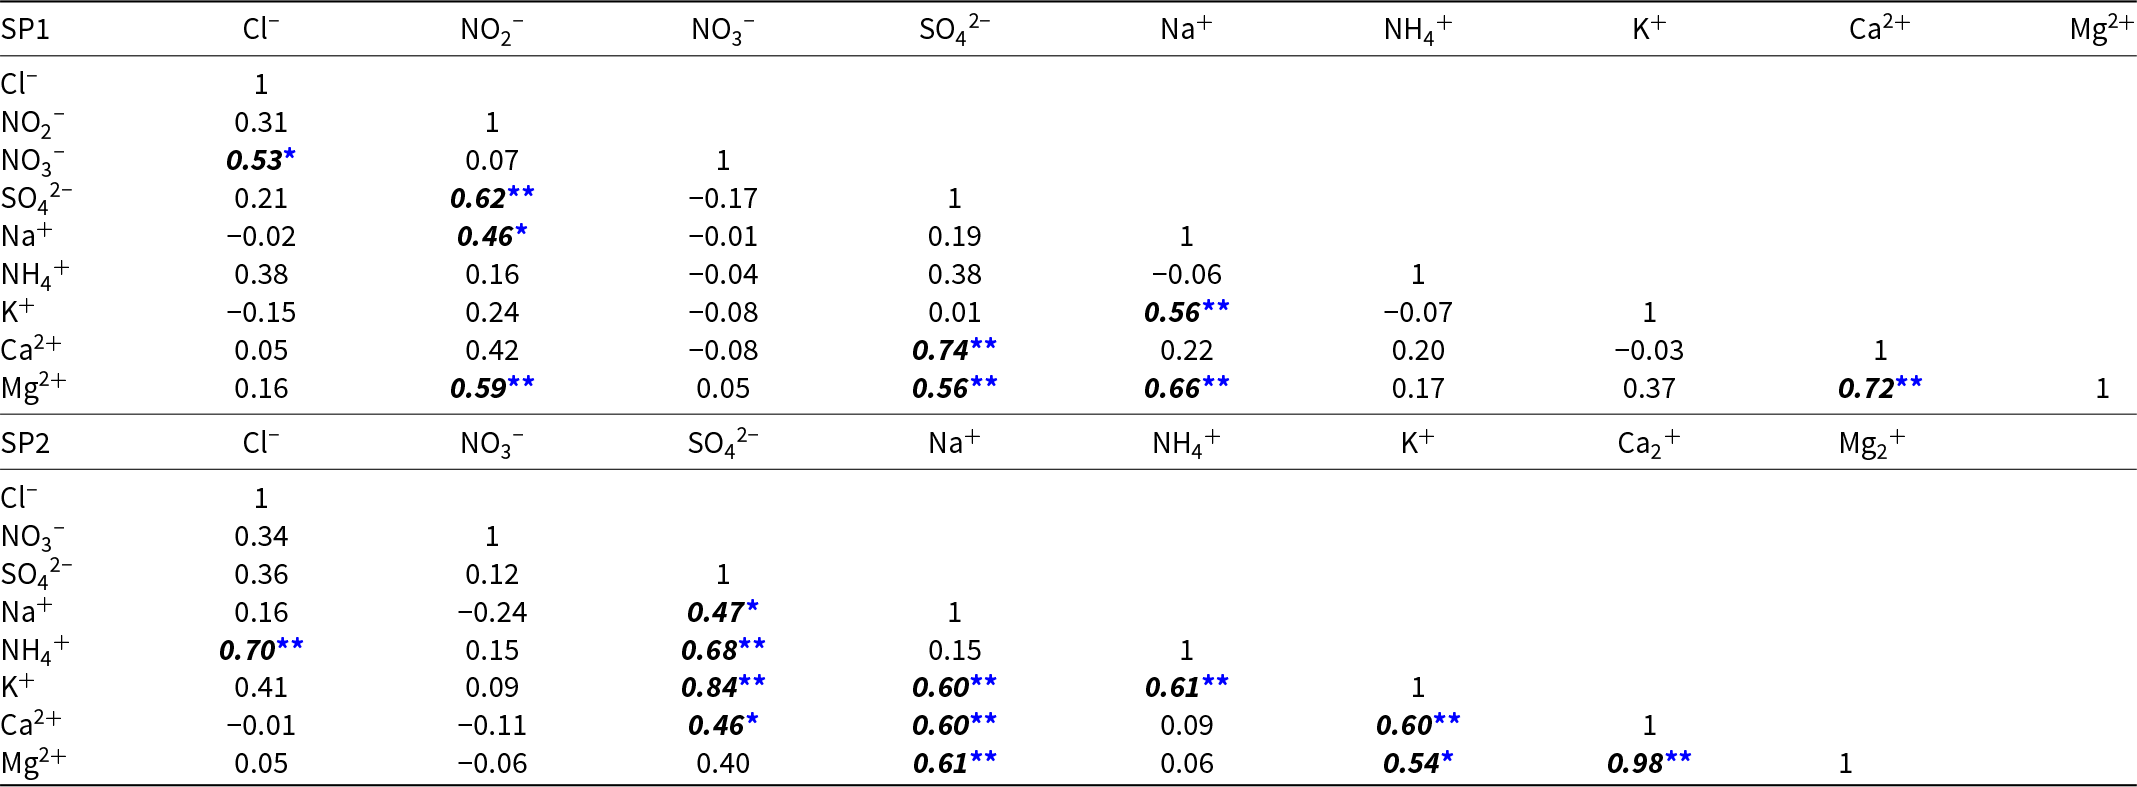
To examine covariation among major ions, Pearson correlation coefficients were computed for the complete depth profiles of SP1 and SP2, retaining values below the LoD as zeros. Their significance levels (p-values) are reported in Table 2. Because this treatment may influence correlations involving ions with low detection frequency, especially NO2−, K+ and NH4+, these correlations are interpreted as exploratory indicators of co-variability along the snow pit profiles. Overall, the correlation structure differs between snow pits, with some significant correlations present only in SP1 and others emerging only in SP2, while others strengthen or weaken from SP1 to SP2.
Pearson correlation matrix of ion concentrations in SP1 (top) and SP2 (bottom). Bold and italic values indicate statistically significant correlations (see p-values below).

Table 2 Long description
Pearson correlation matrices summarize how ion concentrations vary together within two samples, SP1 and SP2, with marked values indicating statistically reliable relationships. In SP2, the strongest positive association is between calcium and magnesium (0.98), followed by sulfate with potassium (0.84). SP2 also shows several other strong positive links: sodium with magnesium (0.61), sodium with potassium (0.60), sodium with calcium (0.60), and ammonium with chloride (0.70) and with sulfate (0.68). In SP1, sulfate correlates strongly with calcium (0.74) and moderately with magnesium (0.56), while calcium and magnesium are also strongly related (0.72). SP1 highlights additional notable relationships involving nitrite: nitrite with sulfate (0.62) and nitrite with magnesium (0.59), plus sodium with magnesium (0.66) and sodium with potassium (0.56). Negative correlations are generally small in both samples, with the clearest in SP2 being sodium with nitrate (−0.24). Correlations describe co-variation and do not establish causation, and unmarked values may reflect weaker or less certain relationships.
* p < 0.05,
** p < 0.01.
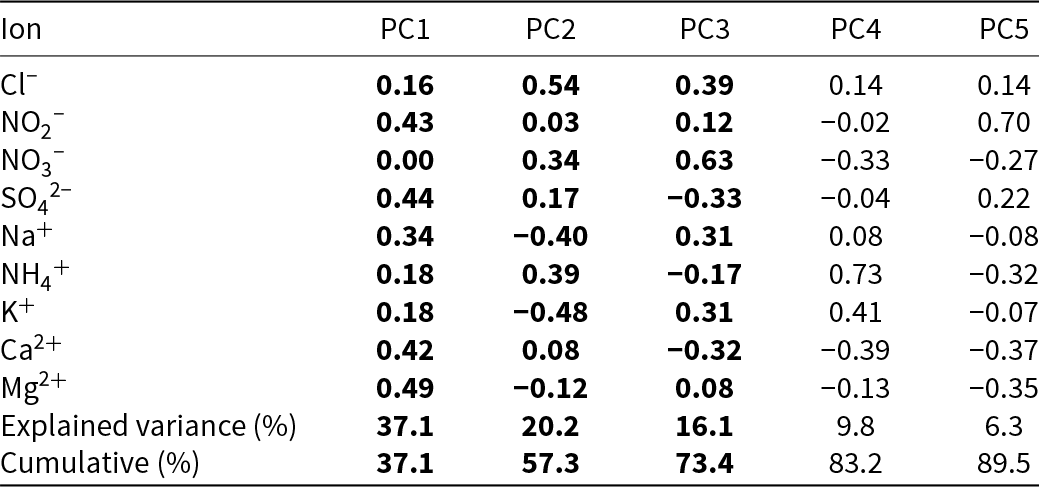
Ion concentrations were also examined with a principal component analysis (PCA). The PCA was applied only to SP1 using its complete concentration dataset (n = 25 depth samples), with values below the LoD retained as zeros, consistent with the original dataset structure. Prior to PCA, the samples were standardized to zero mean and unit variance. The objective of the analysis was to identify the dominant covariance among the measured ions, and it was restricted to SP1 because post-depositional processes affecting SP2 could hinder the interpretation. As shown in Table 3, the first three principal components explain 73.4% of the variance, while including five components increases the cumulative explained variance to 89.5%. Interpretation is therefore restricted to PC1–PC3, whereas PC4 and PC5, each explaining less than 10% of the variance, are retained for completeness but not considered for source attribution.
Loadings of the first five principal components (PCs) for SP1 (dimensionless), together with the individual and cumulative explained variances. PC1–PC3 capture the main variance structure, whereas PC4 and PC5 are not considered for source attribution.

Table 3 Long description
Principal component loadings are listed for nine ions across five components, along with each component’s explained variance and the cumulative total. PC1 explains 37.1 percent of variance and has its largest positive loadings for magnesium (0.49), sulfate (0.44), nitrite (0.43), and calcium (0.42), while nitrate is near zero (0.00). PC2 explains 20.2 percent and is dominated by chloride (0.54), ammonium (0.39), and nitrate (0.34), with negative contributions from potassium (minus 0.48) and sodium (minus 0.40). PC3 explains 16.1 percent and is strongest for nitrate (0.63) and chloride (0.39), while sulfate (minus 0.33) and calcium (minus 0.32) are negative. PC4 explains 9.8 percent and is mainly ammonium (0.73) and potassium (0.41), with calcium (minus 0.39) and nitrate (minus 0.33) negative. PC5 explains 6.3 percent and is driven by nitrite (0.70), while ammonium (minus 0.32), magnesium (minus 0.35), and calcium (minus 0.37) are negative. Cumulative explained variance increases from 37.1 percent after PC1 to 57.3 percent after PC2, 73.4 percent after PC3, and 89.5 percent after PC5; later components contribute less and should be interpreted cautiously.
4.2. Concentration profile analysis
Major ions show concentration peaks at specific depth intervals, but their statistical significance must be assessed. To this end, we used  $z$-scores (Davis, Reference Davis2002), which indicate how many standard deviations (
 $\sigma $) a value diverges from the mean (
 $\mu $). The z-score is calculated according to the following formula:
 \begin{equation*}z = \frac{{x - \mu }}{\sigma },\end{equation*}
where  $x$ represents the concentration of an ion in a given sample,
 $\mu $ is the mean concentration of that same ion throughout the snow pit and
 $\sigma $ is the standard deviation. In this study,
 $z$-scores equal to or greater than one are considered statistically relevant, as deviations from the mean beyond this threshold are sufficiently pronounced to be distinguished from the general behaviour of the dataset. Similarly, increasing z-scores reflect increasingly significant concentrations (Fig. 2).
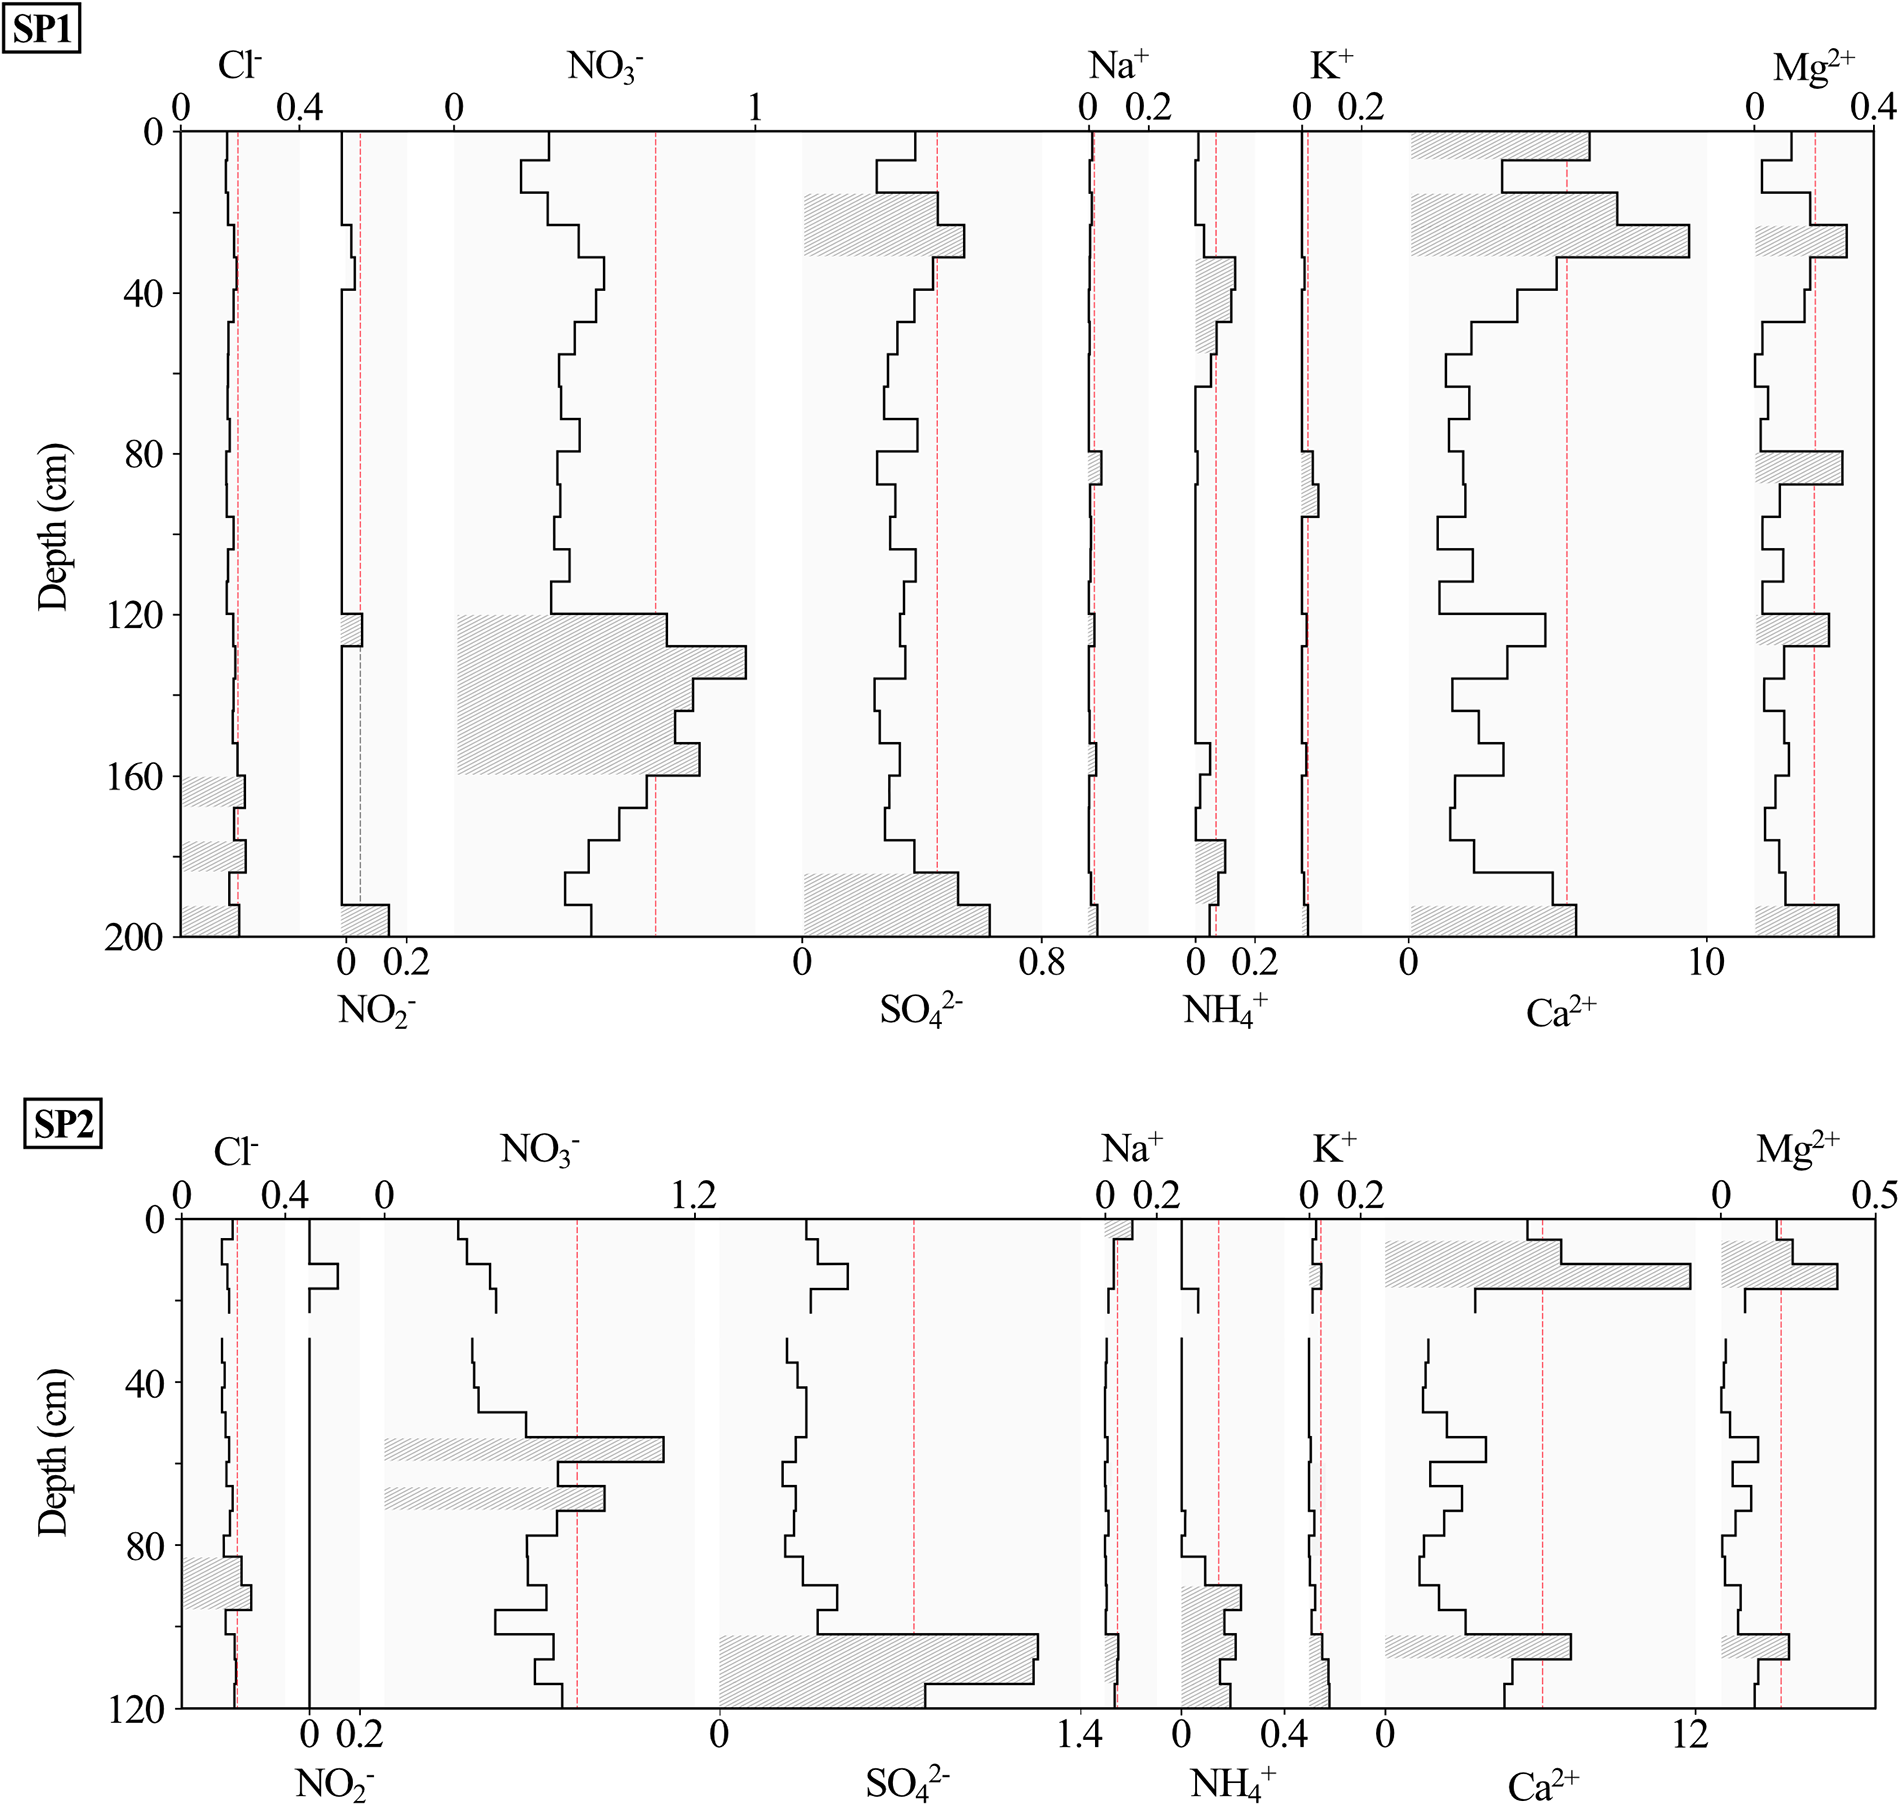
SP1 and SP2 ion concentration profiles (mg∙L−1). Shaded intervals with patterned fill mark samples with z-scores ≥ 1 (significant maxima). The dashed red line indicates the z = 1 threshold (z-scores express deviations in units of the standard deviation, σ).

Figure 2 Long description
Two line graphs display ion concentration profiles for SP1 and SP2 across depth in centimeters. The x-axis for each graph represents different ions: chloride, nitrate, sodium, potassium, magnesium, sulfate, ammonium and calcium, with respective concentration units. The y-axis is labeled ′Depth (cm)′ ranging from 0 to 200 centimeters for SP1 and 0 to 120 centimeters for SP2. Each graph includes shaded intervals with patterned fill marking samples with Z-scores greater than or equal to 1, indicating significant maxima. The dashed red line represents the Z equals 1 threshold. SP1 shows notable peaks in chloride and calcium concentrations, while SP2 displays peaks in chloride and calcium as well. The graphs illustrate variations in ion concentrations at different depths, with specific intervals marked for statistical relevance.
To facilitate the presentation of the depth-dependent patterns, each snow pit was subdivided, for descriptive purposes only, into three broad depth intervals (surface, intermediate and deep) to simplify the description of the vertical distribution of ionic peaks along the profiles, rather than to define physical stratigraphic units or chemically constrained zones. In SP1, the surface zone ranges from 0–60 cm depth, the intermediate zone from 60–160 cm depth and the deep zone from 160–200 cm depth. At the surface (0–8 cm), a peak in Ca2+ is observed, whereas the 16–24 cm and 24–32 cm intervals exhibit coincident concentration maxima of SO42− and Ca2+, with Mg2+ also peaking in the 24–32 cm interval. Between 32–56 cm, a distinct NH4+ peak is observed. In the intermediate zone, the 80–88 cm interval shows simultaneous maxima of Na+, K+ and Mg2+, with an additional K+ peak at 88–96 cm. Further down, at 120–128 cm, coincident concentration maxima are observed among NO2−, NO3−, Na+ and Mg2+. Between 128–160 cm, NO3− is the only ion showing a distinct concentration peak, with a local coincident Na+ peak within the same depth interval. In the deep zone of SP1, isolated Cl− peaks are identified at 160–168 cm, along with coincident peaks at 176–184 cm between Cl− and NH4+, at 184–192 cm between SO42− and NH4+ and at 192–200 cm, where peaks of Cl−, SO42−, Na+, K+, Ca2+ and Mg2+ coincide.
In SP2, the surface zone spans 0–30 cm depth, the intermediate zone 30–96 cm depth and the deep zone 96–120 cm depth. A Na+ peak is observed at 0–6 cm depth, followed by a coincident maximum of Ca2+ and Mg2+ at 6–18 cm, with a K+ peak added at 12–18 cm. In the intermediate zone, Cl− shows maxima at 84–96 cm, while NO3− peaks occur at 54–60 cm and 66–72 cm. The deep zone presents three intervals with multi-ion peak coincidence: SO42−, Na+, NH4+, K+, Ca2+ and Mg2+ coincide at 102–108 cm; SO42−, Na+, NH4+ and K+ at 108–114 cm; and only NH4+ and K+ peaks coincide at 114–120 cm.
5. Discussion
To understand the origin of the ionic composition in the snowpack, we focus on SP1, as previous studies reported no substantial post-depositional modification during the accumulation period (October 2018–February 2019), allowing its ionic record to reflect atmospheric chemistry indirectly (González-Santacruz and others, Reference González-Santacruz2025).
In SP1, some ions exhibit isolated concentration peaks, while others reach simultaneous maxima, suggesting a common origin. The PCA also supports this idea, showing that a few components account for most of the variance, thus indicating several common deposition modes. Ion concentrations along the SP1 profile reflect the combined influence of atmospheric aerosol load, wet and dry deposition events and post-depositional processes acting throughout the accumulation season. Analysing concentration patterns and ionic relationships in the snowpack is a widely used method to infer potential sources; however, given the inherent uncertainty of such interpretations, dependent on multiple variables and complex processes, they should be regarded with caution. Overall, the soluble ionic composition in SP1 seems to reflect a dynamic interaction between crustal and anthropogenic sources.
Although snowfall is expected to be an efficient scavenging mechanism in this high-elevation environment, the relative contribution of wet and dry deposition cannot be quantitatively resolved from the present seasonal snow pit snapshot. No in situ precipitation measurements were available for the full accumulation season, as the AWS only operated during the fieldwork campaign (from January–February 2019) and did not include precipitation measurements. Therefore, the ionic composition preserved in SP1 should be interpreted as the cumulative result of both snowfall scavenging and dry aerosol deposition processes acting throughout the season, later modified by post-depositional processes.
5.1. Crustal sources
Mineral dust forms through crustal erosion in arid and semi-arid regions. Wind suspends the particles in the atmosphere and deposits them on the snow surface (Prospero, Reference Prospero1999). It is the most abundant atmospheric aerosol, making up to 45% of the global load (Satheesh and Krishnamoorthy, Reference Satheesh and Krishnamoorthy2005). Dust is an important source of Ca2+, mainly from soil carbonates, and also contributes to Na+, K+, SO42− and Mg2+ (Wake and others, Reference Wake, Mayewski, Zichu, Ping and Li1993; Li and others, Reference Li2006; Sun and others, Reference Sun2010; Wu and others, Reference Wu, Zhang, Cao, Xu and An2012; Wright and others, Reference Wright, Zhang, Cheng, Aherne and Wentworth2018; He and others, Reference He, Liu and Zhu2019; Chen and others, Reference Chen2023). However, smaller amounts of Ca2+ may also come from traffic, biomass burning (Safai and others, Reference Safai2002) and cement dust (Han and others, Reference Han2010).
HMA is strongly influenced by dust deposition, with Ca2+ and Mg2+ levels increasing from south to north (Wake and others, Reference Wake, Mayewski, Zichu, Ping and Li1993). In winter, westerly winds dominate circulation in western HMA and can transport Ca2+ and Mg2+ from distant parts of Eurasia (Okada and Kai, Reference Okada and Kai2004; Liu and others, Reference Liu, Geng and Hou2010). At a regional scale, the Taklamakan Desert, located northeast of the study area, represents one of the largest deserts worldwide and a major source of mineral dust in the Northern Hemisphere (Zhang and others, Reference Zhang, Arimoto and An1997). The arid and semi-arid conditions prevailing across HMA favour the development of extensive evaporitic deposits enriched in chlorides, sulphates and carbonates. Such deposits are particularly abundant in endorheic basins, including the Taklamakan Desert (Yabuki and others, Reference Yabuki2005; Sun and Liu, Reference Sun and Liu2006). Consequently, soils in these arid regions contain sulphate minerals such as gypsum (CaSO4 · 2 H2O), anhydrite (CaSO4) and thenardite (Na2SO4), whose ions can be mobilized by wind erosion and contribute SO42− to the regional dust load (Wu and others, Reference Wu, Zhang, Cao, Xu and An2012).
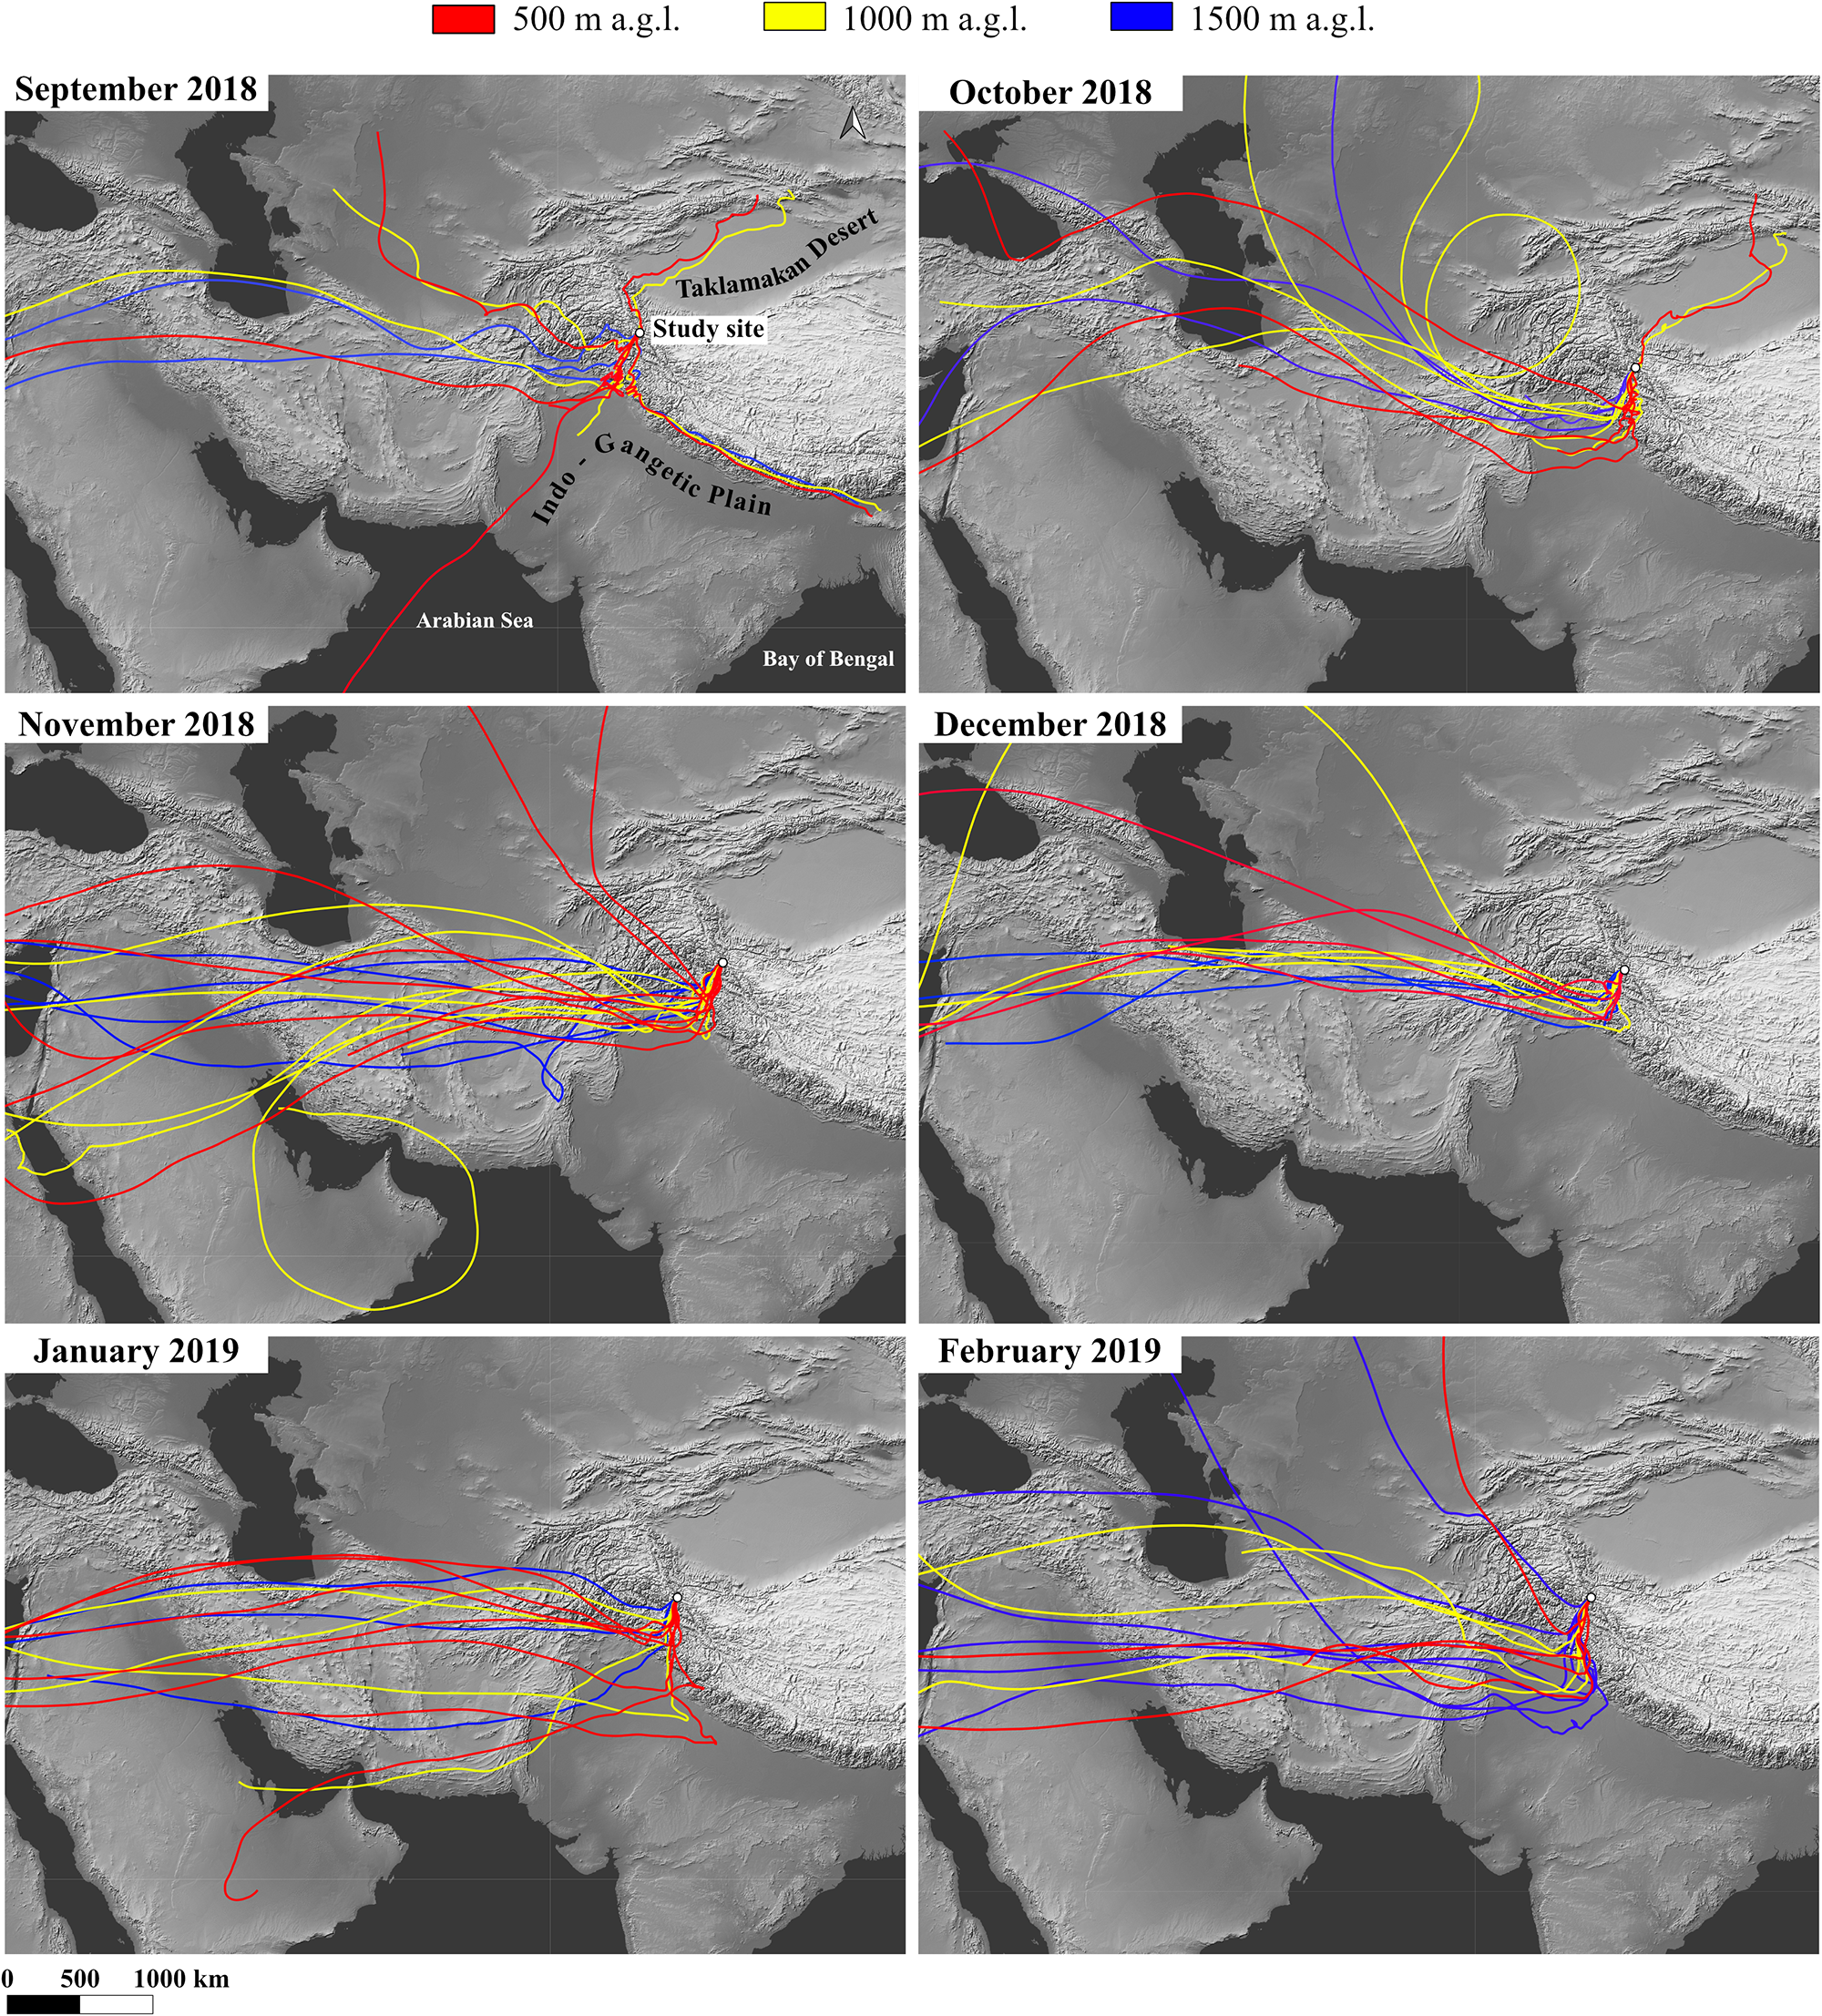
The semi-arid Karakoram environment could be a major year-round source of mineral dust for our study site, although long-range transport can also contribute. Based on the daily 10-day back trajectories computed, the only months in which back trajectories indicate transport pathways from the Taklamakan Desert to the study site were September (not considered part of the accumulation season) and October 2018 (Fig. 3). This Taklamakan-related signal was restricted to the 500 and 1000 m a.g.l. trajectories, accounting for 13% and 17% of the total trajectories in September, respectively, and 13% at both arrival heights in October, while no Taklamakan influence was detected at 1500 m a.g.l. This highlights the elevation-dependent nature of dust transport reaching the glacier during the onset of the accumulation season. During these months, the Taklamakan may have contributed episodic inputs of mineral dust to the site, potentially enhancing Ca2+, Mg2+ and SO42− in the lower section of the snowpack and helping to explain, at least in part, the Ca2+ maxima observed in that section. This interpretation is consistent with the carbonate-rich mineral assemblages and systematically elevated CaO contents reported for Taklamakan dust (Zhu and Yang, Reference Zhu and Yang2009; Zhao and others, Reference Zhao, Liu, Chen and Ji2019). In contrast, during the main accumulation period (November 2018 to February 2019), the atmospheric circulation was dominated by the westerlies, suggesting that part of the ionic inputs may have originated from regions to the west (e.g. the Middle East and broader Eurasia region). A potentially prominent dust-deposition signal is observed in the upper section of SP1, where Ca2+, Mg2+ and K+ show coincident peaks. These ions also display a marked co-occurrence with SO42−, suggesting that sulphate may be directly linked to mineral dust inputs, possibly reflecting the mobilization of evaporitic minerals into the regional dust load (Wu and others, Reference Wu, Zhang, Cao, Xu and An2012). A fraction of the Ca2+ signal may also derive from local anthropogenic sources, such as nearby base camps (e.g. K2 Base Camp), particularly emissions generated by kerosene burning for cooking and heating, as well as waste burning on the glacier during the expedition; however, we cannot quantify their specific contributions. Nevertheless, during the accumulation season, AWS data indicate predominantly westerly and southerly winds, and the snow pits were excavated south of Base Camp to minimize, as far as possible, the influence of camp-related emissions (Fig. SM2).
Main clusters of 10-day air-mass back trajectories calculated with arrival heights of 500, 1000 and 1500 m a.g.l., using the snow pit sites as endpoints. The 180–day analysis period spans September 2018–February 2019, covering the accumulation season (October 2018–February 2019) and the preceding month.

Figure 3 Long description
Six maps display air-mass back trajectories to a study site in South Asia from September 2018 to February 2019, with arrival heights of 500 m a. G. L. (red), 1000 m a. G. L. (yellow) and 1500 m a. G. L. (blue). Each map represents a different month, illustrating the pathways of air masses. In September 2018, trajectories originate from the Taklamakan Desert and Arabian Sea, with significant paths at 500 and 1000 m a. G. L. October 2018 shows similar patterns, with paths from the Taklamakan Desert. November 2018 indicates trajectories primarily from the Arabian Sea and Middle East. December 2018 continues this pattern, with paths from the Arabian Sea. January 2019 shows trajectories from the Arabian Sea and Middle East, while February 2019 displays similar origins. The maps highlight elevation-dependent transport patterns, with varying influences from regional sources across the months. The scale bar indicates distances of 500 and 1000 km.
PC1 shows positive loadings of Ca2+, Mg2+, Na+ and SO42− (and, to a lesser extent, K+), which is consistent with a common crustal deposition mode. This interpretation is further reinforced by the correlations between SO42− and Ca2+ (r = 0.74, p < 0.01), SO42− and Mg2+ (r = 0.56, p < 0.01), Na+ and Mg2+ (r = 0.66, p < 0.01) and Na+ and K+ (r = 0.56, p < 0.01). Although the correlation between Na+ and SO42− is lower (r = 0.19), the combined evidence supports the idea that evaporitic-derived components associated with mineral dust may significantly influence the ionic composition of the snowpack. On the other hand, chlorides characteristic of saline soils and lakes, both common across HMA, may represent possible crustal sources of Cl−, associated with K+ (Li and others, Reference Li2006, Reference Li, Kang, Zhang and Kaspari2007; He and others, Reference He, Liu and Zhu2019).
5.2. Anthropogenic sources
Human activities such as industry and transportation are major sources of NO3− and SO42−, as both sectors rely on fossil fuel combustion and biomass burning, emitting NOx and SO2 into the atmosphere (Safai, Reference Safai2002; Duan and others, Reference Duan, Thompson, Yao, Davis and Mosley‐Thompson2007; Zhang and others, Reference Zhang2016; Avak and others, Reference Avak2019). Since the Industrial Revolution, emissions of these compounds have increased significantly, with a marked intensification in Asia during the late 20th century due to rapid industrialization and agricultural expansion (Pacyna and Pacyna, Reference Pacyna and Pacyna2001; Grigholm and others, Reference Grigholm2016; Kang and others, Reference Kang2016). Livestock farming and fertilizer use also contribute significantly to the atmospheric presence of NO3− and SO42− (Wang and others, Reference Wang, Wang, Kang and Kou2011). Ammonium (NH4+) is mainly associated with agriculture and animal husbandry (Wang and others, Reference Wang, Wang, Kang and Kou2011; Avak and others, Reference Avak2019), but is also linked to biomass burning (Shugui and others, Reference Shugui, Dahe, Dongqi, Shichang, Mayewski and Wake2003; Virkkula and others, Reference Virkkula2006) and transportation, particularly through catalytic converters in exhaust systems (Bo and others, Reference Bo, Xue, Xu, Du, Zhou and Tang2019). Finally, K+ is another established indicator of biomass burning (Wright and others, Reference Wright, Zhang, Cheng, Aherne and Wentworth2018).
In HMA, snow concentrations of SO42−, NO3− and NH4+ are typically linked to emissions of SO2, NOx and NH3. In the Godwin-Austen Glacier snowpack, anthropogenic emissions may have a local origin related to human activities on the glacier (e.g. cooking, heating and helicopter operations), a regional origin associated with the Indo-Gangetic Plain (IGP; the extensive, densely populated and highly industrialized alluvial lowlands spanning the Indus Plain in Pakistan and the Gangetic Plain in northern India), or result from long-range transport via the westerlies (Mayewski and others, Reference Mayewski, Lyons and Ahmad1983; Liu and others, Reference Liu, Geng and Hou2010; Zhang and others, Reference Zhang2016). Ten-day back trajectories indicate more frequent regional pathways from the Indus Plain and the northern Gangetic Plain in September 2018, and from the northern Indus Plain in October 2018 (Fig. 3). In September, Indus Plain transport was most prominent at 1000 m a.g.l. (47% of the monthly trajectories), with a smaller contribution at 500 m (7%), whereas northern Gangetic Plain pathways were present at all three heights (10–13%). In October, northern Indus Plain influence became dominant at 500 and 1000 m a.g.l., accounting for 52% and 48% of the trajectories, respectively. In November 2018, trajectory pathways were again dominated by air masses passing over the northern Indus Plain, particularly at 500 m a.g.l., where nearly 90% of the monthly trajectories followed this pathway, with only a minor additional contribution at 1000 m a.g.l. This was followed by a second period of enhanced IGP influence in January–February 2019, when trajectories more often traversed the central and northern Indus Plain and the central and western Gangetic Plain. In January, this pathway accounted for 45%, 64% and 58% of the monthly trajectories at 500, 1000 and 1500 m a.g.l., respectively, increasing further in February to 96%, 75% and 85%. In parallel, throughout the accumulation season, especially from November 2018–February 2019, air-mass transport was predominantly governed by the westerlies, which became progressively more evident with increasing arrival height, strengthened towards a maximum in December 2018 and weakened thereafter. The SO42− can be associated with suspended mineral particles through surface reactions forming sulfuric acid and salts (Dentener and others, Reference Dentener, Carmichael, Zhang, Lelieveld and Crutzen1996; Li and Shao, Reference Li and Shao2009). This occurs by adsorption and oxidation of SO2 or absorption of acidic gases, partially neutralized by the alkaline content of dust particles (Ullerstam and others, Reference Ullerstam, Vogt, Langer and Ljungström2002). In SP1, high SO42− levels might reflect anthropogenic input, but the absence of a concurrent NO3− peak, commonly linked to such sources, may support a dominant crustal origin from the weathering of sulphate-rich minerals. In contrast, the snow pit intermediate section (120–160 cm) shows a marked NO3− increase, along with a NO2− peak, possibly indicating an influx of anthropogenic pollutants.
The correlation between Na+ and Cl− is commonly used as a tracer for marine aerosols (Nowak and others, Reference Nowak, Hodson and Turchyn2018). However, several pieces of evidence argue against a marine influence in this snowpack. First, central Karakoram is far from any coastline, and oceanic air masses are largely blocked by the Himalayas and the southern slope of the Karakoram. Second, back trajectories for the accumulation season indicate that air-mass pathways were predominantly continental rather than marine. The only indication of a marine influence occurs in September, when a minor fraction of air masses originates from the Arabian Sea (Fig. 3). However, it is not included in the accumulation season, and given the distance to the study site (approximately 1500 km), any sea-salt signal is expected to be strongly attenuated during transport and precipitation scavenging. Finally, Na+ and Cl− are anticorrelated and do not co-vary significantly in any principal component, suggesting distinct sources. Instead, Cl−, aside from its possible crustal origin, shows positive correlations with NO3−, suggesting an additional anthropogenic component likely associated with industrial HCl-rich emissions from regional industrial activities (e.g. the Indo-Gangetic Plain), while smaller sub-regional sources within the Baltistan region cannot be excluded. This is consistent with the moderate loadings of Cl− and NO3− in PC2 and PC3. Furthermore, the persistently low Na+/Cl− ratios (indicative of excess Cl−) support the possible presence of atmospheric HCl scavenged onto the snowpack from anthropogenic sources (Shrestha and others, Reference Shrestha, Wake and Dibb1997). This interpretation aligns with the structure of PC2, where Cl− reaches its highest loading, whereas Na+ shows a strongly negative loading.
The PCA also reveals associations among ions commonly linked to anthropogenic sources. PC2 captures the combined signal of Cl−, NH4+, NO3− and SO42−, together with a negative loading of Na+, consistent with the Cl− excess previously identified and its anticorrelation with Na+. In contrast, PC3 is dominated by NO3−, a species commonly linked to regional NOx-related inputs, with secondary contributions from Cl−, Na+ and K+, suggesting a distinct variability pattern within the broader anthropogenic or mixed influence.
When evaluating the overall contribution of both crustal and anthropogenic sources, our results are consistent with previous studies in the region. In the central HMA, Ca2+ is typically the dominant ion in snow pits, followed by SO42− and NO3− (Kang and others, Reference Kang2020), in line with our findings. High Ca2+ levels have also been reported in glaciers of the central and western Himalayas (Panicker and others, Reference Panicker2019; Thakur and others, Reference Thakur2021). Similar patterns have been observed in contexts comparable to our study site, such as at Everest Base Camp, where Ca2+ is again dominant, followed by Mg2+, indicating mineral dust-driven deposition. Among anions, NO3− is the most abundant, followed by SO42−, a pattern typically linked to anthropogenic input (Clifford and others, Reference Clifford2021), also consistent with our observations.
5.3. Trace elements: supporting evidence for ion-based interpretation
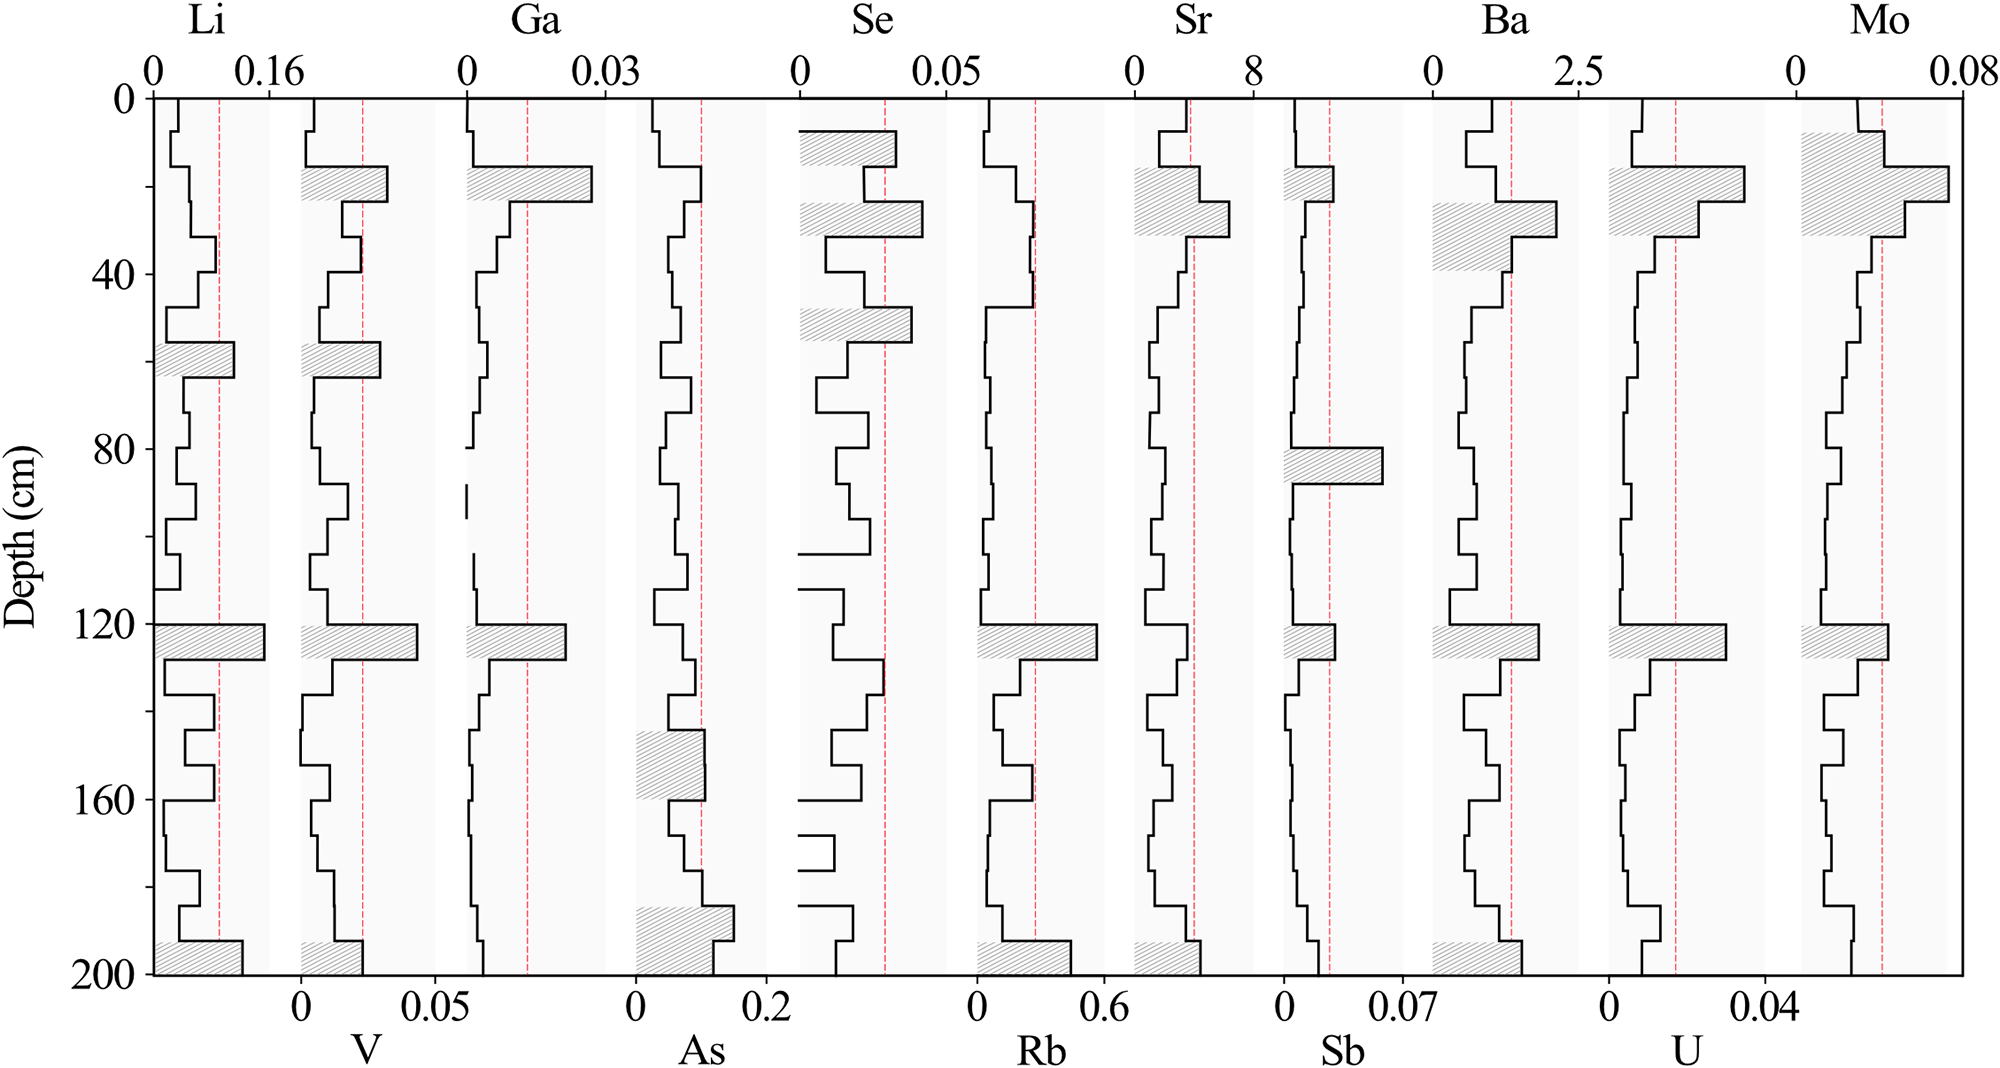
To complement the major ion results, trace element concentrations were analysed along SP1 (Fig. 4). The selected elements were Li, V, Ga, As, Se, Rb, Sr, Sb, Ba, U and Mo. Strontium (Sr) showed the highest average concentration (2.345 ± 1.381 µg⋅L−1), with peaks up to 6.330 µg⋅L−1, followed by Ba (0.909 ± 0.446 µg⋅L−1, max. 2.113 µg⋅L−1) and Rb (0.139 ± 0.136 µg⋅L−1, max. 0.559 µg⋅L−1), which also displayed the greatest variability. At lower concentrations (roughly one order of magnitude lower), the elements As (0.070 ± 0.030 µg⋅L−1), Li (0.055 ± 0.035 µg⋅L−1), Mo (0.026 ± 0.014 µg⋅L−1), Se (0.020 ± 0.009 µg⋅L−1), Sb (0.013 ± 0.014 µg⋅L−1), V (0.012 ± 0.010 µg⋅L−1), U (0.009 ± 0.008 µg⋅L−1) and Ga (0.005 ± 0.007 µg⋅L−1) were detected. The LoD for the analysed trace elements ranged from 0.123 µg⋅L−1 (U) to 0.916 µg⋅L−1 (Ba). The dominance of Sr, Ba and Rb (all clearly crustal elements) makes them especially relevant for source interpretation. While all trace elements can originate from both crustal and anthropogenic sources, their interpretation is supported by the concurrent patterns and the regional geographical context.
Depth profiles of selected trace elements in SP1 (ppb). Shaded areas with line patterns mark samples with z-scores ≥ 1 (i.e. concentrations ≥1 standard deviation above the mean), defining significant maxima. A red dashed line indicates the z = 1 threshold.

Figure 4 Long description
Depth profiles of selected trace elements in SP1 (ppb). The y-axis is labeled Depth in centimeters, ranging from 0 to 200. Each x-axis represents elemental concentration in parts per billion (ppb) for Li, Ga, Se, Sr, Ba, Mo, V, As, Rb, Sb and U. Shaded areas with line patterns mark samples with z-scores greater than or equal to 1, indicating concentrations greater than or equal to 1 standard deviation above the mean, defining significant maxima. A red dashed line indicates the z equals 1 threshold. Li shows variation with peaks around 40 and 160 centimeters. Ga has a consistent profile with minor fluctuations. Se displays a gradual increase with depth. Sr shows significant peaks at 40 and 160 centimeters. Ba has a similar pattern to Sr with notable peaks. Mo shows minor variations across the depth. V, As, Rb, Sb and U exhibit less pronounced changes. The profiles highlight key depth horizons where concentrations increase, providing insight into elemental distribution in the sample.
In the upper section of SP1, where ion chemistry indicates dominant mineral dust influence, Sr and Ba reach their highest concentrations (6.330 µg⋅L−1 and 2.113 µg⋅L−1, respectively). Sr is linked to the weathering of metamorphic rocks (e.g. shales), sedimentary formations (limestone, dolomite, marl and sandstone) and evaporitic deposits such as gypsum and anhydrite (Burger and Lichtscheidl, Reference Burger and Lichtscheidl2019), in line with the SO42− origin inferred from major ions. Potential anthropogenic sources include wood burning and coal combustion (Andersson and Löfvendahl, Reference Andersson, Löfvendahl and Åberg1990). Barium (Ba) mainly occurs in barite (BaSO4) and witherite (BaCO3), minerals often linked to hydrothermal or volcanic environments, though at the global scale it is primarily derived from weathered sedimentary barite deposits (United States Environmental Protection Agency, 2005; Johnson and others, Reference Johnson, Piatak, Miller, Schulz, DeYoung, Seal and Bradley2017). Its main anthropogenic source is industrial emissions (ATSDR, 1992). Therefore, although Sr and Ba may also be released by human activity, their coincidence with Ca2+ and Mg2+ in the upper part of the snow pit, together with the glacier’s remote setting and the regional context, points to mineral dust as their most plausible origin, while secondary anthropogenic contributions cannot be ruled out.
In the same upper section of the snowpack, several trace elements with mixed origins appear alongside Sr and Ba. Lithium (Li) can derive from igneous rocks, clays, or evaporite deposits in desert lakes (Bradley and others, Reference Bradley, Stillings, Jaskula, Munk, McCauley, Schulz, DeYoung, Seal and Bradley2017; Castor and Henry, Reference Castor and Henry2020; EarthChem, 2025), but coal combustion is also a significant source, contributing to around 38% of global atmospheric emissions (Schlesinger and others, Reference Schlesinger, Klein, Wang and Vengosh2021). Vanadium (V) has both volcanic and crustal origins, though current anthropogenic emissions, mainly from fossil fuels, surpass natural levels (Schlesinger and others, Reference Schlesinger, Klein and Vengosh2017). Gallium (Ga), primarily sourced from bauxite, is also released during industrial processes such as coal burning (Foley and others, Reference Foley, Jaskula, Kimball, Schulte, Schulz, DeYoung, Seal and Bradley2017). Arsenic (As) is commonly found in pyrite, arsenopyrite and enargite (Francesconi and Kuehnelt, Reference Francesconi and Kuehnelt2004; Drahota and others, Reference Drahota2009; Díaz and others, Reference Díaz, Serrano and Leiva2018), with volcanic activity as its main natural source, but smelting, coal combustion and mining are major anthropogenic contributors (Huang and others, Reference Huang2014; Ghosh and others, Reference Ghosh, Ghosh and Bhadury2022; Sun and others, Reference Sun, Wang, Liu, Yin, Li and Shao2023). Selenium (Se) is released through the weathering of black shales, limestones and coal deposits (Zou and Mauter, Reference Zou and Mauter2021), but its atmospheric abundance has increased due to smelting, mining and petroleum refining, with coal-fired power plants standing out as the dominant source of energy production in the region (Wen and Carignan, Reference Wen and Carignan2007; Gan and others, Reference Gan, Huang, Zhang, Zhou, He and Zhou2021). Rubidium (Rb) mainly originates from natural sources, such as potassium feldspars, micas and clays, which prevail over anthropogenic inputs (Reimann and De Caritat, Reference Reimann and De Caritat1998). Antimony (Sb), though scarce in the crust, is mobilized through shale weathering and human activities like mining, smelting, coal combustion and brake abrasion related to traffic (Bolan and others, Reference Bolan2022; Tang and others, Reference Tang, Hassan, Nawaz, Yang, Liu and Yang2023). Uranium (U) is released by the weathering of volcanic rocks, black shales and granites, with additional inputs from mining, nuclear testing and spent fuel disposal (Nolan and Weber, Reference Nolan and Weber2015). Molybdenum (Mo) can be mobilized as mineral dust and is also emitted through combustion, traffic and agriculture (Wong and others, Reference Wong, Mahowald, Marino, Williams, Chellam and Howarth2020, Reference Wong2021). Given their association with Sr, Ba, Ca2+ and Mg2+, these remaining trace elements are likely of crustal origin.
In the central section of the snow pit (between 120–128 cm depth), a distinctive grouping of trace elements appears at significant concentrations, including Li, V, Ga, Rb, Sb, Ba, U and Mo. These peaks coincide with a notable absence of Sr, a potential crustal indicator and with pronounced increases in NO3− and NO2−, previously discussed as tracers of anthropogenic activity. In contrast, the upper and lower parts of the profile exhibit isolated enrichments of individual elements. For example, Se appears alongside elevated NH4+, suggesting a potential anthropogenic source; Sb coincides with Na+ and K+, pointing in this case to mineral dust as its origin; and As co-occurs with both NO3− and Na+, indicating a likely mixed origin, with anthropogenic input playing a dominant role.
5.4. Snow acidity
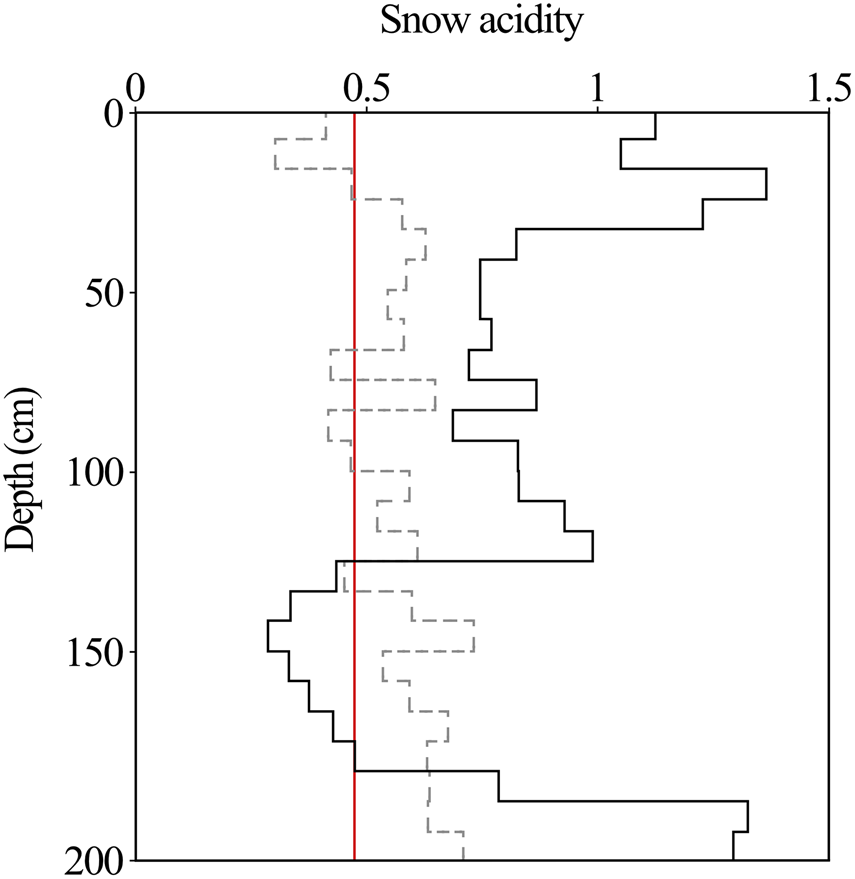
An increase in SO2 and NOx emissions from anthropogenic sources is associated with increased precipitation acidity during the 20th century (Schwikowski and others, Reference Schwikowski, Döscher, Gäggeler and Schotterer1999; Preunkert and others, Reference Preunkert, Legrand and Wagenbach2001). In contrast, aerosols from crustal erosion contribute to the alkalinity of precipitation (Rodhe and others, Reference Rodhe, Dentener and Schulz2002; Kulshrestha and others, Reference Kulshrestha, Kulshrestha, Sekar, Sastry and Vairamani2003). Although no direct pH measurements are available, an indirect method provides an estimate of snowpack acidity (Fig. 5). This is based on the ratio ([SO42−] +[NO3−])/([Ca2+] +[NH4+]), where high values indicate a higher acidity potential in the snowpack (Xue and others, Reference Xue, Chen, Li, Liu, Li and Han2020). In this case, the mean value in SP1 is 0.59, which suggests that alkaline cations predominate over acidic anions. Therefore, alkaline cations (Mg2+ and especially Ca2+) play a key role in pH regulation (Li and others, Reference Li, Kang, Zhang and Kaspari2007).
Evolution of snow acidity along SP1. The dashed line represents overall acidity, calculated as ([SO42−] + [NO3−])/([Ca2+] + [NH4+]), while the solid line indicates the type of acid precipitation based on the [SO42−]/[NO3−] ratio. The red vertical line marks the 0.5 threshold: values <0.5 reveal nitric acid dominance, while values >0.5 reflect mixed nitric and sulfuric acidity. Both parameters share the same horizontal scale.

As in rainfall, the ratio [SO42−]/[NO3−] serves to identify the dominant acid type in precipitation (Kim and Cho, Reference Kim and Cho2003; Greilinger and others, Reference Greilinger, Schöner, Winiwarter and Kasper-Giebl2016; Zhu and others, Reference Zhu2020). Values below 0.5 generally indicate nitric acid dominance, whereas values between 0.5 and 3.0 indicate a combined influence of nitric and sulfuric acids. Ratios above 3.0 suggest that acidity is primarily driven by sulfuric acid (Xue and others, Reference Xue, Chen, Li, Liu, Li and Han2020). The [SO42−]/[NO3−] ratio was calculated from the measured total dissolved ion concentrations. To better constrain the sulphate term, its non-sea-salt contribution was additionally evaluated using Na+-based sea-water reference ratios from Keene and others (Reference Keene, Pszenny, Galloway and Hawley1986), with the %nssf calculated following Kumar and others (Reference Kumar, Singh, Gupta, Lone and Kulshrestha2016), indicating a predominantly non-sea-salt sulphate contribution (>99% nssf). This verification was only required for sulphate because NO3− is not considered in classical Na+-based sea-salt correction approaches. In SP1, most of the profile indicates combined input from nitric and sulfuric acids, except for the 120–176 cm depth interval, where nitric acid predominates, in line with high NO3− concentrations at that depth.
5.5. SP2: post-depositional processes
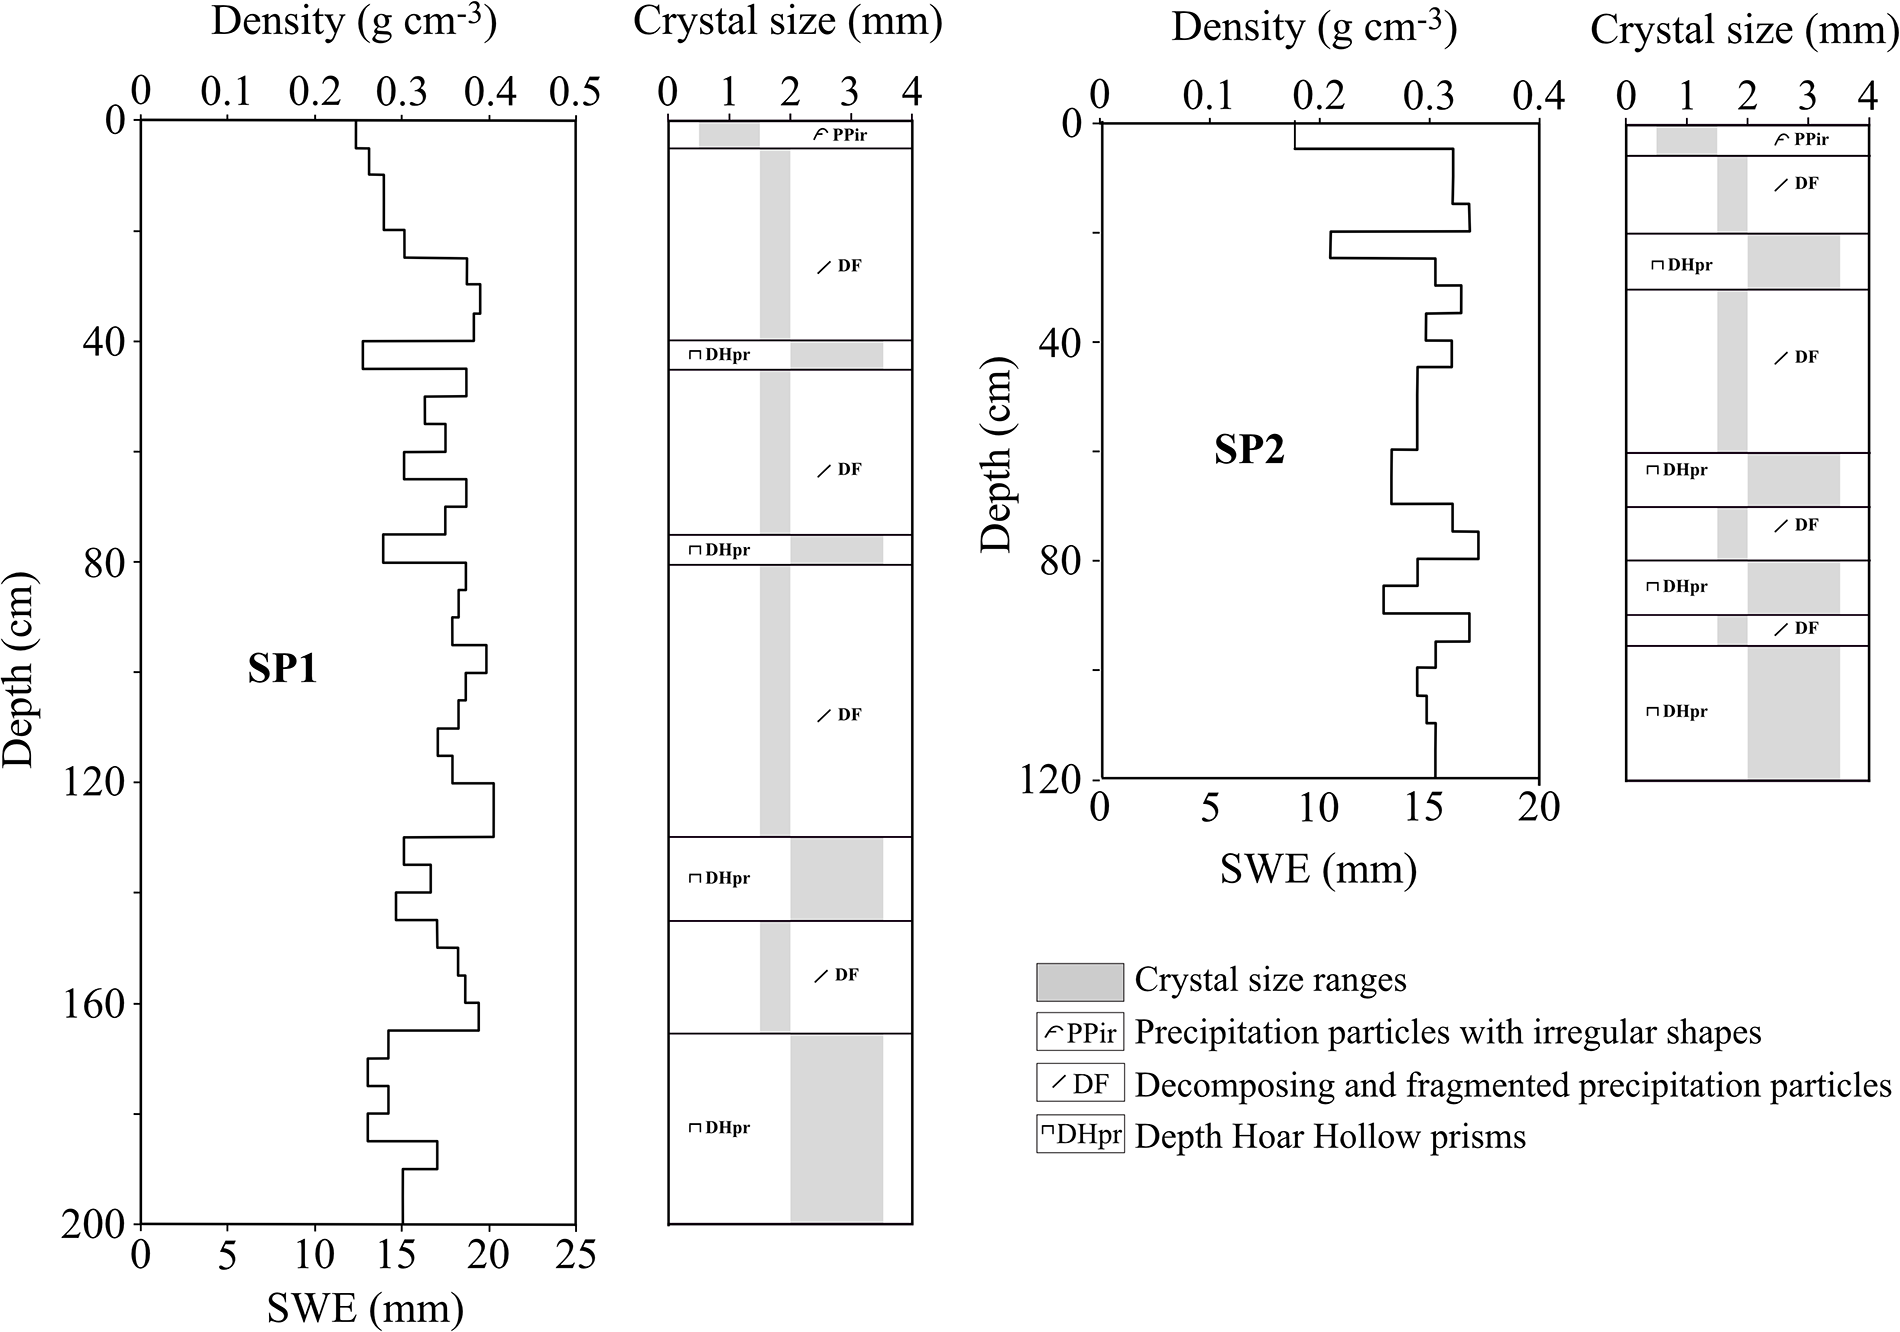
Although SP1 can be considered a representative record of the accumulation season, the ionic record in the deeper layers is less reliable than in the upper and middle sections of both snow pits, as sporadic autumn snowfall and occasional positive temperatures may have favoured cycles of ionic reconcentration. Post-depositional alterations cannot be excluded in the upper and middle zones of the snow pits; however, the comparatively higher integrity of the SP1 record is supported by field observations and by the previously published δ18O and d-excess profiles from the same snow pits (González-Santacruz and others, Reference González-Santacruz2025). First, SP1 is located at a more sheltered site than SP2, reducing exposure to wind-driven redistribution and likely receiving less direct solar radiation, which may limit surface energy inputs and associated post-depositional modification. Second, detailed stratigraphic profiles of both snow pits, including the snow water equivalent and grain-size evolution, revealed the presence of depth-hoar layers composed of larger faceted crystals with sharp edges, typically associated with strong temperature-gradient metamorphism (Fig. 6). Because the presence of these layers indicates vapour diffusion within the snowpack, the δ18O and d-excess profiles were re-examined in light of the stratigraphic evidence. As a result, no systematic δ18O anomalies were detected across the depth-hoar layers in either snow pit, whereas exceptionally high d-excess values were confined exclusively to the basal depth-hoar layer of SP2, reflecting enhanced diffusion associated with a stronger temperature gradient, likely linked to its reduced snowpack thickness compared to SP1. These observations indicate that post-depositional processes were more pronounced in SP2, supporting the interpretation of SP1 as a comparatively more preserved record. Post-depositional processes acting in both snow pits may differentially affect individual ion concentrations, even when they originate from the same atmospheric source.
Stratigraphic profiles of snow pits SP1 (left) and SP2 (right), showing snow water equivalent (SWE), density and the evolution of ice crystal size and shape with depth, following the grain classification schemes of Colbeck and others (Reference Colbeck1990) and Fierz and others (Reference Fierz2009).

Figure 6 Long description
For SP1: Density ranges from 0.2 to 0.4 g cm superscript minus 3, with higher values around 80 cm depth. SWE varies between 10 and 20 mm, peaking near 120 cm depth. Crystal size layers show transitions between grain types, including precipitation particles with irregular shapes (PPir), decomposing and fragmented particles (DF) and depth hoar hollow prisms (DHpr). For SP2: Density ranges from 0.2 to 0.35 g cm superscript minus 3, with peaks around 60 cm depth. SWE fluctuates between 10 and 18 mm, with notable increases near 100 cm depth. Crystal size layers also transition between grain types, similar to SP1. The profiles indicate that SP1 has greater depth and SWE values compared to SP2. The crystal size columns show how grain types correspond to density and SWE variations, with specific patterns indicating different grain types as per the legend. Overall, SP1 and SP2 provide insights into snowpack characteristics and grain evolution with depth.
The processes responsible for several hiatuses along SP2, previously identified in the isotopic comparison of the same two snow pits (González-Santacruz and others, Reference González-Santacruz2025), have been linked to wind erosion, partial melting and sublimation, but their impact on ion concentrations warrants further investigation. In SP2, Ca2+ and Mg2+ still show marked peaks, albeit with distinct patterns: in the upper layers, Ca2+ increases by 25% and Mg2+ by 47%, with comparable increases in the bottom layers (28 and 7%, respectively). In contrast, Mg2+ peaks in the central section decrease by roughly 50%. Sulphate (SO42−) peaks in the upper section are reduced by 8% and lose statistical significance, while in the lower section, concentrations double and extend across a broader portion of the profile. A similar pattern is seen in NH4+: upper-layer peaks disappear with a 47% decrease, whereas in the lower layers, concentrations triple and extend across a broader depth range. Nitrate (NO3−), which showed a continuous 40 cm band in SP1, becomes more fragmented in SP2, but its concentration increases by 12%. Chloride (Cl−) exhibits limited vertical distribution in SP1 but increases in total concentration by 24% in SP2. Therefore, surface sublimation likely played a primary role in driving the overall increase in ion concentrations in SP2, as it concentrates solutes in the remaining snow (Xiaoni and others, Reference Xiaoni, Zhongqin, Edwards and Lixia2015). This is consistent with higher Ca2+ and Mg2+ concentrations in the upper and lower sections of SP2, while wind erosion may account for the reduced vertical extent of some peaks.
In the lower layers of SP2, NH4+ and SO42− show increases in both concentration and depth range. While sublimation events may account for NH4+, they do not explain the expanded depth range of these peaks. This could be due to elution, which would relocate ions downward. However, NH4+ is known to have low mobility compared to other ions, making this explanation less plausible for this ion. In contrast, SO42−, consistently reported among the most mobile ions during elution across different snow and firn settings (Eichler and others, Reference Eichler, Schwikowski and Gäggeler2001; Xiaoni and others, Reference Xiaoni, Zhongqin, Edwards and Lixia2015), shows behaviour consistent with this mechanism. Magnesium (Mg2+), often reported as one of the least mobile ions during elution (Xiaoni and others, Reference Xiaoni, Zhongqin, Edwards and Lixia2015), likely decreased in the central section due to mechanical wind removal rather than downward migration. As for NO3−, the observed variations may result from wind erosion, which reduces the snowpack vertical extent, and sublimation or limited meltwater-driven redistribution, which can locally increase concentration (Brimblecombe and others, Reference Brimblecombe, Tranter, Abrahams, Blackwood, Davies and Vincent1985; Tsiouris and others, Reference Tsiouris, Vincent, Davies and Brimblecombe1985; Zongxing, Reference Zongxing2009; Xiaoni and others, Reference Xiaoni, Zhongqin, Edwards and Lixia2015).
6. Conclusion
This study provides the first dataset of the ionic composition of the seasonal snowpack at the Godwin-Austen Glacier (Central Karakoram), based on field observations from winter 2018–19. Two snow pits were analysed: SP1, deeper and more sheltered, retained a more continuous and comparatively less altered record of seasonal ion variability, whereas SP2, more exposed, showed clear evidence of post-depositional alteration. This interpretation is supported by stratigraphic observations and previously published isotopic constraints, allowing an assessment of how post-depositional processes affect ion concentrations and their vertical distribution. In addition, selected trace elements were analysed to support interpretations derived from the major-ion dataset. Results must be interpreted with caution, as snowpack chemistry reflects the combined influence of complex atmospheric transport pathways and multiple post-depositional processes, which together introduce substantial uncertainty.
In SP1, several ions display coincident concentration maxima, suggesting common sources and similar deposition modes during the accumulation period. Overall, the ionic composition reflects a dynamic interplay between crustal and anthropogenic influences. With respect to crustal sources, the semi-arid climate of the Karakoram likely acts as a persistent regional source of mineral dust, particularly enriched in Ca2+ and Mg2+. Back-trajectory analysis indicates that during September and October 2018, the Taklamakan Desert, a major regional dust source, could have contributed to episodic mineral dust inputs. During the rest of the accumulation season (November 2018–February 2019), mineral dust was predominantly transported from more distant western regions, consistent with the establishment of the westerly circulation, while local sources likely continued to provide a background contribution. Part of the SO42− signal could also be associated with mineral dust inputs, likely reflecting the erosion of evaporite-rich sediments widespread in the region. The lack of co-occurrence between SO42− and NO3− (the latter being strongly associated with anthropogenic sources) further supports a dominant crustal contribution to sulphate.
Anthropogenic contributions may originate from multiple spatial scales. Local inputs may be associated with human activities on or near the glacier, whereas regional sources include emissions from the Indo-Gangetic Plain, as indicated by back trajectories during September, October and November 2018, as well as January and February 2019. In addition, long-range transport via the westerlies may have contributed anthropogenic pollutants during the accumulation period. In the intermediate section of SP1, a distinct enrichment in NO3−, accompanied by low but detectable NO2− values, indicates an enhanced influx of anthropogenic pollutants. From the perspective of precipitation acidity, here assessed indirectly through ionic composition rather than direct pH measurements, this NO3−–dominated interval is characterized by a predominance of nitric acid, whereas the rest of the SP1 profile reflects a combined influence of nitric and sulfuric acids.
This study provides a reference dataset for snow chemistry in the central Karakoram, a region where such observations remain scarce. The results contribute to a better understanding of deposition processes and post-depositional chemical evolution in high-mountain snowpacks and offer a baseline for future studies addressing atmospheric pollution, aerosol transport and anthropogenic influence in remote areas of western HMA.
Supplementary material
The supplementary material for this article can be found at https://doi.org/10.1017/jog.2026.10194.
Acknowledgements
This research was supported by the Spanish Government through the AEI-funded MicroFAME project (Ref. PID2022-140975NB-I00), as well as through Ref. MDM-2017-0714 (incl. the BALELUR-Sherpa project) and Ref. CEX2021-001201-M funded by MICIN/AEI/10.13039/501100011033. This research also received support from the ASAH-AS project (Grants for scientific research projects in the National Parks Network for the year 2021, Spanish Ministry for the Ecological Transition and the Demographic Challenge, Ref. 2799/2021). J.A.-I. acknowledges the support of a predoctoral grant from the Basque Government (PRE_2023_1_0131). We thank Alex Txikon for facilitating useful local connections, and the team of mountaineers and local porters for their assistance during fieldwork.


 Open access

