INTRODUCTION
Chaetognaths are an important component of marine zooplankton communities, second in abundance only to copepods (Feigenbaum & Maris, Reference Feigenbaum and Maris1984), and an important food for fish (Terazaki, Reference Terazaki2005) and carnivorous zooplankton (Froneman et al., Reference Froneman, Pakhomov, Gurney and Hunt2002), i.e. they play a key role in oceanic food web. Chaetognaths are a cosmopolitan group found in all major ocean systems, from temperate to tropical waters, such as in the tropical waters of the Indian (Nair et al., Reference Nair, Terazaki and Jayalakshmy2002), Atlantic (Pierrot-Bults, Reference Pierrot-Bults1982; Daponte et al., Reference Daponte, Capitanio, Nahabedian, Viñas and Negri2004), and Pacific (Bieri, Reference Bieri1959; Terazaki, Reference Terazaki1996) Oceans, and the Bohai Sea (Bi et al., Reference Bi, Sun, Gao, Zhang and Zhang2001), the East China Sea (Xu & Chen, Reference Xu and Chen2005), the South China Sea (Yin et al., Reference Yin, Chen, Zhang, Huang and Li2006), the Mediterranean Sea (Furnestin, Reference Furnestin, Spoel and Pierrot-Bults1979; Kehayias, Reference Kehayias2004), the Red Sea (Durcret, Reference Durcret1973), the Eastern Irish Sea (Khan & Williamson, Reference Khan and Williamson1970), and in the Arctic and subarctic areas of the Indian (David, Reference David, Harding and Tebble1963), Atlantic and Pacific Oceans (Terazaki, Reference Terazaki1998).
Intensive field investigations have revealed the spatial and temporal distributions of chaetognaths worldwide (e.g. Khan & Williamson, Reference Khan and Williamson1970; Grant, Reference Grant1977; Marazzo & Nogueira, Reference Marazzo and Nogueira1996; Terazaki, Reference Terazaki1996; Pierrot-Bults & Nair, Reference Pierrot-Bults, Nair, Ormond, Gage and Angel1997; Ruiz-Boijseauneau et al., Reference Ruiz-Boijseauneau, Sanvicente-Añorve and Álamo2004; Yin et al., Reference Yin, Chen, Zhang, Huang and Li2006). Within chaetognaths, some species are distributed worldwide, for example Sagitta enflata, which is distributed widely in temperate and tropical waters (e.g. Cheney, Reference Cheney1985; Terazaki Reference Terazaki1993, Reference Terazaki1996; Pierrot-Bults & Nair, Reference Pierrot-Bults, Nair, Ormond, Gage and Angel1997; Nair et al., Reference Nair, Terazaki and Jayalakshmy2002; Daponte et al., Reference Daponte, Capitanio, Nahabedian, Viñas and Negri2004; Kehayias, Reference Kehayias2004; Xu & Chen, Reference Xu and Chen2005; Yin et al., Reference Yin, Chen, Zhang, Huang and Li2006); and some are mainly confined in the Arctic and temperate waters, for example S. elegans (e.g. Sherman & Schaner, Reference Sherman and Schaner1968; Tiselius & Peterson, Reference Tiselius and Peterson1986; Terazaki, Reference Terazaki1998; Choe & Deibel, Reference Choe and Deibel2000; Fulmer & Bollens, Reference Fulmer and Bollens2005). Apparently the variation in distribution patterns is related to temperature, as well as other hydrographic factors, such as salinity. Generally, studies on temperature or salinity tolerance of zooplankton species should address three questions: temperature or salinity range of zooplankton distribution; optimal temperature or salinity for zooplankton; and how the zooplankton population responds to temperature or salinity fluctuation, i.e. the effect of suboptimal temperature or salinity on population density.
Although the dependence of zooplankton distribution on temperature and salinity, including chaetognaths (O'Brien, Reference O'Brien1977; Tiselius & Peterson, Reference Tiselius and Peterson1986), is well known, previous studies are mostly qualitative descriptions based on the relationship between abundance and temperature or salinity (i.e. scatterplot between abundance and temperature or salinity); the traditional protocol can only be used for addressing temperature or salinity range of zooplankton distribution. Usually the temperature and salinity at which zooplankton abundance peaks occur can be used to represent the optimal temperature and salinity of zooplankton. Quantitative analysis, especially in determining optimal temperature and salinity for marine organisms, is still a challenge because suitable mathematical models have not been found to present the relationship between abundance and temperature or salinity. Recently, we determined successfully the optimal temperature and salinity for four Appendicularia species using a reciprocal quadratic yield-density model based on survey data (Xu & Zhang, Reference Xu and Zhang2010). The yield-density model was selected because the function has an extreme value (i.e. peak value) in quadrant I (the positive quadrants of the ordinate axes), as required by the present study. In this study, we described temperature- or salinity-related distribution of chaetognaths in the East China Sea, and used the yield-density model to define the relationship between observed abundance and temperature or salinity (measured in psu) to determine the optimal temperature or salinity for major species in Chaetognatha. Ecological characteristics of the chaetognaths in the East China Sea were analysed qualitatively and quantitatively based on the models as well.
MATERIALS AND METHODS
Study area and sampling method
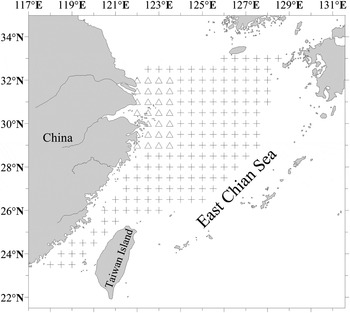
The data were collected in waters of 23°30′–33°00′N 118°30′–128°00′E in the East China Sea (Figure 1). Four surveys were conducted at 143 stations in the autumn of 1997 (from October to November), the spring of 1998 (from March to May), the summer of 1999 (from June to August), and the winter of 2000 (from January to February, except for the Taiwan Strait due to an incident). Because Sagitta nagae and S. bedoti are mainly distributed in nearshore waters (Xu & Chen, Reference Xu and Chen2005), additional surveys at 28 stations were conducted in May, August, and November of 2002, and March of 2003 in waters of 29°00′–32°00′N 122°00′–123°30′E (Figure 1) to get a more complete distribution profile for the two species in the East China Sea. Bottom depths of the sampling sites are 40–200 m, mostly 50–100 m.
Map of study location and sampling stations. +, stations for surveys during 1997–2000; △, stations for surveys in 2002 and 2003.

In total, 411 samples were collected during those surveys. For chaetognath sampling, standard plankton net with 80 cm diameter mouth and 505 µm mesh was hauled vertically from the bottom to the surface. The volume of water filtered was measured with a flowmeter mounted at the net mouth. The samples were immediately preserved in 5% buffered formalin. Surface temperature and salinity were recorded with SBE-19 CTD at every sampling site. Water stratification rarely occurs in the sampling area. Surface (10 m depth) temperature or salinity was used for modelling because zooplankton, including chaetognaths, is mainly present in surface waters in the East China Sea (Xu et al., Reference Xu, Wang, Chen, Hu, Han and Li1995, Reference Xu, Chao and Chen2004). Chaetognath samples were brought to the laboratory and identified and enumerated using a stereomicroscope. Species identifications were determined according to the guide in Mitsuo & Masaaki (Reference Mitsuo and Masaaki1997).
Modelling
Here we present abundance (A, simplified as abundance hereafter) as ind.m−3. The relationship between chaetognath abundance and temperature or salinity was based on a yield-density model that was developed to account for yield-density relations in crops (Holliday, Reference Holliday1960). This reciprocal quadratic model is expressed as
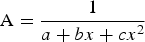
where, A is abundance and x represents temperature or salinity. Parameters a, b and c are identified following the Marquardt method (Marquardt, Reference Marquardt1963; SAS Institute, 1996), a method of non-linear regression analysis (curve fitting), using the observed abundance and temperature or salinity. The optimal temperature or salinity is the x value at which A is maximized. To maximize A, its derivative A' was determined from Equation 1:
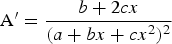
According to Rolle's theorem, A reaches the maximum when A′ = 0 (Silverman, Reference Silverman2003). When A′ = 0, Equation 2 can be simplified as
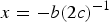
Optimal temperature (or salinity) can be calculated from the function x = –b(2c)−1 if b and c are known. For detailed calculations, principles and processes see Christensen (Reference Christensen1996).
Definite integrals were used to evaluate abundance of individual species between optimum –1 and optimum +1 (AOP) of temperature or salinity and total abundance (TA) as follows:
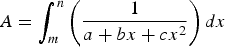
where A is abundance, m is low limit and n is upper limit. For evaluating AOP, m and n are optimum –1 and optimum +1 of temperature or salinity, respectively. TA was calculated using the two ends of the distribution range of temperature or salinity as the lower and upper limits. AOP may reflect sensitivity of chaetognaths to temperature or salinity, hence we could identify their ecological characteristics with the relative abundance (A%) that refers to the percentage AOP of an individual species relative to total chaetognath abundance (A% = (AOP/TA) ×100).
RESULTS
Seasonal and spatial distribution
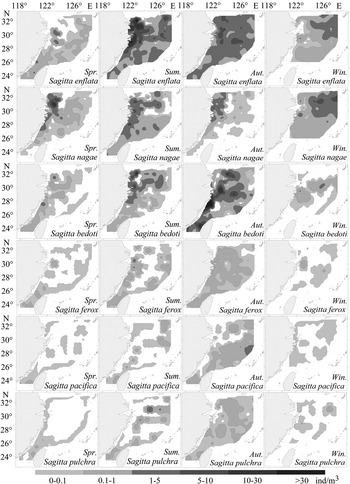
Six major chaetognath species were identified in the East China Sea. Of the six species, Sagitta enflata, S. nagae and S. bedoti, the first three most dominant and frequent species, were distributed throughout the surveyed area, and S. ferox, S. pacifica and S. pulchra were sub-dominant species (Table 1; Figure 2).
Seasonal horizontal distribution of abundance of six Chaetognatha species in the East China Sea during four seasons, each sampled once during one cruise between 1997 and 2000. Note that surveys were not completed in winter in the Taiwan Strait.

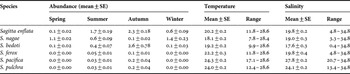
Mean abundance (ind.m−3) of chaetognath species, surface temperature (°C) and salinity in the East China Sea during four seasons, each sampled once during one cruise in March–May 1998 (spring), June–August 1999 (summer), October–November 1997 (autumn) and January–February 2000 (winter).

SE, standard error.
Sagitta enflata, the most abundant and frequent species, presented the highest density in summer, followed by autumn, winter and spring (Table 1). In spring, it occurred in the entire study area. In summer, its greatest abundance occurred in nearshore waters (Figure 2).
Sagitta nagae was the second most abundant and frequent species (Table 1). It was distributed almost throughout the study area, and its highest mean abundance occurred in summer and winter. However, its highest regional density appeared in spring. It was more abundant in nearshore water in spring, summer and autumn than offshore water, but more in offshore water in winter (Figure 2).
Sagitta bedoti was the third most abundant and frequent species (Table 1). It was most frequent in autumn, and occurred at only a few stations in winter. In autumn, it was distributed almost throughout the study area. Generally, higher abundance was recorded in nearshore waters in summer and autumn rather than in offshore waters. However, abundance in some patches in offshore waters was similar to that in nearshore waters (Figure 2).
The remaining species, i.e. Sagitta ferox, S. pacifica and S. pulchra, had a patchy distribution in the study area, and mostly in offshore waters (Figure 2).
Temperature- and salinity-related distribution
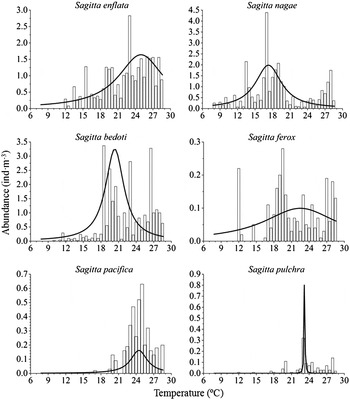
Sagitta enflata occurred at temperatures of 11.8–28.6°C and salinities of 4.8 to 34.8 (Table 1). It co-occurred most strongly with temperatures of 18–27°C, and was most abundant at about 23°C (Figure 3). Its highest abundance occurred at salinities of 31–34 (Figure 4).
Relationship between chaetognath abundance and sea surface temperature. The yield density model for each species is presented by the solid line.

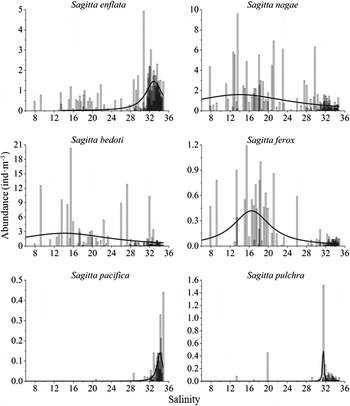
Relationship between chaetognath abundance and sea surface salinity. The yield density model for each species is presented by the solid line.

Sagitta nagae was recorded at temperatures of 7.8–28.4°C and salinities of 3.3–34.8 (Table 1). Sagitta nagae exhibited its highest abundance at a temperature of about 17°C (Figure 3). It was able to occur in a broad salinity range (Figure 4).
Sagitta bedoti occurred at temperatures of 9.9–28.6°C (Table 1), and was most abundant at 18.5–26.5°C (Figure 3). Sagitta bedoti inhabited water of the broadest salinity range (0.4–34.8), and was most abundant at salinities of 15–16 (Figure 4).
Sagitta ferox occurred at temperatures of 11.8–28.6°C (Table 1), and was most abundant at 19–20°C (Figure 3). It lived in water with salinities of 4.8–34.8, and was most abundant at 15–21 (Figure 4).
Sagitta pacifica occurred at temperatures of 17.1–28.6°C, and salinity ranges from 20.7–34.8 (Table 1). It preferred temperatures of 22.5–26°C (Figure 3). Its highest abundance appeared at salinities of 34–35 (Figure 4).
Sagitta pulchra was recorded at temperatures of 12.4–28.6°C, and salinities of 13.4–34.8 (Table 1). Its highest abundance occurred at a temperature of about 23°C (Figure 3) and ‘bloomed’ at a salinity of 31.5 (Figure 4).
Estimated optimal temperatures and salinities
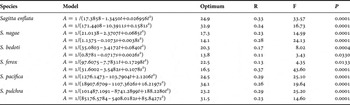
The yield-density model well estimated optimal temperatures and salinities for all species (all P < 0.05, Table 2; Figures 3 & 4). All estimated optimal temperatures and salinities fall in the observed ranges. Optimal temperature for Sagitta enflata (24.9°C) and S. pacifica (24.5°C) was the highest. It was lowest for S. nagae (17.3°C), and intermediate for S. bedoti (20.3°C), S. ferox (22.5°C) and S. pulchra (23.2°C) (Table 2). Optimal salinity for S. pacifica (34.1) was the highest. It was lower than 20 for S. bedoti (13.8), S. nagae (14.1) and S. ferox (16.5), and intermediate for S. enflata (32.9) and S. pulchra (31.5) (Table 2).
Yield-density models to present relationship between abundance (A) and temperature (t, °C) or salinity (s) and estimated optimal value for individual chaetognath species in the East China Sea, data collected during four seasons, each sampled once during one cruise in March–May 1998, June–August 1999, October–November 1997 and January–February 2000.

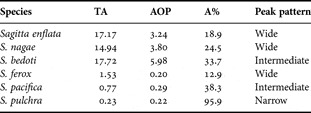
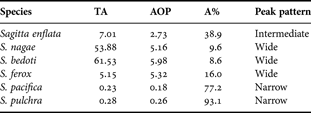
Three distinct curve patterns were identified according to the estimated abundance between optimum –1 and optimum +1 of temperature/salinity. Wide, narrow and intermediate peaks are defined according to the relative abundance, each of ≤30, ≥70, and between 30 and 70. For example, for species with a narrow curve peak, such as Sagitta pulchra, 95.9% of the individuals are distributed at temperatures of optimum ±1.0°C (Figure 3); for species with a wide curve peak, such as S. enflata, only 18.9% of individuals occur at temperatures of optimum ±1.0°C (Figure 3). According to the models, 95.9%, 38.3%, 33.7%, 24.5%, 18.9% and 12.9% of the individuals of S. pulchra, S. pacifica, S. bedoti, S. nagae, S. enflata and S. ferox occur at a temperature range of peak value ±1.0, respectively (Table 3), and 93.1%, 77.2%, 38.9%, 16.0%, 9.6% and 8.6% of individuals of S. pulchra, S. pacifica, S. enflata, S. ferox, S. nagae and S. bedoti occur at a salinity range of optimum ±1.0, respectively (Table 4). If the number of individuals of a species that occur at temperatures of optimum ±1.0°C is greater than that occurring at salinities of optimum ±1, it means that temperature is more important to affect distribution of the species, and vice versa.
Estimated abundance (ind.m−3) of chaetognath species in the East China Sea between optimum –1 and optimum +1 of temperature. See ‘Materials and Methods’ for detail about the evaluation process.

TA, total abundance; AOP, abundance between optimum –1 and optimum +1; A%, (AOP/OA) ×100.
Estimated abundance ((ind.m−3) of chaetognath species in the East China Sea between optimum –1 and optimum +1 of salinity. See ‘Materials and Methods’ for detail about the evaluation process.
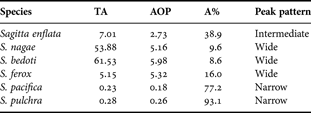
TA, overall abundance; AOP, abundance between optimum –1 and optimum +1; A%, (AOP/TA) ×100.
DISCUSSION
Traditionally, ecological characteristics of zooplankton are often determined by the relationship presented by using the data directly (i.e. scatter plots between abundance and temperature or salinity). However, it is not easy to describe the ecological characteristics precisely using this simple relationship (even if there may be a line fitting to the data), especially in determining optimal temperature and salinity for zooplankton, which only provides a range of temperatures or salinities. For example, species may be distributed in similar temperature- or salinity-ranges, however some species may aggregate at a narrow temperature- or salinity-range, and some species may be abundant in a wide temperature- or salinity-range. For the former, a range of optimal temperature or salinity is easy to identify, however it is hard to determine a range for the latter. In the present study, we resolve the problem with a yield-density model using six Chaetognatha species as cases. Previous studies have roughly recognized Sagitta bedoti and S. enflata, S. ferox, S. pacifica and S. pulchra as warm water species (e.g. Bieri, Reference Bieri1959; Terazaki, Reference Terazaki1992), and S. nagae as a neritic species (Terazaki, Reference Terazaki1992) or a mixed water (mixture of cold and warm water) species (Johnson et al., Reference Johnson, Nishikawa and Terazaki2006) based on most direct data of temperature and salinity related to their distributions, geographical distribution, and water masses inhabited. According to the present models, three ecological groups were evident in the East China Sea: the neritic, warm-temperate water species (Sagitta nagae); the neritic, warm water species (S. pulchra, S. ferox and S. bedoti); and the oceanic, warm water species (S. enflata and S. pacifica). Characterization of chaetognaths in the East China Sea agrees well with the observed data and the previous recognition, suggesting that the proposed model can be used to determine the relationship between abundance and temperature or salinity in chaetognaths. Although R 2 values are small (e.g. 0.01) for some cases, the low statistical correlations are still biologically meaningful with large number of data (Table 2).
Sagitta bedoti is recognized as a typical species of the Indo-Pacific warm neritic waters and is abundantly distributed in the Indo-Pacific (Bieri, Reference Bieri1959; Pierrot-Bults & Nair, Reference Pierrot-Bults, Nair, Bone, Kapp and Pierrot-Bults1991), such as in the western tropical Indian Ocean (Nair & Madhupratap, Reference Nair and Madhupratap1984), in a tidal creek of Sagar Island, Sunderbans, West Bengal (Sarkar et al., Reference Sarkar, Singh and Choudhury1985), in Bahía de Banderas, Mexico (Ruiz-Boijseauneau et al., Reference Ruiz-Boijseauneau, Sanvicente-Añorve and Álamo2004), and in the Pearl River estuary, China (Li et al., Reference Li, Yin, Huang and Song2009). Estimated optimal temperature (20.3°C) and salinity (13.8) in combination with curve pattern (intermediate for temperature curve, and wide for salinity curve) for S. bedoti in the East China Sea suggest that the species supports the previous conclusion (Pierrot-Bults & Nair, Reference Pierrot-Bults, Nair, Ormond, Gage and Angel1997). Sagitta bedoti prefers lower salinity (optimal salinity of 13.8), and temperature seems more important than salinity to affect its distribution (Tables 3 & 4).
Sagitta enflata has been characterized as a warm-water species, or an oceanic or semi-neritic species (McLelland, Reference McLelland1989); globally it is distributed in waters worldwide between 45°N and 40°S (Bieri, Reference Bieri1959; Pierrot-Bults & Nair, Reference Pierrot-Bults, Nair, Ormond, Gage and Angel1997). Hence, it is also recognized as a eurythermal and euryhaline species due to its occurrence in environments with great temperature and salinity variations (e.g. Almeida Prado, Reference Almeida Prado1961; McLelland, Reference McLelland1989). It has been found in both temperate waters, such as in the lower Chesapeake Bay, USA (Grant, Reference Grant1977), the western North Atlantic (Pierrot-Bults, Reference Pierrot-Bults1982; Cheney, Reference Cheney1985), and in the Bay of Fundy, Canada (Hurley et al., Reference Hurley, Corey and Iles1983), and tropical waters, such as in the western tropical Indian Ocean (Nair & Madhupratap, Reference Nair and Madhupratap1984), in a tidal creek of Sagar Island, Sunderbans, West Bengal (Sarkar et al., Reference Sarkar, Singh and Choudhury1985), and in the Guanabara Bay, Brazil (Marazzo & Nogueira, Reference Marazzo and Nogueira1996). Its distribution in the East China Sea mostly supports the previous recognition. Estimated optimal temperature (24.9°C) and salinity (32.9) for S. enflata indicate that it is an oceanic warm-water species, not a semi-neritic species as McLelland (Reference McLelland1989) suggested. It might be brought into neritic environments occasionally by currents. Moreover, the curve pattern of the yield-density model for the species also implies that S. enflata is a eurythermal species (wide curve peak), however, it may not be a euryhaline species (intermediate curve peak).
Sagitta ferox is characterized as a species associated with warm-water masses (Bieri, Reference Bieri1959), such as in Toyama Bay, the southern Japan Sea (Terazaki, Reference Terazaki1993), in the Celebes and Sulu Seas (Johnson et al., Reference Johnson, Nishikawa and Terazaki2006), and in the Pearl River estuary, China (Li et al., Reference Li, Yin, Huang and Song2009). Recognition resulting from the yield-density model (optimal temperature: 22.5°C, optimal salinity: 16.5; both temperature and salinity curves are wide) indicates that S. ferox is a semi-neritic warm-water species. Moreover, it is a eurythermal and euryhaline species.
Sagitta pacifica is distributed in the Indo-Pacific from 40°N–40°S (Pierrot-Bults & Nair, Reference Pierrot-Bults, Nair, Ormond, Gage and Angel1997). It is reported mainly from equatorial waters (Bieri, Reference Bieri1959), such as in the western tropical Indian Ocean (Nair & Madhupratap, Reference Nair and Madhupratap1984), in Bahía de Banderas, Mexico (Ruiz-Boijseauneau et al., Reference Ruiz-Boijseauneau, Sanvicente-Añorve and Álamo2004), and in Pearl River estuary, China (Li et al., Reference Li, Yin, Huang and Song2009). According to results of the yield-density model (optimal temperature: 24.5°C, optimal salinity: 34.1; intermediate temperature curve and narrow salinity curve), S. pacifica is an oceanic warm-water species. Salinity is more restrictive than temperature in distribution of the species.
Sagitta pulchra mainly occurs in equatorial waters (Bieri, Reference Bieri1959), such as in the western tropical Indian Ocean (Nair & Madhupratap, Reference Nair and Madhupratap1984), and in the Pearl River estuary, China (Li et al., Reference Li, Yin, Huang and Song2009). Results from the yield-density model (optimal temperature: 23.2°C, optimal salinity: 31.5; both temperature and salinity curves are narrow) suggest that S. pulchra is an oceanic warm-water species as recorded usually in the literature. This species is sensitive to fluctuations of both temperature and salinity.
Sagitta nagae is mainly present in neritic temperate waters of Japan (e.g. Terazaki, Reference Terazaki1992) and China (e.g. Xu & Chen, Reference Xu and Chen2005). Results from the yield-density model (optimal temperature: 17.3°C, optimal salinity: 14.1; both temperature and salinity curves are wide) suggest that S. nagae is a neritic temperate water species.
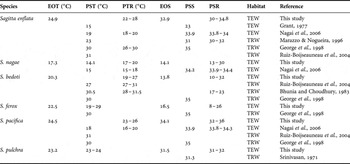
In the previous study, we used the yield-density model to estimate optimal temperature or salinity from abundance with four appendicularians (Xu & Zhang, Reference Xu and Zhang2010). In the present study, applicability of the model in determining optimal temperature or salinity of zooplankton was further validated. This study provides a simple and informative alternative method to characterize zooplankton quantitatively and qualitatively. However, the relationship may need to be remodelled for individual species in different geographical locations because optimal temperature or salinity for chaetognaths may be different at different physical and biological environments (Table 5). For example, the temperature at which peak abundance occurs for Sagitta enflata in temperate waters (15°C in the Chesapeake Bay, Grant, Reference Grant1977; 19°C in the Japan Sea, Nagai et al., Reference Nagai, Tadokoro, Kuroda and Sugimoto2006) is lower than that in tropical waters (30°C on south-west coast of India, George et al., Reference George, Thomas, Jasmine, Nair and Vasanthakumar1998) (Table 5).
Comparison between estimated optimal temperature (EOT) and salinity (EOS) in the East China Sea and published surface temperature (PST) and salinity (PSS), and published temperature and salinity range (PTR and PSR) associated with peak abundance for each species elsewhere.

TEW, temperate waters; TRW, tropical waters.
Although copepod abundance has been recognized as a key factor influencing spatial and temporal distribution of chaetognaths in some waters (Sun, Reference Sun1989; Marazzo & Nogueira, Reference Marazzo and Nogueira1996), it seems there is no close relationship between the distributions of copepods and chaetognaths in the East China Sea (Xu et al., Reference Xu, Jiang and Chao2003). Additionally, patterns of spatial and temporal distribution of the six species are not consistent, suggesting that food may not affect significantly their distribution in the East China Sea. Therefore food might not be a factor causing bias models in the present study, i.e. salinity tolerance characterizes oceanic species, and temperature is important for general distribution. It would be interesting to determine the effect of food on the distribution of chaetognaths in the East China Sea and on the models.
ACKNOWLEDGEMENTS
We thank Qian Gao and Jiajie Chen for data analysis, and Xiaomin Shen gave his valuable comments in the preparation of the earlier draft manuscript.