Introduction
The Canadian Prairies Ecozone is the largest agricultural region in Canada, with an area of 32 million hectares suitable for production of annual crops (Ecological Framework of Canada 2021), including two primary field crops, wheat, Triticum aestivum Linnaeus (Poaceae), and canola, Brassica napus Linnaeus (Brassicaceae) (Campbell et al. Reference Campbell, Zentner, Gameda, Blomert and Wall2002). Canola and wheat have recent average annual values of $CAD 9.3 billion and $CAD 7.4 billion, respectively, with a combined harvested area of about 18 million hectares in western Canada (Alberta Agriculture and Forestry 2020; Agriculture and Agri-Food Canada 2021). The prairie climate is described as continental, associated with low annual precipitation and extremes in precipitation and temperature (McGinn Reference McGinn, Shorthouse and Floate2010). Continental climates also experience significant seasonal and annual weather fluctuations (i.e., distinct summer and winter seasons). Insects, weeds, and plant pathogens can have significant impacts on crop productivity (Oerke Reference Oerke2006) and are sources of risk to crop production. Many insect species associated with agricultural ecosystems have been shown to respond to climate with changes in their distribution and relative abundance (Olfert and Weiss Reference Olfert and Weiss2006a; Mika et al. Reference Mika, Weiss, Olfert, Hallett and Newman2008; Olfert et al. Reference Olfert, Weiss and Kriticos2011, Reference Olfert, Weiss, Cárcamo and Meers2012a, Reference Olfert, Weiss, Turkington, Beckie and Kriticos2012b; Haye et al. Reference Haye, Olfert, Weiss, Gariepy, Broadbent and Kuhlmann2013). As a result, risk to crop productivity often varies between years, as abiotic conditions influence insect population ecology and, as a result, the number (and population densities) of insect species attacking field crops.
Bioclimatic simulation models are tools that predict the potential geographic distribution and the potential success of insect establishment in ecosystems based on climate (Kriticos et al. Reference Kriticos, Maywald, Yonow, Zurcher, Herrmann and Sutherst2015). CLIMEX® software is used to derive an ecoclimatic index that ranges from zero to 100 and is used to define the climatic suitability of specific locations for survival and reproduction of the species being studied (Kriticos et al. Reference Kriticos, Maywald, Yonow, Zurcher, Herrmann and Sutherst2015). The suitability of a given geographic location for survival of a given species increases as the ecoclimatic index value increases; thus, ecoclimatic index values also provide an indirect estimate of relative abundance, where abundance increases with increasing ecoclimatic index values (Kriticos et al. Reference Kriticos, Maywald, Yonow, Zurcher, Herrmann and Sutherst2015). The bioclimatic modelling process integrates the weekly responses of a given species to climate using a series of climate-related indices and model parameters that describe the response of the species to temperature, light, moisture, and stress (heat, cold, wet, and dry; Kriticos et al. Reference Kriticos, Maywald, Yonow, Zurcher, Herrmann and Sutherst2015).
Bioclimatic simulation models have been used to predict the distribution and relative abundance of insect pests of annual crops. Models have been published for insect pests of wheat, including wheat midge, Sitodiplosis mosellana Géhin (Diptera: Cecidomyiidae) (Olfert et al. Reference Olfert, Weiss and Elliott2016), cereal leaf beetle, Oulema melanopus Linnaeus (Coleoptera: Chrysomelidae) (Olfert et al. Reference Olfert, Weiss, Woods, Philip and Dosdall2004), and wheat stem sawfly, Cephus cinctus Norton (Hymenoptera: Cephidae) (Olfert et al. Reference Olfert, Weiss, Catton, Carcamo and Meers2019). Models have also been published for insect pests of canola, including swede midge, Contarinia nasturtii Kieffer (Diptera: Cecidomyiidae) (Olfert et al. Reference Olfert and Weiss2006), cabbage seedpod weevil, Ceutorhynchus obstrictus (Marsham) (Coleoptera: Curculionidae) (Dosdall et al. Reference Dosdall, Weiss, Olfert and Carcamo2002; Olfert and Weiss Reference Olfert and Weiss2006a), pollen beetle, Brassicogethes viridescens (Fabricius) (Coleoptera: Nitidulidae) [formerly Meligethes viridescens] (Mason et al. Reference Mason, Olfert, Sluchinski, Weiss, Boudrealt, Grossrieder and Kuhlmann2003; Olfert and Weiss Reference Olfert and Weiss2006a), and crucifer and striped flea beetles, Phyllotreta cruciferae (Goeze) and P. striolata (Fabricius) (Coleoptera: Chrysomelidae) (Olfert et al. Reference Olfert, Weiss, Soroka and Elliott2018). A bioclimatic model is also available for the migratory grasshopper, Melanoplus sanguinipes (Fabricius) (Orthoptera: Acrididae) (Olfert and Weiss Reference Olfert and Weiss2006b), a pest of both cereal and oilseed crops. These bioclimatic models were developed and reported for individual species because species do not interact directly with one another in the species distribution modelling framework. Where bioclimatic model research papers have reported on multiple species simultaneously (e.g., insects, weeds, and pathogens), the predictions were generated using species-specific models (Olfert and Weiss Reference Olfert and Weiss2006a; Olfert et al. Reference Olfert, Weiss, Turkington, Beckie and Kriticos2012b).
The central aim of the present study was to develop a system to predict how crop-related insect species complexes respond to abiotic conditions for the two primary crops (wheat and canola) grown in western Canada. The project was developed because farmers grow multiple crops in a given year, and each crop can be associated with more than one insect pest. Pest complexes vary temporally, spatially, and by crop, requiring farmers to scout and manage the effects of multiple pests in a single growing season. Our regional approach was developed in an attempt to study how spatial distribution and abundance vary for multiple pest species of wheat and canola crops.
The first objective of this study was to develop a methodology to estimate risk associated with multiple major insect pests of wheat and canola. To meet this objective, we used data from published bioclimatic models for four insect pests of wheat and six insect pests of canola (listed above). Species-specific ecoclimatic index values from the existing bioclimatic models were chosen to represent insect densities that correspond to an economic risk to the two host crops. These values were used to calculate risk to each commodity across their geographic expanse. By developing methodology to estimate seasonal risk to wheat and canola, we will be able to uniquely use the output from bioclimatic models to inform western Canadian farmers and industry stakeholders of insect-related risks to crop production using visual outputs, including maps.
Our second objective was to determine if the risk calculation developed in the first objective could be used to estimate pest-related risk to crop production associated with multiple insect species in response to variation in growing season temperature and precipitation across the prairies. Here, we used incremental sensitivity studies to observe insect response to incremental changes in temperature and rainfall, relative to long-term climate normals, to analyse species response to potential changes in weather and climate (Taylor and Kumar Reference Taylor and Kumar2012). The incremental approach permits comparisons between species for similar climates and geographic regions. Although similar incremental values are used, each species can respond differently. For example, wheat midge is more sensitive to changes in precipitation than to changes in temperature (Basedow Reference Basedow1977), and the two flea beetle species, P. cruciferae and P. striolata, exhibit species-specific responses to temperature (Olfert et al. Reference Olfert, Weiss, Cárcamo and Meers2012a, Reference Olfert, Weiss, Soroka and Elliott2018). Assessing the validity of risk estimates that incorporate multiple pest species per commodity and their individual responses to incremental changes in temperature and precipitation is a precursor to using this methodology to make predictions associated with the effects of climate change.
Methods
Estimating risk associated with multiple insect species
The bioclimatic modelling process integrates the weekly responses of a population of a given species to climate conditions using a series of annual climate-related indices, as previously described (e.g., Olfert et al. Reference Olfert, Weiss, Soroka and Elliott2018, Reference Olfert, Weiss, Catton, Carcamo and Meers2019). The location-specific ecoclimatic index values generated by the modelling software range from 0 to 100 and are a measure of the suitability of a given location for survival and population growth of the species being studied (Sutherst Reference Sutherst, Mooney and Hobbs2000). Previously published models reported ecoclimatic index values for important pests of wheat and canola to describe their distribution and relative abundances (Olfert et al. Reference Olfert, Weiss and Kriticos2011, Reference Olfert, Weiss, Cárcamo and Meers2012a). Here, ecoclimatic index values from previously reported models were selected to indicate areas where host crops are at risk from each species. The ecoclimatic index value selected for M. sanguinipes (ecoclimatic index = 20), for example, is based on the fact that values greater than 20 are correlated with regions that have historically reported crop damage (Olfert and Chapco Reference Olfert, Chapco and Thomas2001; Olfert and Weiss Reference Olfert and Weiss2006b). Following similar logic, we used an ecoclimatic index value of 15 to indicate areas at risk from S. mosellana because the economic threshold for S. mosellana is 1200 cocoons/m2 and the species distribution model for S. mosellana showed that populations exceeded the economic threshold where ecoclimatic index (EI) values exceeded 15 (Olfert et al. Reference Olfert, Weiss and Elliott2016). Based on historical insect monitoring data, observed and modelled output, and published knowledge, we defined threshold ecoclimatic index values to represent crop risk for the remaining species: C. cinctus (EI = 15), O. melanopus (EI = 20), C. obstrictus (EI = 20), B. viridescens (EI = 24), C. nasturtii (EI = 20), and P. cruciferae and P. striolata (EI = 20; Dosdall et al. Reference Dosdall, Weiss, Olfert and Carcamo2002; Mason et al. Reference Mason, Olfert, Sluchinski, Weiss, Boudrealt, Grossrieder and Kuhlmann2003; Olfert et al. Reference Olfert, Weiss, Woods, Philip and Dosdall2004, Reference Olfert, Hallett, Weiss, Soroka and Goodfellow2006, Reference Olfert, Weiss, Elliott and Soroka2017, Reference Olfert, Weiss, Catton, Carcamo and Meers2019; Olfert and Weiss Reference Olfert and Weiss2006a).
After establishing threshold ecoclimatic index values to represent pest status, CLIMEX® software was used to conduct model runs for four insect pests of wheat (M. sanguinipes, S. mosellana, C. cinctus, and O. melanopus) and for six insect pests of canola (P. cruciferae, P. striolata, C. nasturtii, C. obstrictus, B. viridescens, and M. sanguinipes) to generate ecoclimatic index values for risk calculations. The models were run for the extent of the growing area of the Canadian Prairies Ecozone and used climate data inputs obtained from the CliMond 10 spatial resolution climate data set (Kriticos et al. Reference Kriticos, Webber, Leriche, Ota, Macadam, Bathols and Scott2012). This 0.1° gridded data set includes a hybrid historical data set representing the current global climate, CRU CL2.0, and WorldClim1975 that was developed by the Climate Research Unit (CRU) at the University of East Anglia, Norwich, United Kingdom; please refer to Kriticos et al. (Reference Kriticos, Webber, Leriche, Ota, Macadam, Bathols and Scott2012) for additional details about the climate data set. In brief, the data set consists of measures of maximum temperature, minimum temperature, precipitation, and relative humidity for thousands of locations, including western Canada, the focus of the present study.
For each species, we used the output generated by running the bioclimatic models to assign a pest risk value for each 0.1° grid cell across the agricultural area in western Canada for current climate conditions. Risk from a species either exists (EI value ≥ the thresholds defined above = 1) or it does not (EI value < the threshold value defined above = 0). In each grid cell, we summed the pest risk values (0 or 1) to calculate overall pest risk, where values ranged between 0 and 4 for wheat and between 0 and 6 for canola. The greater the risk value, the more insect species there are that could impact crop yield in a given growing season at a given location. Map surfaces, based on pest risk values, were developed to present risk to wheat and canola in current climate conditions. Surface maps were constrained by limiting model outputs to the agroecological (agricultural) resource areas for the Canadian prairies defined by Kirkwood et al. (Reference Kirkwood, Bootsma, de Jong, Dumanski, Hiley and Huffman1993) where conditions are suitable for production of the host crops (Kirkwood et al. Reference Kirkwood, Bootsma, de Jong, Dumanski, Hiley and Huffman1993; Olfert et al. Reference Olfert, Weiss, Elliott and Soroka2017).
Insect risk in response to incremental climate scenarios
The ecological sensitivity of each species and of the risk estimates to changes in temperature and precipitation was determined by conducting incremental sensitivity analyses. For incremental sensitivity analyses, the climate data sets were amended by increasing or decreasing precipitation (± 40% precipitation of the climate normal value for each grid cell) and temperature (± 2° C of the climate normal for each grid cell), such that model runs were conducted for the current climate and six scenarios: warmer climate, cooler climate, drier climate, wetter climate, warmer and drier climate, and cooler and wetter climate. These scenarios have been used to conduct similar sensitivity analyses for individual pest species in western Canada (and elsewhere; e.g., Olfert and Weiss Reference Olfert and Weiss2006b). Modified climate data sets were used to generate ecoclimatic index values representing the response of each of the nine species to the incremental scenarios. Using the same ecoclimatic index thresholds and the calculation process described above, pest risk was calculated for each 0.1° grid cell across the agricultural area in western Canada. Results were mapped following the process described for the current climate data.
To facilitate location-specific comparison of risk in the seven climate scenarios (current climate and six incremental scenarios), risk was calculated at seven locations across the prairies: Edmonton (53.19° N, 113.35° W), Lethbridge (49.69° N, 112.83° W), and Peace River (56.23° N, 117.30° W) in Alberta, Canada; Regina (50.26° N, 104.40° W), Saskatoon (52.14° N, 106.65° W), and Swift Current (50.16° N, 107.44° W) in Saskatchewan, Canada; and Winnipeg (49.89° N, 97.14° W) in Manitoba, Canada. At each location, we used a geographic rectangle, 1° latitude × 1° longitude, to delineate the area around each location, consisting of 36 0.1° grid cells. At each location, we calculated the percent risk of insect effects on crop yield for wheat using the following equation:
 $$\begin{align*}{\text{Percent risk = (}}{x_{{\text{grasshopper}}}}{\text{/36) + (}}x{{\text{ }}_{{\text{cereal leaf beetle}}}}{\text{/36) + (}}x{{\text{ }}_{{\text{wheat midge}}}}{\text{/36) }} \cr&\!\!\!\!\!\!\!\!\!\!\!\!\!\!\!\!\!\!\!\!\!\!\!\!\!\!\!\!\!\!\!\!\!\!\!\!\!\!\!\!\!\!\!\!\!\!\!\!\!\!\!\!\!\!\!\!\!\!\!\!\!\!\!\!\!\!\!\!\!\!\!\!\!\!\!\!\!\!\!\!\!\!\!\!\!\!\!\!\!\!\!\!\!\!\!\!\!\!\!\!\!\!\!\!\!\!\!\!\!\!\!\!\!\!\!\!\!\!\!\!\!\!\!\!\!\!\!\!\!\!\!\!\!\!\!\!\!\!\!\!\!\!\!\!\!\!\!\!\!\!\!\!\!\!\!\!\!{\text{ + (}}x{{\text{ }}_{{\text{wheat stem sawfly}}}}{\text{/36)}} \cr&\!\!\!\!\!\!\!\!\!\!\!\!\!\!\!\!\!\!\!\!\!\!\!\!\!\!\!\!\!\!\!\!\!\!\!\!\!\!\!\!\!\!\!\!\!\!\!\!\!\!\!\!\!\!\!\!\!\!\!\!\!\!\!\!\!\!\!\!\!\!\!\!\!\!\!\!\!\!\!\!\!\!\!\!\!\!\!\!\!\!\!\!\!\!\!\!\!\!\!\!\!\!\!\!\!\!\!\!\!\!\!\!\!\!\!\!\!\!\!\!\!\!\!\!\!\!\!\!\!\!\!\!\!\!\!\!\!\!\!\!\!\!\!\!\!\!\!\!\!\!\!\!\!\!\!\!{\text{ = (}}x{{\text{ }}_{{\text{grasshopper}}}}{\text{ + }}x{{\text{ }}_{{\text{cereal leaf beetle}}}}{\text{ + }}x{{\text{ }}_{{\text{wheat midge}}}}{\text{ + }}x{{\text{ }}_{{\text{wheat stem sawfly}}}}{\text{)/144}}\end{align*}$$
where x represents the number of 36 possible grid cells for each species where pest risk equals 1. The same equation was used to calculate percent risk for canola, except the denominator in the canola equation was 216 instead of 144 because two additional pest species were included for canola (36 × six insect species = 216) than were included for wheat (36 × four insect species = 144).
Results
Estimating risk associated with multiple insect species
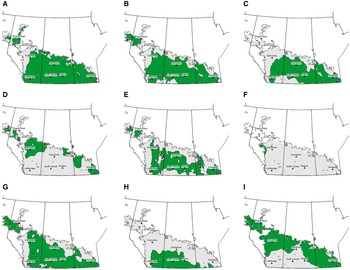
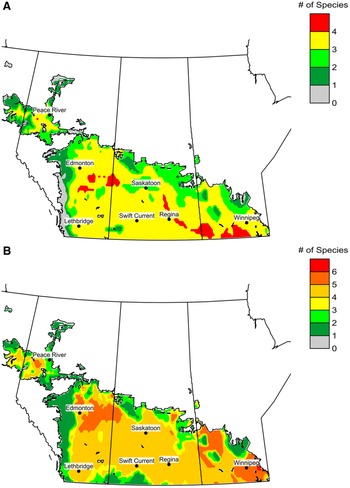
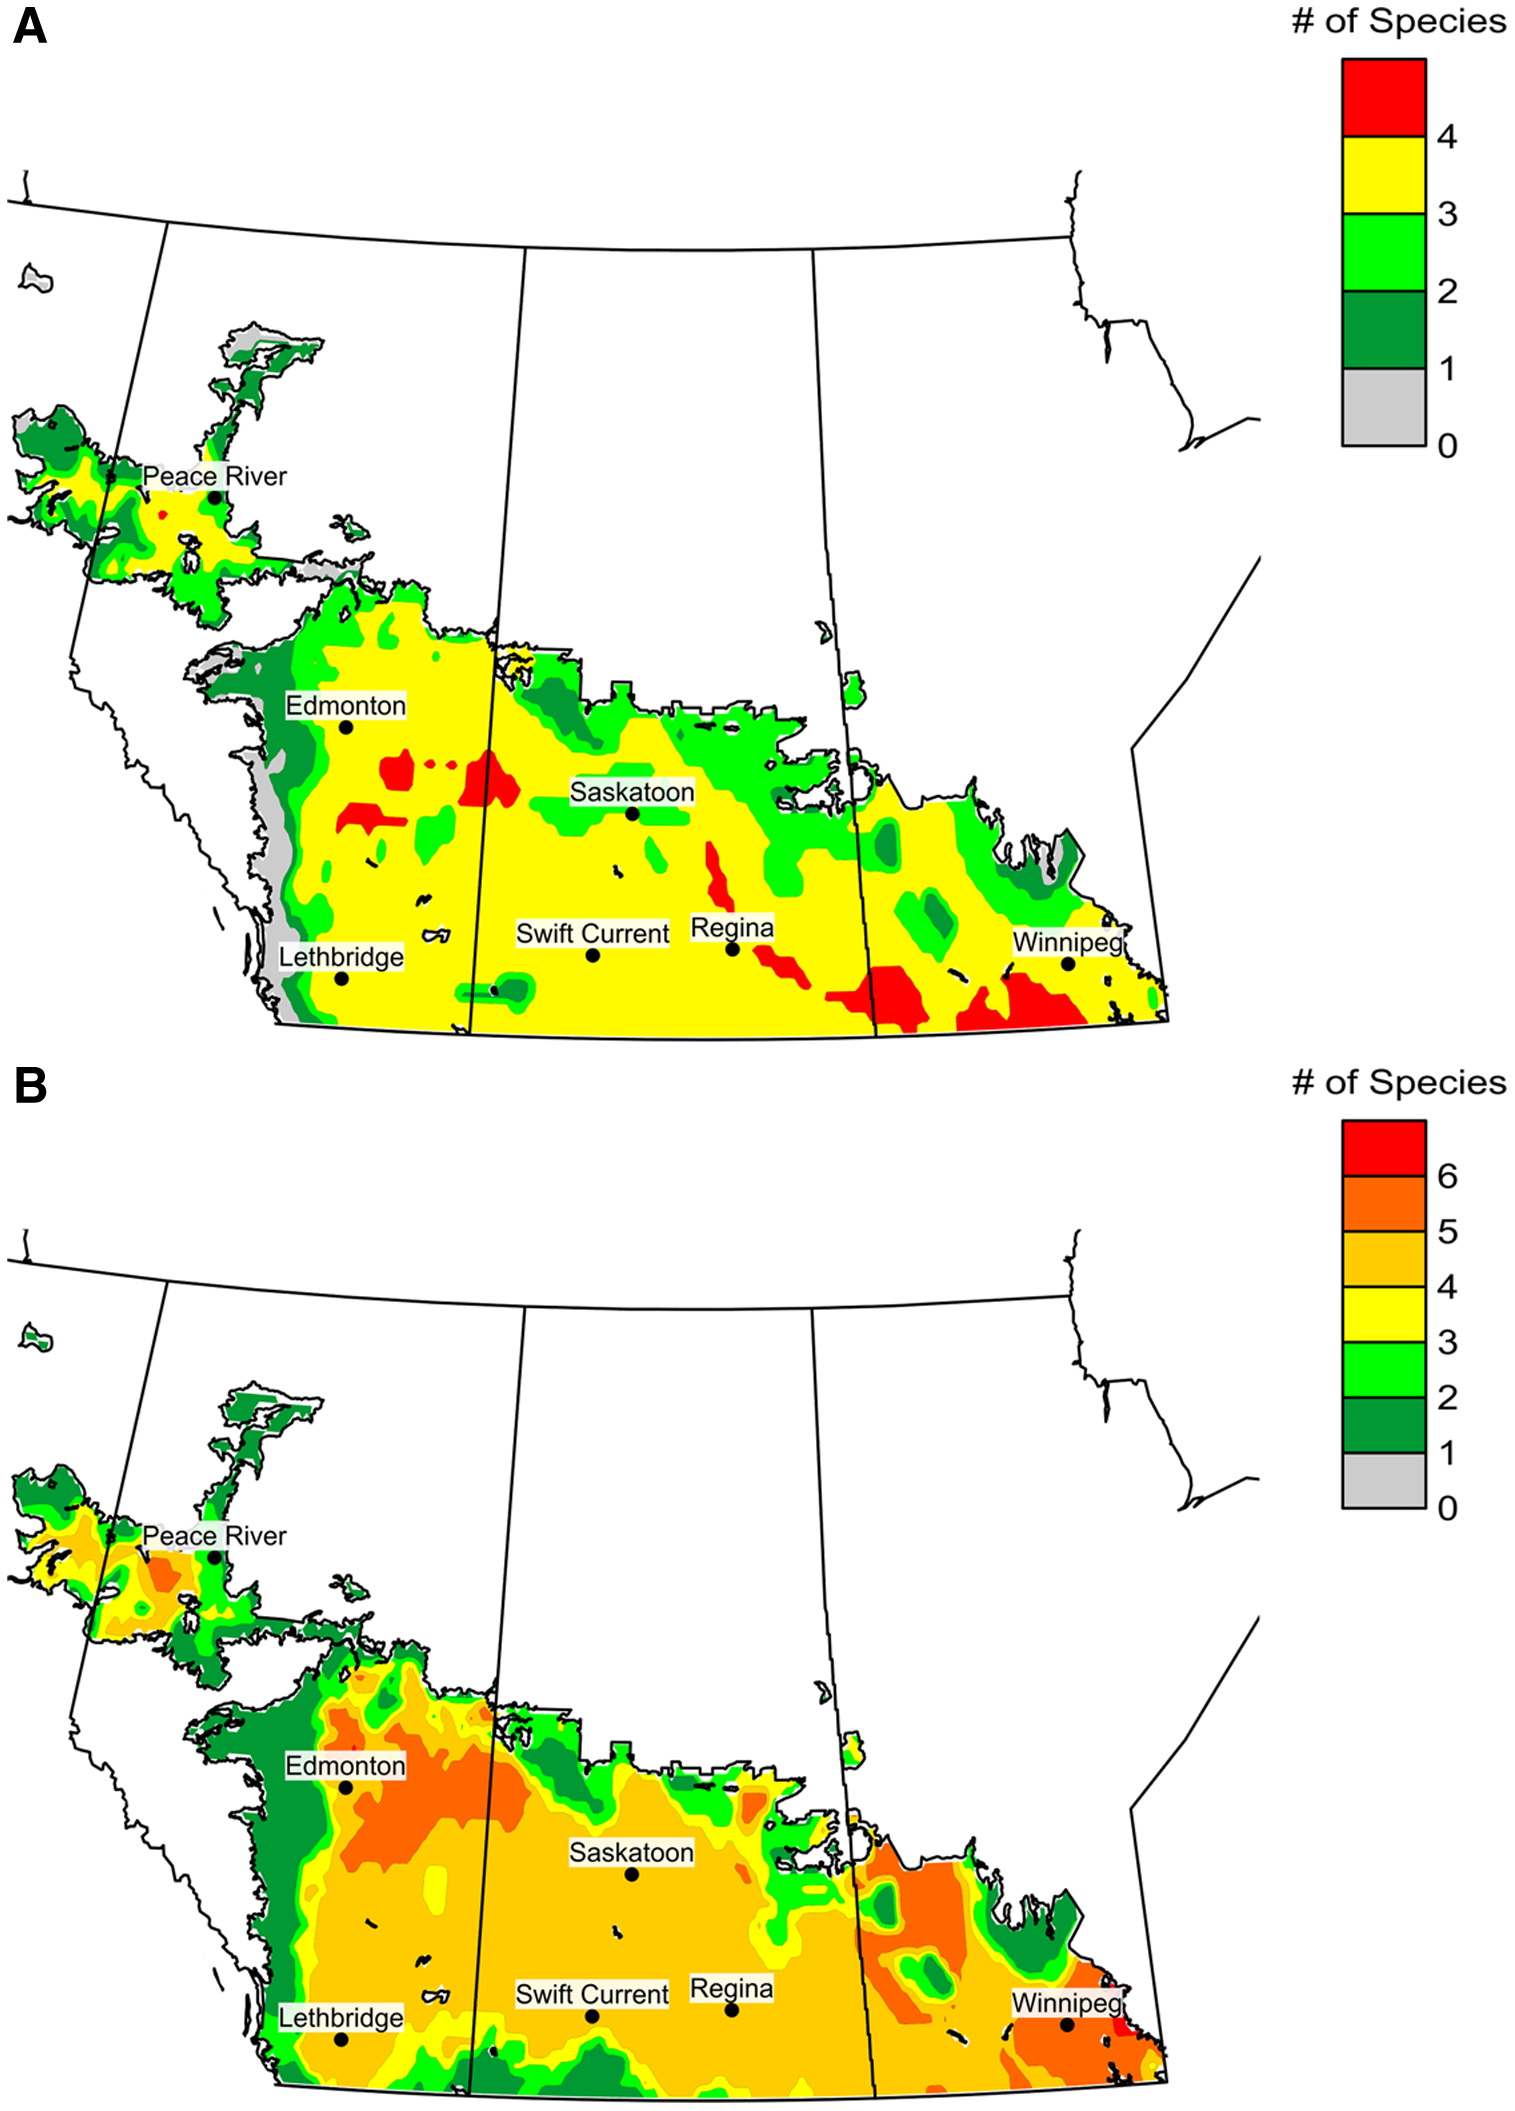
Ecoclimatic index thresholds were established to define insect-associated risk to canola and wheat crops across the agricultural area of the Canadian prairies in current climate conditions (Fig. 1). We used outputs from existing and published bioclimatic models to estimate the cumulative growing season risk of insect damage to wheat and to canola in western Canada (Fig. 2). Reducing the complexity of species-specific ecoclimatic index values to “pest” and “not a pest” permitted us to use a binary system to calculate risk estimates encompassing insect pest complexes. Although bioclimatic models are highly species-specific, we have demonstrated that their outputs can be standardised across species using the methods applied here to represent risk to crops associated with multiple insect pest species.
Predicted distribution of insect species associated with economic risk to canola and wheat under current climate conditions, where grey areas represent the agricultural resource area of the prairies (defined by Kirkwood et al. Reference Kirkwood, Bootsma, de Jong, Dumanski, Hiley and Huffman1993) and green areas represent the distribution of: A, Melanoplus sanguinipes, B, Ceutorhynchus obstrictus, C, Phyllotreta cruciferae, D, Phyllotreta striolata, E, Brassicogethes viridescens, F, Contarinia nasturtii, G, Oulema melanopus, H, Cephus cinctus, and I, Sitodiplosis mosellana.

The number of concurrent insect pest species that could occur in a growing season based on current climate (defined by the 30-year climate normal centred on 1975) for A, wheat and B, canola field crops.
Insect risk in response to incremental climate scenarios
Current climate
Risk associated with each of the nine insect species in current climate conditions is represented visually in Figure 1. Risk associated with M. sanguinipes, O. melanopus, and C. obstrictus is most widespread (Fig. 1A, B, G). Although the distribution of P. cruciferae and P. striolata overlaps in some regions, their overall distribution differs due to species-specific responses to growing season temperature and moisture (Fig. 1C, D). Cephus cinctus risk is expected to occur across the southern prairies (Fig. 1H), and wheat midge, S. mosellana, risk is expected farther north where conditions are cooler and wetter (Fig. 1I). Two pest species (B. viridescens and C. nasturtii) do not currently occur on the Canadian prairies. If B. viridescens is introduced to the prairies, canola crops will likely be at risk across most of the prairies (Fig. 1E). In comparison, risk associated with C. nasturtii is expected to be limited to the western edge of canola production in Alberta, where conditions are sufficiently wet to support C. nasturtii population growth (Fig. 1F).
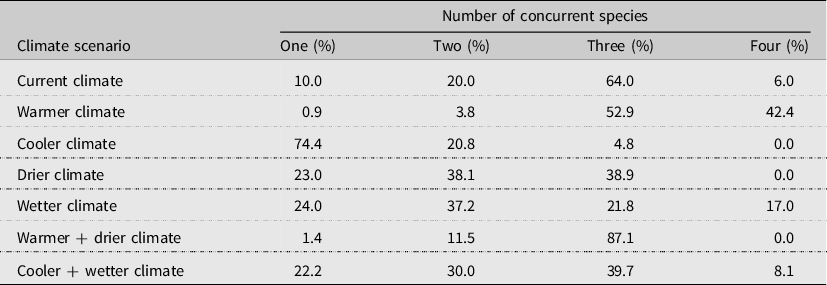
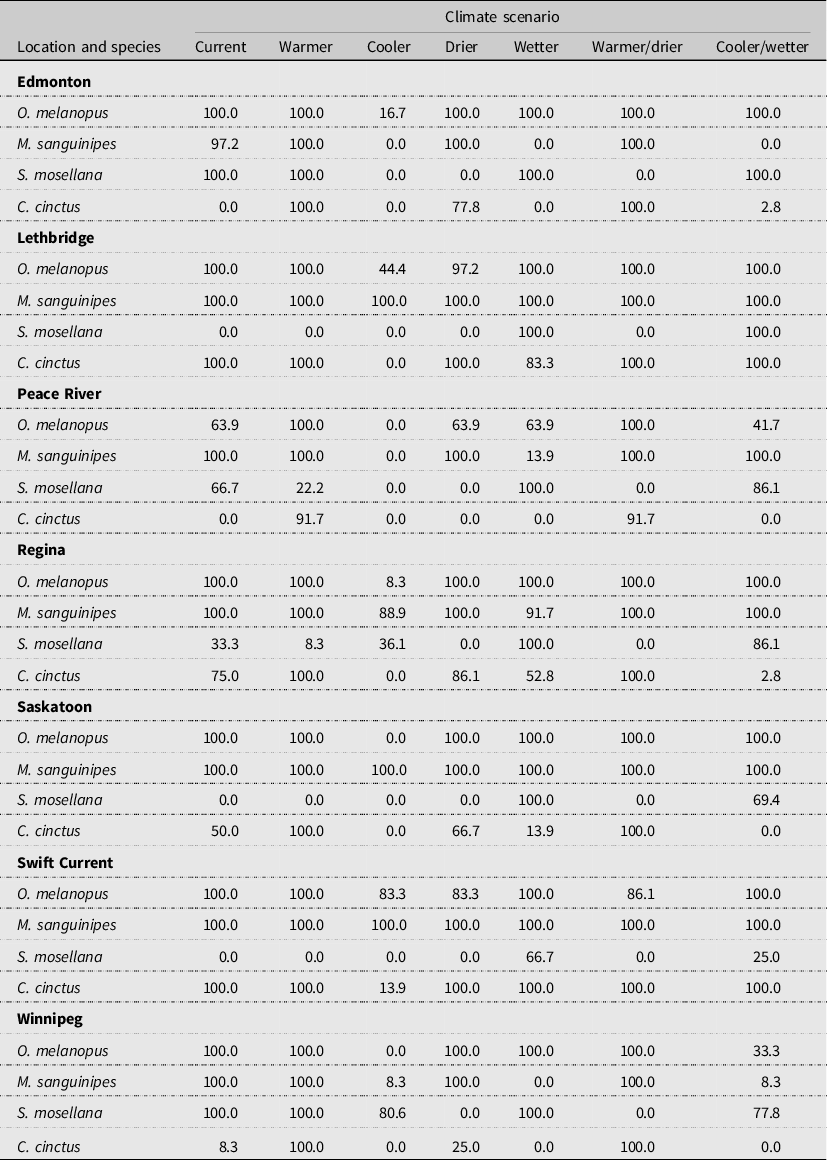
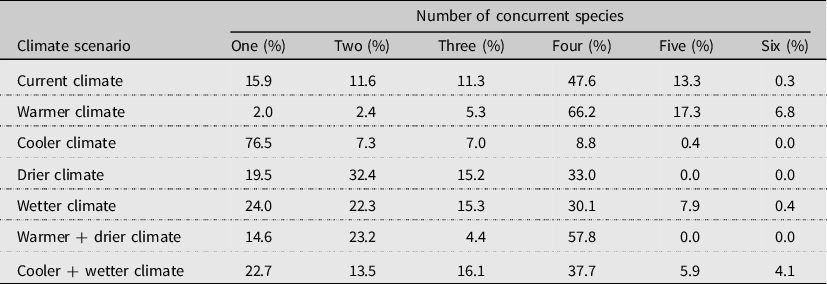
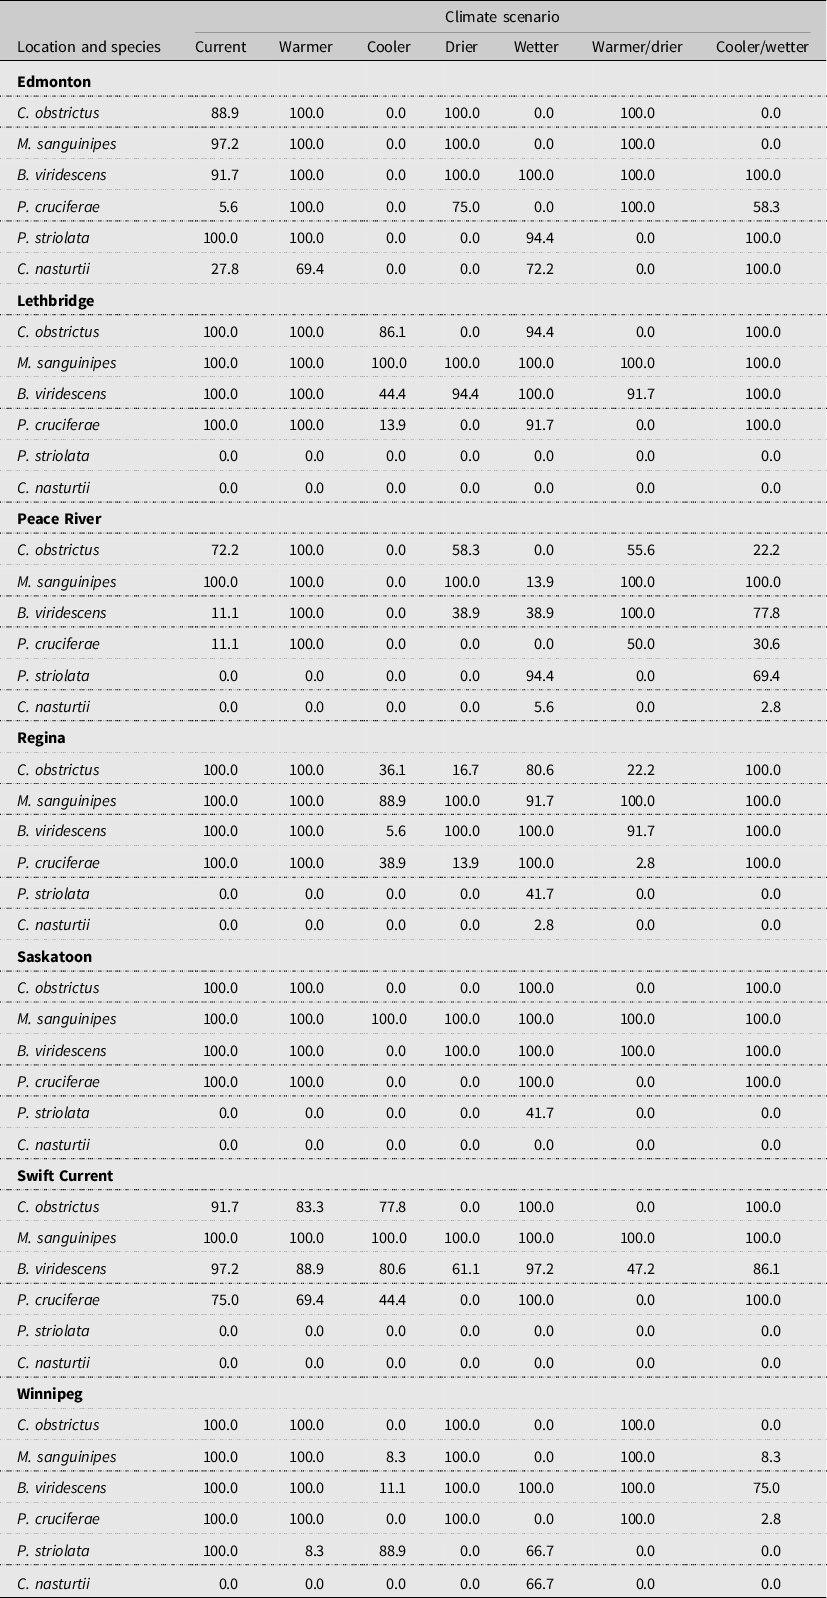
Pest risk was calculated based on the number of concurrent species expected to occur in each crop during the growing season. Under current climate conditions, about 70% of the prairie wheat-growing region is at risk of having three or four species present simultaneously (Table 1). The model for multiple-species risk indicates that risk to wheat from all four species is greatest in southern Manitoba, eastern Saskatchewan, and localised regions of central Alberta (Fig. 2A). Of the locations selected for in-depth analysis, only Regina and Winnipeg are likely to report risk from all four wheat pests in any given year (i.e., where ecoclimatic index values exceeded the defined thresholds for pest status; Table 2). All seven locations could be at risk from M. sanguinipes and O. melanopus. Predicted risk from S. mosellana is greatest in the wetter regions (e.g., Winnipeg and Edmonton), whereas C. cinctus risk is greatest in the warmer, drier regions of the prairies (e.g., Lethbridge and Swift Current; Table 2).
Percentage of the prairie agricultural resource area with potential risk of economic damage to wheat crops if one, two, three, and four insect pests of wheat occur concurrently under seven climate scenarios, where pests of wheat include Melanoplus sanguinipes, Oulema melanopus, Cephus cinctus, and Sitodiplosis mosellana.

Percentage of each 1° latitude × 1° longitude area around seven prairie cities at risk of economic population densities of four insect pests of wheat under seven climate scenarios.

Predicted risk to canola, due to multiple insect species, is greatest in southern and eastern Manitoba, north–central Alberta, and the central area of the Peace River region in Alberta (Fig. 2B). We calculated that 47.6% of the prairies is at risk to outbreaks of four canola insects under current climate conditions and that about 13% of the prairies is at risk of outbreaks of five concurrent canola pests (Table 3; Fig. 2B). Edmonton was the only location at risk from all six canola insects, but all seven locations could be at risk from C. obstrictus, M. sanguinipes, B. viridescens, and P. cruciferae (Table 4). Risk from P. striolata was greatest for Edmonton and Winnipeg (Table 4). Contarinia nasturtii risk is predicted to be greatest for Edmonton (Table 4; Fig. 2B), assuming this species is introduced to and establishes in western Canada.
Percentage of the prairie agricultural resource area with potential risk of economic damage to canola crops if one, two, three, four, five, or six insect pests of canola occur concurrently under seven climate scenarios, where pests of canola include Melanoplus sanguinipes, Ceutorhynchus obstrictus, Phyllotreta cruciferae, Phyllotreta striolata, Brassicogethes viridescens, and Contarinia nasturtii.

Percentage of each 1° latitude × 1° longitude area around seven prairie cities at risk for economic population densities of six insect pests of canola in seven climate scenarios.

Warmer climate
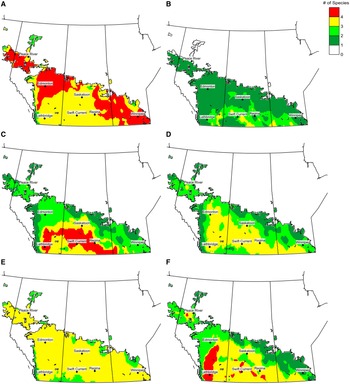
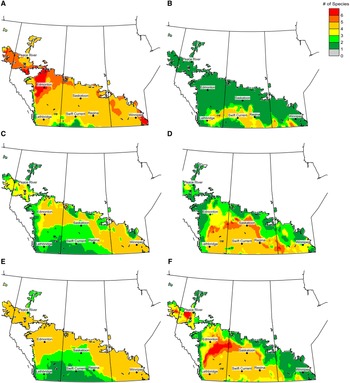
Warmer conditions (current climate + 2 °C) increased risk to wheat, resulting in about 95% of the growing area being at potential risk from three (52.9%) and four (42.4%) species simultaneously (Table 1; Fig. 3A). By location, area at risk of pest outbreaks associated with individual species increased (Table 2). Notably, the area at risk of outbreaks of C. cinctus increased significantly around Edmonton (from 0% to 100%) and Peace River (from 0% to 91.7%) in warmer climates compared to under current climate (Table 2). Compared to the current climate, warmer temperatures reduced the risk to canola production across Manitoba and increased the risk in the Peace River region of Alberta and the parkland region of Alberta and Saskatchewan (Fig. 4A). Similarly to wheat, the risk to canola production in warmer climate conditions increased most because of an increase in risk associated with specific insects, specifically P. cruciferae and C. nasturtii (Table 4). Around Peace River, for example, the area at risk to P. cruciferae outbreaks increased from 11% to 100% (Table 4). The only species for which risk was reduced in warmer climates (8.3%) as compared to the current climate (100%) was P. striolata around Winnipeg (Table 4).
The number of concurrent insect pest species that could occur in wheat crops under incremental scenarios relative to current climate (based on climate normals), including A, warmer (+ 2 °C), B, cooler (– 2 °C), C, drier (– 40% precipitation), D, wetter (+ 40% precipitation), E, warmer + drier (+ 2 °C, – 40% precipitation), and F, cooler + wetter (– 2 °C, + 40% precipitation).

The number of concurrent insect pest species that could occur in canola crops under incremental scenarios relative to current climate (based on climate normals), including A, warmer (+ 2 °C), B, cooler (– 2 °C), C, drier (– 40% precipitation), D, wetter (+ 40% precipitation), E, warmer + drier (+ 2 °C, – 40% precipitation), and F, cooler + wetter (– 2 °C, + 40% precipitation).

Cooler climate
Cooler conditions (current climate – 2 °C) reduced risk to wheat and canola production, with most of the prairies at risk from only one or two pest species (Tables 1, 3; Figs. 3B, 4B). In central and northern regions, only one pest species is likely to occur in high densities (Figs. 3B, 4B). The greatest decline in risk, based on location- and species-specific analysis, is expected around Edmonton and Peace River for both crops, whereas risk around Lethbridge and Swift Current was least affected by cooler temperatures (Tables 2, 4).
Drier climate
Drier conditions (current climate – 40% precipitation) reduced the area where three and four insect pests of wheat could occur relative to current climate conditions (Table 1; Figs. 2A, 3C). Across the Peace River region, risk was related to the occurrence of M. sanguinipes and O. melanopus (Table 2). Around Winnipeg, the area at risk of S. mosellana outbreaks was reduced to zero compared to risk under the current climate, when all areas around Winnipeg were at risk (Table 2). Drier conditions reduced risk to canola production across most southern areas of Saskatchewan and Alberta, with one or two species being economically significant (Tables 3, 4; Fig. 4C). Results indicated that drier conditions would have the greatest impact on S. mosellana (in wheat) and P. striolata (in canola; Tables 2, 4).
Wetter climate
Wetter conditions (current climate + 40% precipitation) increased risk to wheat production most in southern Saskatchewan and Alberta (Fig. 3D). Risk increased because conditions favourable for the development of S. mosellana exist in the Saskatoon region when it is wetter (Table 2). Wetter growing conditions resulted in a prairie-wide contraction of risk to canola production. Risk in the northern parkland (Edmonton) region decreased from five to six species in the current climate to three species in wetter climates (Table 4). Conversely, risk increased across the southern parkland region into the dark brown soil region of Saskatchewan (Fig. 4D). Relative to climate-normal values, a wetter growing season in the Winnipeg region is expected to result in reduced risk associated with C. obstrictus, M. sanguinipes, P. cruciferae, and P. striolata (Table 4).
Warmer and drier climate
The prairies often experience drought conditions that are associated with both warmer and drier conditions. Wheat production across the prairies is likely to be at risk from M. sanguinipes, O. melanopus, and C. cinctus (Table 2; Fig. 3E) when conditions are both warm and dry. At all seven locations used for in-depth analysis, warmer and drier growing conditions result in zero risk from S. mosellana (Table 2). Warmer, drier conditions resulted in risk to canola from one species across the south, two species in the central region, and three species across the parkland and Peace River regions (Fig. 4E). Model outputs for warmer, drier conditions were similar to model outputs for the “drier” scenario (current climate – 40% precipitation), indicating that the majority of insect pests included in the analysis respond to reduced precipitation to a greater degree than to increasing temperature (Table 4; Fig. 4D, E).
Cooler and wetter climate
Cooler and wetter growing conditions shifted risk to regions of western Alberta and a few localised areas in southern Saskatchewan and the central Peace River region (Fig. 3F). Risk in Manitoba was reduced overall, with only the southernmost areas at risk of three wheat pests (Tables 1, 2; Fig. 3F). Where risk increased, it was because conditions were more favourable for populations of S. mosellana (Table 2). Cooler, wetter growing conditions increased the risk to canola production, with large portions of Alberta and Saskatchewan becoming favourable for the co-occurrence of three or more insect pests (Table 3; Fig. 4F). In particular, a large region extending from south of Edmonton to west of Calgary in Alberta could be at risk from all six species of canola pests in cooler, wetter climates. In comparison to Alberta, canola production in Manitoba is expected to be at risk from only one or two species when conditions are cooler and wetter (Table 4; Fig. 4F). Increased risk south of Edmonton was associated with increased risk to canola from C. nasturtii (Table 4). In the Winnipeg area, risk to canola will occur in cooler, wetter conditions if B. viridescens invades and establishes viable populations.
Discussion
Estimating risk associated with multiple insect species
The first objective of the present study was to develop a method to analyse the impact of climate on the risk to crop production associated with multiple pest insects for both wheat and canola crops, using data from the Canadian Prairies Ecozone. Risk to wheat is due to four key insect species: C. cinctus, M. sanguinipes, O. melanopus, and S. mosellana. Risk to canola is associated with six key species: B. viridescens, C. obstrictus, C. nasturtii, P. cruciferae, P. striolata, and M. sanguinipes. Although we can use knowledge from past research and annual population monitoring to make generalisations about species-specific responses to changing growing season conditions, a tool that accounts for the responses of multiple species and estimates risk to crop production was not available until now.
Here, we defined ecoclimatic index thresholds for crop risk for nine important insect pests of wheat and canola field crops in western Canada, and we developed a system to calculate spatial estimates of pest risk to each crop associated with multiple insect species. Our method estimates how many insect species may reach pest status during a given growing season with specific climatic conditions. Risk estimates can be communicated using maps that permit spatial comparisons between regions and between specific incremental scenarios. Risk estimates can also be calculated for specific centres of agricultural production in Alberta, Saskatchewan, and Manitoba to permit estimates of species occurrence and to estimate total risk to a given crop associated with complexes of insect species.
The method we present for estimating crop risk due to multiple insect species can be expanded in the future: (1) to predict how risk will change as climate change occurs and (2) to predict crop risk associated with additional pests, including weeds and plant pathogens, as new bioclimatic models are developed. Although the multiple-species models are helpful in understanding risk to wheat and canola crops from a holistic viewpoint, species-specific phenology models are also required. In particular, phenology models estimate when farmers need to scout for insects during the growing season so that they can further mitigate risk (e.g., Olfert et al. Reference Olfert, Weiss, Vankosky, Hartley and Doane2020, Reference Olfert, Weiss, Giffen and Vankosky2021). Where phenology models are available, the Prairie Pest Monitoring Network (https://prairiepest.ca) uses them to provide weekly updates on development of insect populations that affect wheat and canola, beginning in May of each year.
Insect risk in response to incremental climate scenarios
Outputs from the model we developed indicate that risk to wheat and canola crops due to insects is most variable at the eastern, western, and northern extents of crop production on the prairies. This is probably because the insects included in the model are at the periphery of their geographic range and at the limits of field-crop production in these areas. Populations on the periphery of their geographic range may be exposed to less suitable weather than populations that are located near the geographic centre of their range (Olfert and Weiss Reference Olfert and Weiss2006a), which has implications for population growth and pest potential. Populations also tend to be more sensitive to variation in temperature and moisture when they occur near the limits of their geographical range (Sutherst Reference Sutherst, Mooney and Hobbs2000). Sitodiplosis mosellana, C. nasturtii, and P. striolata have specific temperature and precipitation requirements that limit their distribution across the prairies (Elliott et al. Reference Elliott, Mann and Olfert2009; Soroka et al. Reference Soroka, Grenkow, Otani, Gavloski and Olfert2018; Lui et al. Reference Lui, Mori, Olfert and Hallett2019). At the western, eastern, and northern extents of agricultural production, these requirements may not be met on an annual basis, an outcome that is reflected in the model estimates. Melanoplus sanguinipes populations are favoured by warm growing seasons (Olfert and Weiss Reference Olfert and Weiss2006b), but increasing temperatures in the insect’s current range could exceed its upper limit for optimum growth, resulting in lower ecoclimatic index values and, as a result, reduced risk.
Growing seasons that are 2 °C warmer than average will impact the number of concurrent insect species associated with both wheat and canola crops on the prairies. Warmer growing seasons expanded the potential range of C. cinctus, C. cruciferae, and C. nasturtii, thereby increasing pest-related risk. In contrast, cooler growing seasons generally resulted in reduced risk because the number of concurrent insect species threatening either crop was limited to only one or two. Of the two incremental scenarios where precipitation levels were manipulated, drier growing seasons were associated with reduced risk because dry conditions affect the development, and thus the distribution, of several insect pests, including S. mosellana. On the prairies, drought, which is associated with increased temperature and reduced precipitation, is a common occurrence (Sauchyn et al. Reference Sauchyn, Barrow, Hopkinson and Leavitt2002). Our analysis demonstrates that fewer insect species are likely to exceed economic thresholds in warmer and drier growing seasons, relative to average growing seasons. However, we observed some interesting nuances in terms of which species were affected by warm and dry conditions and which were affected by cool and wet conditions. Of the species studied, M. sanguinipes responded most favourably to warmer, drier growing seasons, as previously modelled (Olfert and Weiss Reference Olfert and Weiss2006b) and observed (Pickford Reference Pickford, Hemming and Taylor1972). In comparison, C. nasturtii and B. viridescens, which are both potentially invasive in western Canada, are more likely to occur at economic levels in cool, wet growing seasons.
Overall, the incremental scenario analyses confirmed that insect pest species respond to growing season weather conditions in varying and species-specific ways, as previously reported (Lehmann et al. Reference Lehmann, Ammunét, Barton, Battisti, Eigenbrode and Jepsen2020). Importantly, although pest risk estimates at specific locations may have been similar, the composition of the insect pest community posing the risk frequently differed.
Conclusions
Using species-specific ecoclimatic index value thresholds generated using bioclimatic models, we have developed a method to estimate risk, associated with multiple insect pests, to canola and wheat crops, where risk increases as the number of insect species that co-occur in a growing season increases. Incremental sensitivity analyses were used to estimate how changing temperature and precipitation conditions impact risk and to identify the species most sensitive to changing climatic conditions. This knowledge, coupled with outputs that present the risk of multiple insects occurring at or above economic levels, can be used by the agricultural sector to minimise risk from concurrently occurring insect pest species. Multiple-species models will serve as useful tools to assess potential risks and subsequently reduce risks via crop variety selections, agronomic practices, and pest management decisions. Through increased awareness, the agricultural industry can be more proactive in monitoring, detecting, and managing crop pests (Olfert et al. Reference Olfert, Weiss, Catton, Carcamo and Meers2019) to minimise their economic impact and to enhance agricultural sustainability. Future iterations of the approach described here will incorporate crop pathogens, weeds, and additional insects to present increasingly holistic risk estimates. This method could be applied to additional field crops, such as economically and rotationally important pulses (Fabaceae). Finally, this method can also be used to investigate how risk has differed between specific growing seasons (e.g., 2010 versus 2020) and to investigate the impacts of climate change on crop risk associated with insect pests.
Acknowledgements
The authors thank many students and technical staff for their valuable input to the development of the species-specific bioclimatic models used in this study – especially for their efforts related to research studies, field surveys, species identification, and data management over many years.
Conflicts of interest
The authors declare no competing interests.