Introduction
Pests and weeds are a threat to sustainable farming systems because serious infestations can reduce the yield potential of arable crops (Sells, Reference Sells1995; Lucas, Reference Lucas2011). Also, they are a threat to sustainability because modern agriculture is reliant on chemicals to control pests. Integrated pest management (IPM) promotes the use of pest management strategies that rely heavily on non-chemical pest management strategies or cultural practices and thus it prescribes minimum or sometimes no use of chemicals, prevents the use of chemicals with certain active ingredients or substances (Hillocks, Reference Hillocks2012; Ahuja et al., Reference Ahuja, Ahuja, Singh and Singh2015; Lechenet et al., Reference Lechenet, Deytieux, Antichi, Aubertot, Bàrberi, Bertrand, Cellier, Charles, Colnenne-David, Dachbrodt-Saaydeh, Debaeke, Doré, Farcy, Fernandez-Quintanilla, Grandeau, Hawes, Jouy, Justes, Kierzek, Kudsk, Lamichhane, Lescourret, Mazzoncini, Melander, Messéan, Moonen, Newton, Nolot, Panozzo, Retaureau, Sattin, Schwarz, Toqué, Vasileiadis and Munier-Jolain2017; Bottrell and Schoenly, Reference Bottrell and Schoenly2018).
As part of IPM, integrated weed management (IWM) promotes sustainable management of weeds (Chikowo et al., Reference Chikowo, Faloya, Petit and Munier-Jolain2009; Pardo et al., Reference Pardo, Riravololona and Munier-Jolain2010), if possible through the use of cultural practices to control weeds. Ideally, IWM should not incur penalties in terms of productivity and total economic performance (Chikowo et al., Reference Chikowo, Faloya, Petit and Munier-Jolain2009). Realistically, however, IWM strategies may incur costs because of reductions in profit as farmers switch between crops that vary in profitability. These costs may be offset if there is less reliance on expensive chemicals.
Black-grass (Alopecurus myosuroides Huds.) is the most important annual grass weed in the UK and Europe (Moss et al., Reference Moss, Perryman and Tatnell2007; Lutman et al., Reference Lutman, Moss, Cook and Welham2013; Keshtkar et al., Reference Keshtkar, Mathiassen, Moss and Kudsk2015). It is very competitive and has the ability to produce large quantities of seeds. In autumn-sown arable crops, A. myosuroides can cause substantial yield reductions (Lutman et al., Reference Lutman, Moss, Cook and Welham2013; Keshtkar et al., Reference Keshtkar, Mathiassen, Moss and Kudsk2015). The high frequency of autumn-sown crops in the UK has contributed to an increase in A. myosuroides infestations (HGCA, 2008; Keshtkar et al., Reference Keshtkar, Mathiassen, Moss and Kudsk2015). As with most pests, the control of A. myosuroides has been primarily through the use of chemicals. However, it has evolved resistance to a number of herbicides (Moss et al., Reference Moss, Perryman and Tatnell2007). There is, therefore, a need to find alternative crop husbandry to reduce A. myosuroides infestation as well as to re-balance the financial consequences of yield loss through A. myosuroides infestation.
IWM strategies for A. myosuroides control include tillage practices (e.g. ploughing), cultural practices (e.g. delayed sowing) and crop rotation (with spring cropping) (Colbach et al., Reference Colbach, Roger-Estrade, Chauvel and Caneill2000; Moss and Hull, Reference Moss and Hull2012; Lutman et al., Reference Lutman, Moss, Cook and Welham2013; HGCA, 2014a; Bayer, 2015). Crop rotation with spring cropping is beneficial in several respects for the sustainability of agricultural systems (Schönhart et al., Reference Schönhart, Schmid and Schneider2011; HGCA, 2014a). In terms of weed control it is effective at reducing A. myosuroides population: reductions of 78–96% in populations are reported from the use of spring crops (Moss and Hull, Reference Moss and Hull2012; Lutman et al., Reference Lutman, Moss, Cook and Welham2013). This is because A. myosuroides germinates primarily in the autumn, with very few plants emerging in spring-sown crops (Chauvel et al., Reference Chauvel, Guillemin and Letouze2005; Colbach et al., Reference Colbach, Kurstjens, Munier-Jolain, Dalbiès and Doré2010). Despite these advantages, a major drawback of spring crops is that they yield lower economic returns. For example, in 2014, the gross margin for winter wheat and spring barley were £833/ha and £647/ha, respectively, whereas their respective herbicide costs were £70/ha and £48/ha (Nix, Reference Nix2014). Switching from winter wheat to spring barley to control A. myosuroides reduces gross margin by £183/ha whereas herbicide cost reduces by only £22/ha. Thus following a winter crop with a spring crop is likely to reduce herbicide input and cost but with a bigger reduction in revenue due to lower yields associated with spring crops (Pardo et al., Reference Pardo, Riravololona and Munier-Jolain2010; Moss and Hull, Reference Moss and Hull2012; Bayer, 2015).
Research on the effect of spring cropping on A. myosuroides control normally focuses on yield and weed populations and based on field experiments, but ignores economic costs. Some studies (Pardo et al., Reference Pardo, Riravololona and Munier-Jolain2010; Beltran et al., Reference Beltran, Pannell, Doole and White2012) have used dynamic farm-modelling approaches to investigate non-chemical weed management strategies under IWM. However, none of these studies estimated the cost of A. myosuroides control to farmers at a national scale using cultural control methods. The national scale picture is also important because recent years have seen reductions in the area of wheat grown in the UK as farmers adopt alternative crops to manage A. myosuroides (Hicks et al., Reference Hicks, Comont, Coutts, Crook, Hull, Norris, Neve, Childs and Freckleton2018).
The objective of the current study is thus to estimate the economic cost/benefit of crop plans, which includes a winter wheat–spring crop rotation as control measure for A. myosuroides. A model that is appropriate for predicting the economically optimal cropping for a given weed infestation is presented. Farm data from across the UK are used to parameterize the model and predict the range of variation in outcomes, as well as to forecast the national impacts of wide-scale adoption of this strategy to manage A. myosuroides. The analysis presented in the current study is most relevant to understanding the short-term economic consequences of rotational management of A. myosuroides with spring crops. The results presented in the current study are novel because there has been no previous analysis of the economics of controlling A. myosuroides using rotational management at farm or national scale.
Materials and methods
Farming scenario
The current study considers a typical arable rotation containing four crops: winter wheat (Triticum aestivum L.), spring barley (Hordeum vulgare L.), spring beans (Vicia faba L.) and winter oilseed rape (Brassica napus L.). Although other crops such as winter barley and spring wheat are important in UK arable farming, these four crops represent the rotational options used to control A. myosuroides (H. L. Hicks, personal communication). The study was built on the previous models of Annetts and Audsley (Reference Annetts and Audsley2002), Rounsevell et al. (Reference Rounsevell, Annetts, Audsley, Mayr and Reginster2003) and Cooke et al. (Reference Cooke, Mattison, Audsley, Bailey, Freckleton, Graves, Morris, Queenborough, Sandars, Siriwardena, Trawick, Watkinson and Sutherland2013).
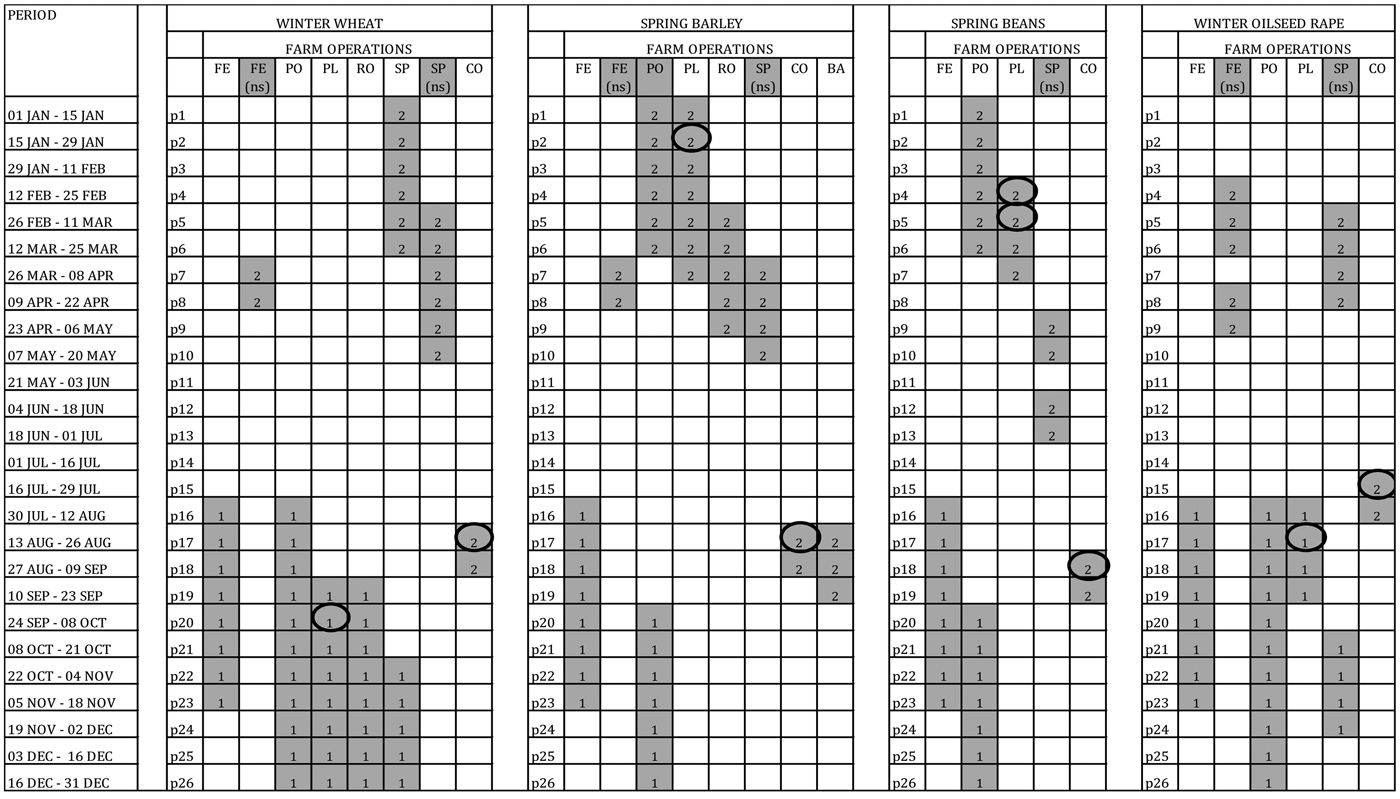
A set of sequential and non-sequential farm operations are carried out on each crop during the farm year. The farm season is divided into 26 two-week periods during which farm operations such as sowing or harvest occur (see Fig. A1 in Appendix A for the operation types and sources of information). The workable hours available to the farm to carry out each operation in each period depend on the soil type and rainfall pattern at the farm location. Also, the rate at which earth moving operations such as ploughing are carried out depends on the soil type, whilst the work rate of operations such as planting and combine harvesting depend on the seed amount and crop yield respectively.
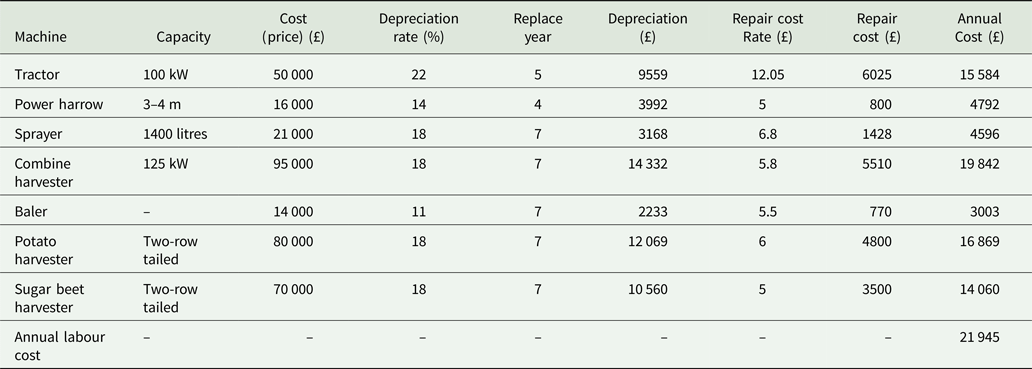
The work rates of both sequential and non-sequential operations depend on the size of machines owned by the farm (see Table A1 in Appendix A for machine types used for the study and sources of information). The dominant soil type (in addition to the previous crop grown) at the farm determines the fertilizer amounts applied to each crop (recommended fertilizer amounts to soil type taken from Defra (2010)).
In the current study, the crop rotation is a 4-year crop cycle. Farms practising crop rotation decide the number of hectares of land allocated to a crop, as well as the next crop to follow. The choice of crop will depend on the objective of the farmer, and other factors such as soil type, revenue, weather and risk (Dury et al., Reference Dury, Schaller, Garcia, Reynaud and Bergez2012).
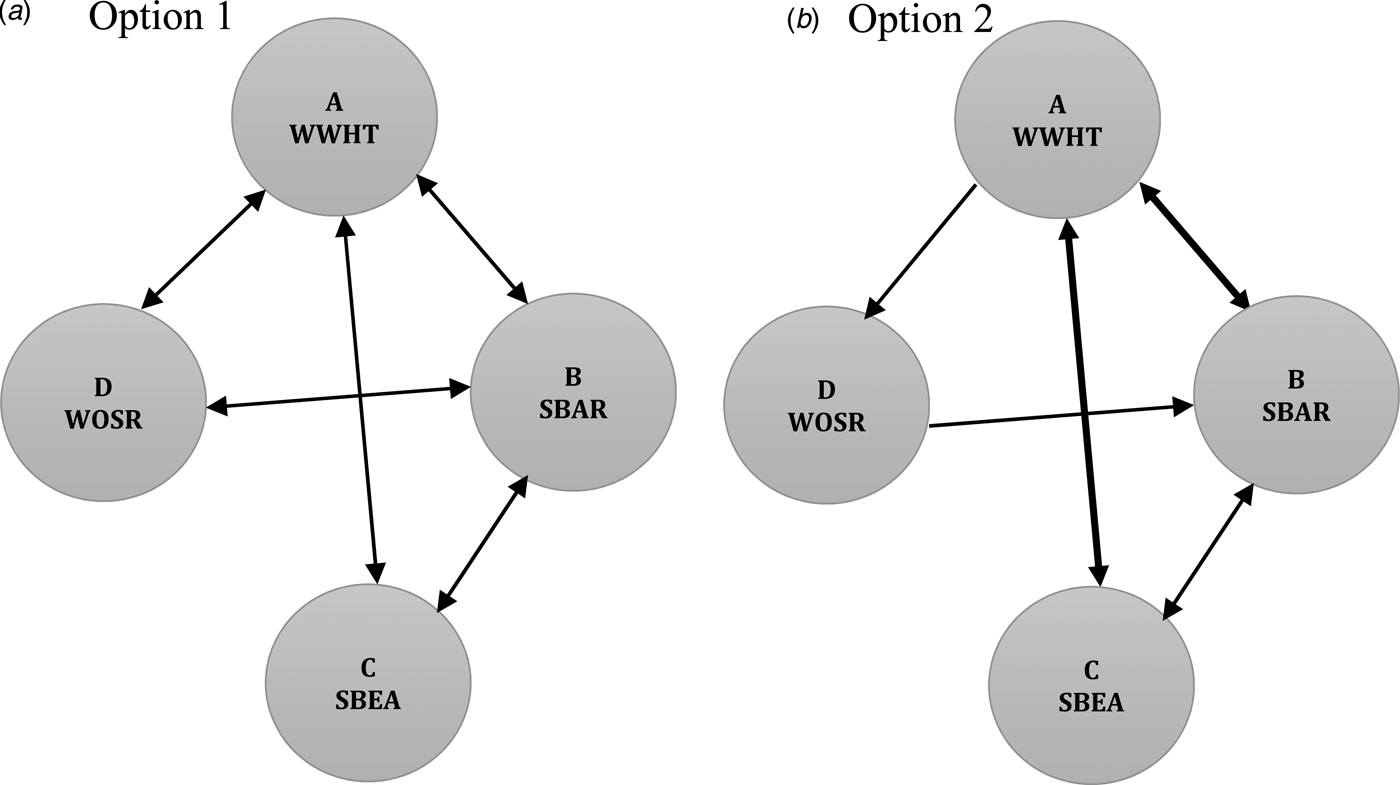
Two crop plan options (summarized in Fig. 1) are considered in the current study, one unconstrained winter wheat–spring crop rotation (Option 1) and another rotation constrained to include winter wheat followed by a spring crop (Option 2). In Option 1, there are four fields available and farmers may grow any of the four crops: winter wheat (WWHT), spring barley (SBAR), spring beans (SBEA) and winter oilseed rape (WOSR). In terms of crop sequence or succession it is assumed that each crop can be grown on any of the fields A, B, C and D (as shown by the arrows in Fig. 1(a)) and there are no constraints imposed on the winter wheat–spring crop rotation.
Cropping plan scenarios. Option 1 is a scenario under which each crop can be grown on each of the four fields, A, B, C and D. Option 2 is a scenario under which mandatory WWHT (winter wheat)–SBAR (spring barley) or WWHT (winter wheat)–SBEA (spring beans) sequence is assumed (shown by thick arrow lines). WOSR = winter oilseed rape. The change in arrow between WWHT and WOSR means a WWHT field cannot be cropped with WOSR under Option 2. There is no arrow between WOSR and SBEA as a sequence or rotation between legumes and brassica crops are not encouraged due to possible disease build-up.

Option 2 implements rotational management of A. myosuroides (as shown in Fig. 1(b)) in which a winter wheat–spring barley or spring beans sequence is adopted. The main difference between Options 1 and 2 is that under Option 2 any land from which winter wheat has been harvested is constrained to be sown with either spring barley or spring beans in the next season (i.e. winter wheat is always followed by a spring crop).
Modelling black-grass infestation
A. myosuroides population infestation is modelled empirically through contrasting scenarios of winter wheat yield reductions under different infestations (low, medium, high and very high: see Queenborough et al. (Reference Queenborough, Burnet, Sutherland, Watkinson and Freckleton2011) for definitions of densities). This was done for simplicity in order to make it possible to contrast the economic consequences of employing rotational control at different stages of infestation.
The mixed-integer weighted goal-programming (MIWGP) model
The MIWGP model allows weights and goal targets to be set to optimize farming goals by selecting optimum crop plan and machines/labour numbers. The model was set-up to select four crops: winter wheat, spring barley, spring beans and winter oilseed rape. The model assumes that there is always one farmer (integer) in addition to the labour numbers selected by the model (assumed to be permanent workforce) and thus makes the model a mixed-integer. The decision variables are the crop types and each crop plan selected by the model comes with it, machine and labour numbers.
The risk minimization goal was based on the principles of the minimization of total absolute deviation (MOTAD) approach (Hazell, Reference Hazell1971) and hence the standard deviation of gross margin was used as a measure of risk. Although, a typical MOTAD model could have been applied, with the primary focus on profit maximization and some consideration to risk, the MIWGP model, which incorporates a risk goal was found to serve the same purpose as a MOTAD model, hence fit for purpose.
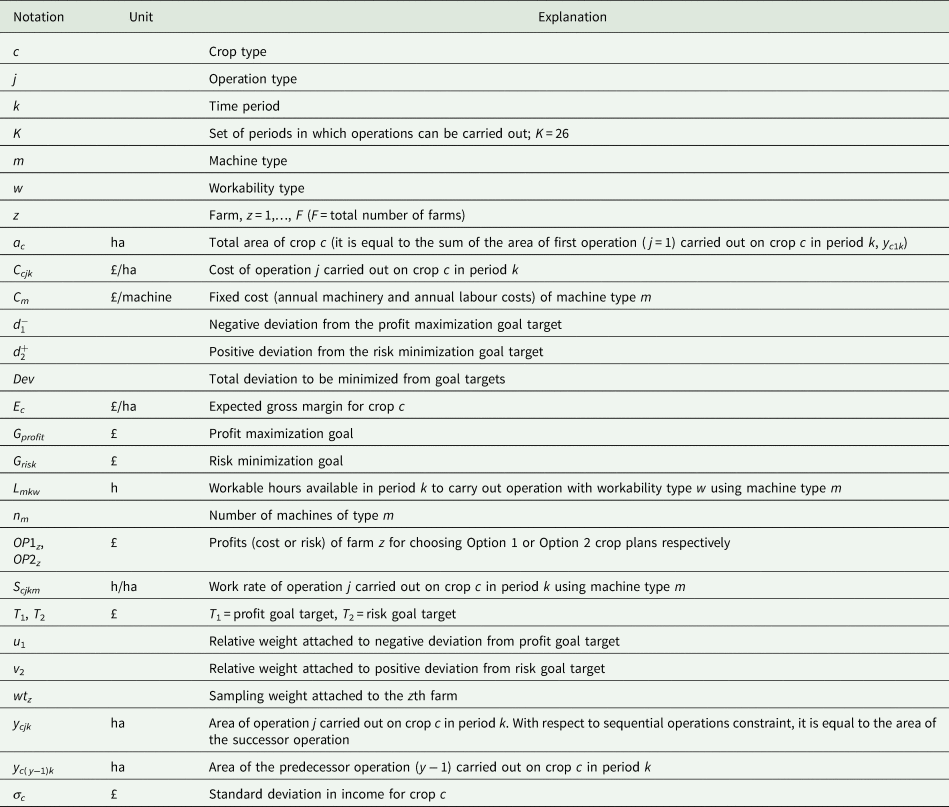
The MIWGP model minimizes total deviations in profit and risk goal targets (Eqn (1)) subject to profit maximization (Eqn (2)) and risk minimization (Eqn (3)) and a set of constraints under the model constraint section below, where Dev is the total deviation in profit and risk goal targets, d 1− is the negative deviation from the profit maximization goal target, d 2+ is the positive deviation from the risk minimization goal target, and u 1 and v 2 are the relative weights attached to the negative deviation in profit and positive deviation in risk goal targets, respectively. All other model notations are summarized in Table 1. Summations are taken over the periods and operations for each crop, which vary from crop to crop. The algebraic expressions shown in Eqns (2)–(6) are adapted from the expressions used by Annetts and Audsley (Reference Annetts and Audsley2002), Rounsevell et al. (Reference Rounsevell, Annetts, Audsley, Mayr and Reginster2003) and Cooke et al. (Reference Cooke, Mattison, Audsley, Bailey, Freckleton, Graves, Morris, Queenborough, Sandars, Siriwardena, Trawick, Watkinson and Sutherland2013):

Subject to:
Goal 1: Profit maximization


Goal 2: Risk minimization

Model notation

Model constraints
Resource constraints
This constraint ensures that the amount of a resource needed to carry out an operation on a crop does not exceed the amount of the resource available. The resource type considered is the number of workable hours available in a period:

Sequential and non-sequential operation constraints
The sequential operation constraint ensures that an operation is not performed before its preceding operation and that the area of the successor operation cannot exceed the area of the preceding operation. For example, a crop has to be planted before it can be harvested and that the area of crop harvested cannot exceed the area of crop planted. The constraint can be expressed as shown in Eqn (6). For non-sequential operations, total area of each operation carried out in a period cannot exceed the total crop area:

Winter wheat–spring crop sequence constraint
This constraint ensures a spring crop following winter wheat. If the area of winter wheat = a 1, area of spring barley = a 2 and area of spring beans = a 3, the winter wheat–spring barley sequence constraint can be stated as in Eqn (7) and under a scenario of ensuring winter wheat–spring beans sequence, a 2 is replaced with a 3:

Total cropping area constraint
The sum of areas of all crops is less than or equal to the total area cropped. This means that the total land area cropped by a farmer cannot exceed the total cropping area available to the farmer, i.e.:

Model validation
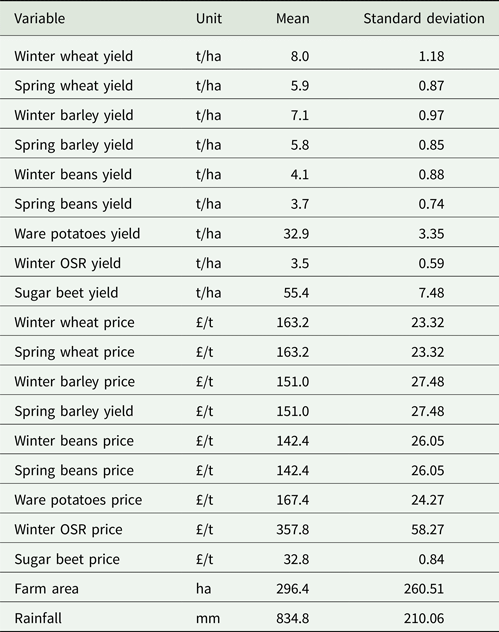
The model was implemented using the R environment (R Core Team, 2015), and the mixed-integer weighted goal-programming model was solved using the Rglpk package (https://cran.r-project.org/web/packages/Rglpk/Rglpk.pdf). The MIWGP model was validated using prediction validation (McCarl and Spreen, Reference McCarl and Spreen1997) and 2009–13 Farm Business Survey (FBS) data for 281 lowland arable farms in England and Wales. The Farm Business Survey (https://www.gov.uk/government/collections/farm-business-survey) gives information about information on the financial, physical and environmental performance of farm businesses in England and Wales. Some of the data collected in the FBS are crop yield, crop areas, margins and costs. Crop yields, farm area, soil types and rainfall were used as data inputs (see Table A2 in Appendix A for descriptive statistics of these data). The soil type determined the fertilizer amounts for each crop, and both the annual rainfall and soil data determined the workable hours using the land indicator type (LTI) function (Tillett and Audsley, Reference Tillett and Audsley1987):

where X = (1.257 − 0.257 Soil Type) Rainfall + 0.762(Soil Type − 1). The soil type is based on indices from 0.5 to 2.5 at an interval of 0.25, representing light to heavy soil. The LTI were used in a series of equations to determine workable hours for different periods. In Defra (2010), fertilizer amount recommended for crops were linked to soil type and this was incorporated into the MIWGP model.
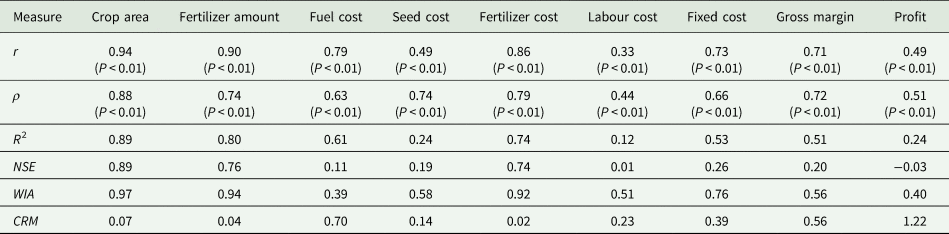
The results generated by the model as part of the validation were compared with the corresponding observed FBS data using statistical measures of association, specifically: Pearson correlation (r), Spearman rank correlation (ρ), coefficient of determination (R 2), Nash–Sutcliffe's model efficiency (NSE), Willmott's index of agreement (WIA) and coefficient of residual mass (CRM) (see equations of statistical measures of association in Appendix A). Each of the statistical measures of association has its strengths and weaknesses. The inclusion of multiple statistical measures permits a more thorough characterization of the predictive abilities of the models.
Economic evaluation
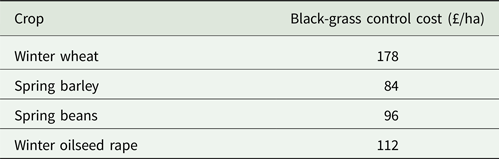
The economic evaluation was based on estimates of crop gross margin, defined as output plus subsidy less fertilizer, seed, A. myosuroides herbicide and sundry costs. The output estimates were based on crop yields and prices, whereas the subsidy was based on single farm payment values, and the sundry costs were obtained from Nix (Reference Nix2014). Fertilizer cost estimates were based on recommended amounts in Defra (2010), determined by soil type. Seed amounts were obtained from Toosey (Reference Toosey, Halley and Soffe1988). A. myosuroides control costs were determined by chemical costs only (see Table A3 in Appendix A).
The operation costs (primarily fuel) were functions of work rates for machines and fuel price. The equations for estimating the work rates were obtained from the farmR model (Cooke et al., Reference Cooke, Mattison, Audsley, Bailey, Freckleton, Graves, Morris, Queenborough, Sandars, Siriwardena, Trawick, Watkinson and Sutherland2103) and Chamen and Audsley (Reference Chamen and Audsley1993). Estimation of the operation costs took into consideration timeliness penalties. The fixed cost estimates were based on annual machinery cost (depreciation and repair costs) and annual labour cost (see Table A1 in Appendix A for machine types selected for the current study). Owing to the lack of data on machine numbers for each of the farms selected and used for the current study, the total fixed cost estimate for each farm was based on the optimal machine/labour numbers estimated by the model.
Model data, calibration and model runs
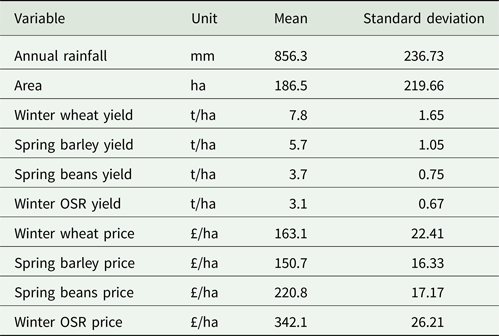
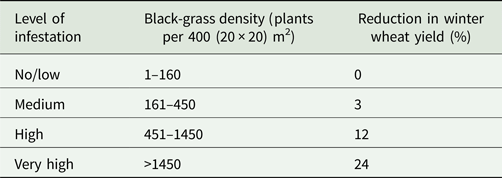
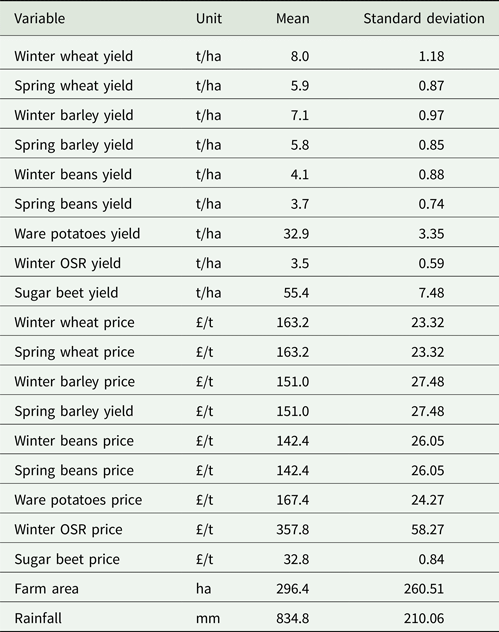
Data from 745 farms in the 2013/14 FBS were used to parameterize the model. Crop yield, price, arable area, soil type and rainfall were used as inputs (see Table A4 in Appendix A for descriptive statistics). Farms at altitudes <300 m, 300–600 m and >600 m with arable area of greater than or equal to 40 ha (maximum area = 1931 ha) were selected. Soil-type data were based on dominant soil types obtained for FBS-defined counties in which farms are located (Soilscapes, 2016) whereas the rainfall data were based on average rainfall for FBS-defined regions in which farms are located (Met Office, 2016). The soil type and rainfall data were used to estimate the workable hours for each farm using the LTI function in Tillett and Audsley (Reference Tillett and Audsley1987). To model the impact of A. myosuroides on winter wheat yield, yield losses under four different A. myosuroides infestation levels were considered (see Table A5 in Appendix A).
The model was run with the highest weight (weight = 1) on the profit maximization goal and because a weighted goal-programming model minimizes the deviation from a goal target, the profit maximization goal target was set very high (£800 000) to accommodate profit levels of all farms. Based on the assumption that arable farmers are profit maximizers, but with some concern about income deviation (risk) levels, the weight for the risk minimization goal was set relatively very small (weight = 0.1 and risk target set at £22 000 with possible over-achievement of goal target).
The model was first run for each of the 745 farms to generate crop plans similar to Option 1, under each level of A. myosuroides infestation (one level of infestation at a time), without enforcing the winter wheat–spring crop sequence constraint (Eqn (7)). The model was run again for each farm by first imposing only the mandatory winter wheat–spring barley sequence constraint (Option 2) under each level of infestation. The process was repeated by imposing only the winter wheat–spring beans constraint (also Option 2) under each level of infestation.
Aggregation of model results
To estimate the net cost of adopting spring cropping as a control strategy for A. myosuroides, model results were aggregated across farms. It was acknowledged that there may be biases associated with aggregation with respect to linear-programming approaches and also due to variability in farm classes (Buckwell and Hazell, Reference Buckwell and Hazell1972; Önal and McCarl, Reference Önal and McCarl1989). However, the current approach gave a fair estimate of the impact of spring cropping as A. myosuroides control strategy on farm revenue in the UK arable farming sector.
To estimate the aggregate cost/benefit, the differences in optimum profits for Options 1 and 2 were estimated and aggregated as either the cost (loss of profit) or benefit (increase in profit) of A. myosuroides control with either spring barley or spring beans. For example, in order to estimate the aggregate cost with respect to winter wheat–spring barley rotation under each level of infestation, the difference between profits for Options 1 and 2 were estimated for each farm after which they were summed across the 745 farms. To reduce possible aggregation bias and bring the aggregate estimate as close as possible to the UK level, each farm estimate was weighted using the sample weight assigned to each farm in the FBS. For each spring cropping sequence and under each level of infestation, the aggregate cost was estimated as shown in Eqn (10):

Results
Model validation
Estimates of r, ρ and R 2 showed positive associations between model results and observed data (Table 2). The Spearman and Pearson's correlation estimates for crop area, fertilizer amount, cost and revenue predictions were statistically significant (P < 0.01).
Model validation results of the comparison between the predicted and observed crop areas, fertilizer amounts and farm revenues/costs
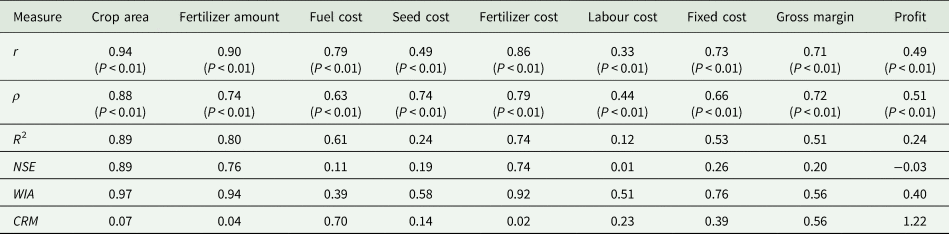
r, Pearson correlation coefficient; ρ, Spearman correlation coefficient; R 2, coefficient of determination (estimated by squaring r); NSE, Nash–Sutcliffe's model efficiency; WIA, Willmott's index of agreement; CRM, coefficient of residual mass.
Crop area is the total crop areas of 281 farms predicted by the model. Fertilizer amount is the total nitrogen (N), phosphorous (P) and potassium (K) fertilizer amounts of 281 farms predicted by the model. The observed data were for 281 farms used to validate the model.
The NSE and WIA estimates showed various degrees of association between predicted and observed data and also reflect the predictive ability of the model with respect to the model estimates. The positive CRM estimates showed under predictions by the model. Also, based on the NSE and R 2 estimates, it can be said that the model-predicted crop areas and fertilizer amount relatively better than farm costs and revenues. This may due to the fact that certain factors influencing these costs and revenues on farms may not have been captured in the model. Notwithstanding, predictions of costs and revenues made by the model can be said to be acceptable or reasonable based on the correlation estimates, and fit the objective of the current study.
The NSE, WIA and CRM estimates thus reflect the limitation associated with model prediction. This limitation can be overcome on a farm-by-farm basis through inclusion of detailed individual farm data, or by aggregating predictions across many farms to average across this variation resulting from these unknown costs. The methodology adopted in the current study concentrated mainly on the latter approach.
The cost of black-grass control with spring barley
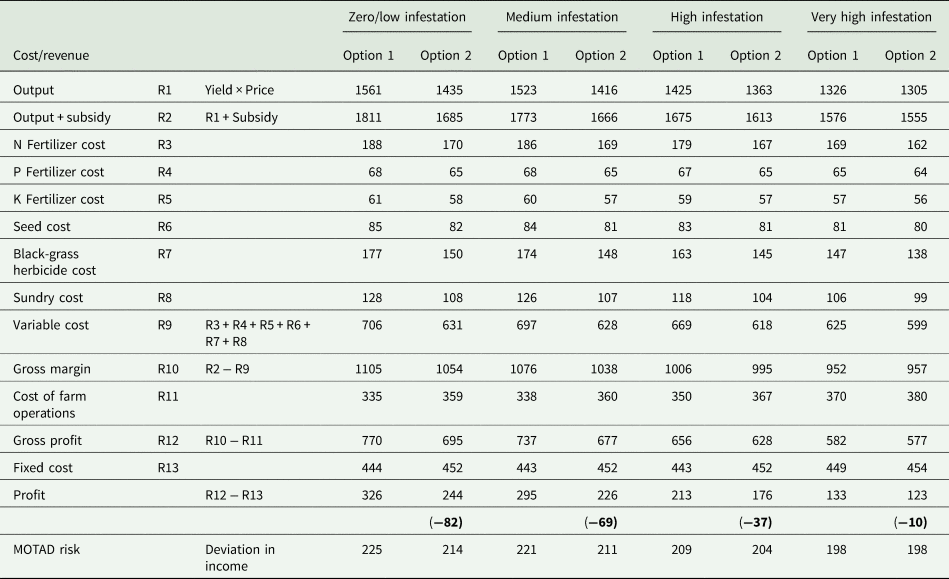
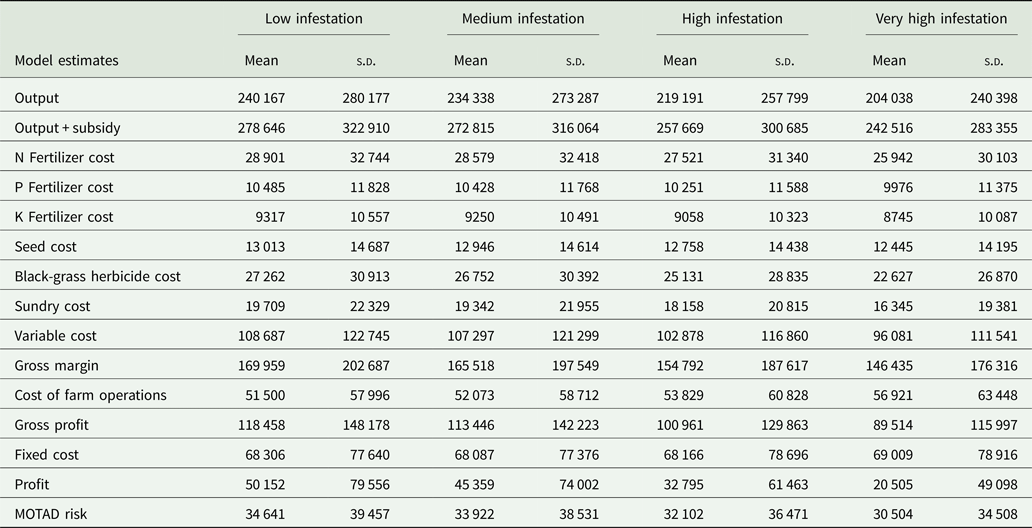
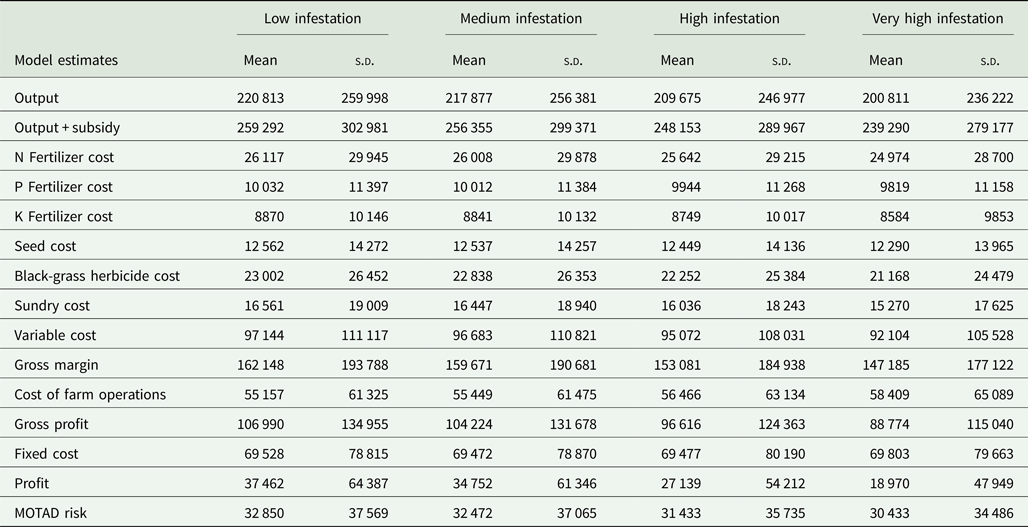
The aggregate costs of controlling A. myosuroides with spring barley under scenarios of low and very high infestations were approximately £82/ha and £10/ha, respectively (Table 3). Implementing a winter wheat–spring barley rotation after a low A. myosuroides infestation reduced profit by 25.30% (from £326/ha to £244/ha) and under very high infestation, profit reduced by 7.49% (from £133/ha to £123/ha) (see Table 3).
Aggregate revenues/costs (£) of controlling black-grass with winter wheat–spring barley rotation under four levels of black-grass infestation
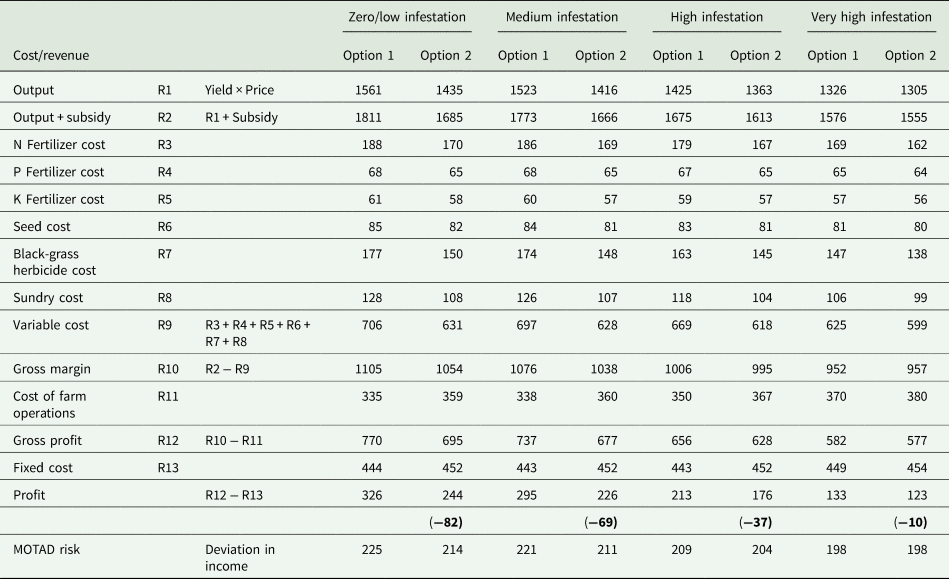
N, nitrogen; P, phosphorus; K, potassium; MOTAD, minimization of total absolute deviation.
These costs are expressed on a per hectare basis. R1–R13 represent the rows in the table. The numbers in parentheses represent the differences in Option 1 and Option 2 profits. See Tables B1 and B2 in Appendix B for the mean and standard deviation estimates of the results.
At low A. myosuroides infestation, implementing Option 2 also reduced the MOTAD estimated risk by 5.17% (from £225/ha to £214/ha), whereas under very high infestations risk reduced negligibly (0.23%, ~£198/ha in both cases). The reduction was mainly due to lower income deviation estimates associated with spring barley as well as winter OSR, which was selected in addition to the winter wheat–spring barley rotation. The results also showed that controlling A. myosuroides with spring cropping could reduce farm risk due to lower deviation income through deviation in yield associated with spring crops. However, under a scenario of very high infestation the reduction may be negligible due to the fact that spring cropping did not result in a bigger reduction in profit. The lower levels of profit observed under scenarios of A. myosuroides infestations were mainly due to reductions in winter wheat yield due to A. myosuroides infestation.
In terms of costs, all variable cost components reduced under rotational management. For example, under low A. myosuroides infestation, nitrogen (N) fertilizer and herbicide costs reduced by 9.63% (from £188/ha to £170/ha) and 15.63% (from £177/ha to £150/ha) respectively. Under very high infestation, N fertilizer cost reduced by 3.73% (from £169/ha to £162/ha) whereas A. myosuroides control (herbicide) cost reduced by 6.45% (from £147/ha to £138/ha). The reduction in N fertilizer and herbicide costs was due to lower N fertilizer and chemical control costs associated with spring barley. Lower reductions in herbicide costs under very high infestation occurred because there was little difference in the crop plan (relative to Option 1) when winter wheat–spring barley sequence constraint was imposed.
Operations and fixed costs on the other hand increased by 7.10% (from £335/ha to £359/ha) and 1.79% (from £444/ha to £452/ha), respectively, under low infestation. Under very high infestation, operation costs increased by 2.61% (from £370/ha to £380/ha) and fixed cost increased by 1.15% (from £449/ha to £454/ha) respectively. The increase in operation costs was because, with the implementation of the winter wheat–spring barley rotation, some land was allocated to winter OSR or spring beans. Both spring beans and winter OSR had a slower work rate with respect to combine harvesting and as a result relatively more time was spent on the field harvesting, leading to increased operation costs. Also the harvesting periods of winter wheat and spring barley overlapped, meaning that more machines/labour were needed in order to perform harvesting within the optimal periods and as a result led to increase in fixed cost.
Scaling up to the UK farming community as a whole, it was estimated that controlling A. myosuroides with a crop plan using spring barley under a scenario of low A. myosuroides infestation could cost UK arable farming about £286 million whereas under a scenario of very high A. myosuroides infestation, adoption of winter wheat–spring barley rotation as the A. myosuroides control strategy could cost UK arable farming about £35 million.
The cost of black-grass control with spring beans
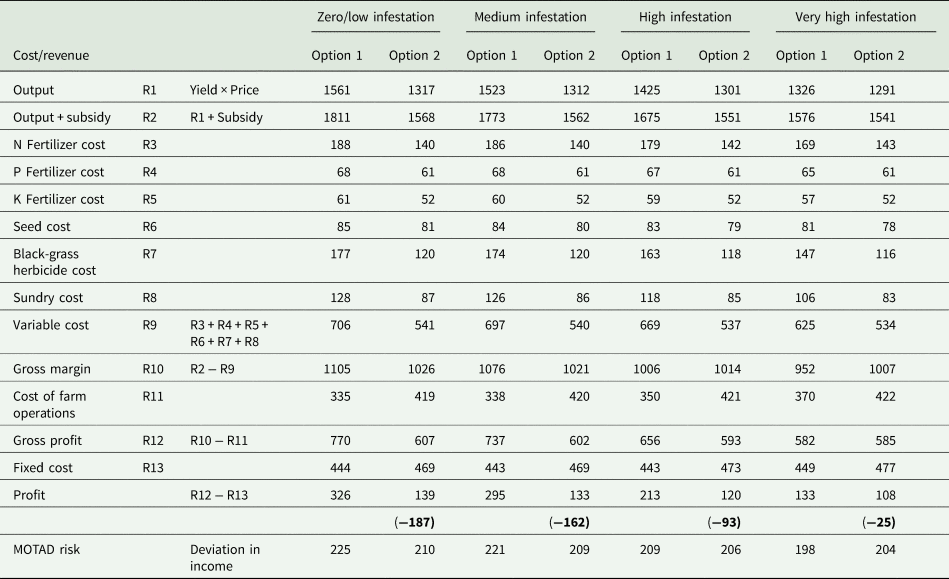
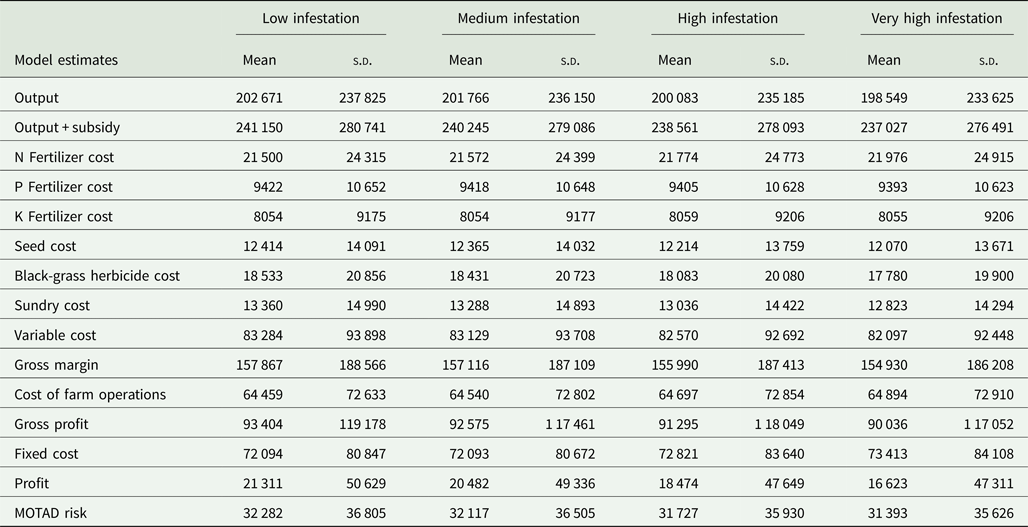
Table 4 shows the predicted aggregate costs of controlling A. myosuroides with spring beans. This strategy resulted in 57.51% reduction in profit (from £326/ha to £139/ha) under low A. myosuroides infestation (see Table 4). Under very high weed infestation, profit reduced by 18.94% (from £133/ha to £108/ha).
Aggregate revenues/costs (£) of controlling black-grass with winter wheat–spring beans rotation under four levels of black-grass infestation
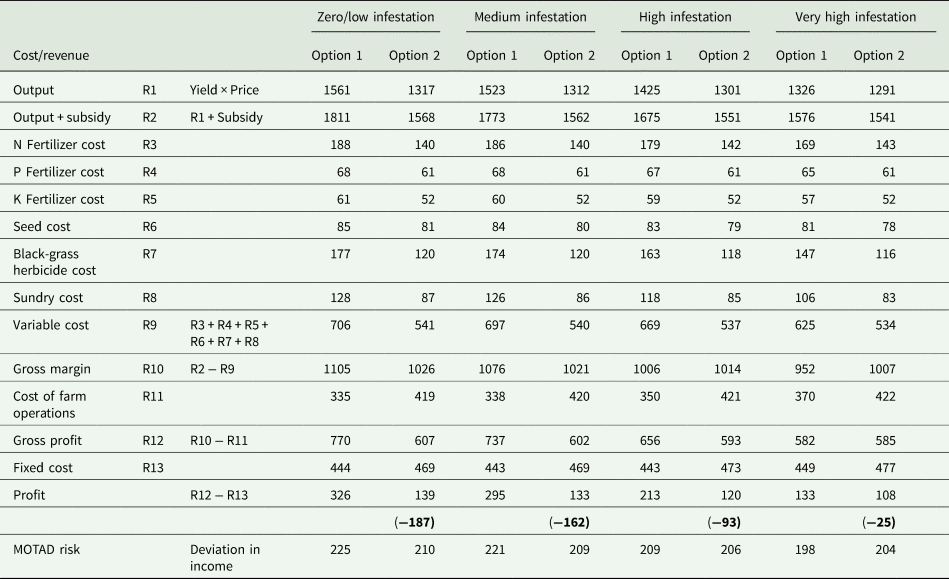
N, nitrogen; P, phosphorus; K, potassium; MOTAD, minimization of total absolute deviation.
These costs are expressed on a per hectare basis. R1–R13 represent the rows in the table. The numbers in parentheses represent the differences in Option 1 and Option 2 profits. See Tables B1 and B3 in Appendix B for the mean and standard deviation estimates of the results.
With low A. myosuroides infestation, MOTAD estimated risk also reduced by 6.81% (from £225/ha to £210/ha) but increased by 2.92% (from £198/ha to £204/ha) under very high infestation. The increase in risk under very high infestation was due to the crop combinations selected by the model after the winter wheat–spring beans rotation constraint was imposed. The gross margin estimate associated with spring beans was relatively lower than that of spring barley and as a result, with imposition of winter wheat–spring beans sequence, more land was allocated to spring barley which was associated with relatively high risk and hence the increase in the MOTAD risk.
In terms of costs, variable cost components reduced under Option 2 compared with Option 1. For example, under low infestation, N fertilizer cost reduced by 25.61% (from £188/ha to £140/ha), whereas A. myosuroides herbicide cost reduced by 32.02% (from £177/ha to £120/ha). Under very high infestation, N fertilizer reduced by 15.29% (from £169/ha to £143/ha) and chemical control cost reduced by 21.42% (from £147/ha to £116/ha). The greater reduction in N fertilizer and A. myosuroides herbicide costs was because spring beans had no N fertilizer requirement, and because other crops (spring barley and winter OSR) selected as part of the rotation had lower N fertilizer requirements and A. myosuroides chemical costs than winter wheat.
Under very high weed infestation, there was little change in the crop plan (under Option 1) when winter wheat–spring beans was imposed, hence lower reduction in herbicide costs. Farm operations and fixed costs increased by 25.16% (from £335/ha to £419/ha) and 5.55% (from £444/ha to £469/ha) respectively under low infestation. Under very high infestation, operation costs increased by 14.01% (from £370/ha to £422/ha) and fixed cost increased by 6.38% (from £448/ha to £477/ha). Comparatively, larger increases in operations and fixed costs (than under spring barley) were due to the selection of some amount of winter OSR in the rotation. In terms of harvesting work rate, spring beans and winter OSR had a slower work rate, leading to greater operation costs. Moreover, the harvesting periods of winter wheat, spring beans and spring barley overlapped meaning that more machines/labour were needed to perform the operations, leading to higher fixed cost and hence bigger reduction in profit.
At a national scale, it was estimated that adopting a winter wheat–spring beans rotation as A. myosuroides control measure under a scenario of low A. myosuroides infestation could cost UK arable farming about £650 million (£187/ha) whereas under a scenario of very high infestation, the strategy could cost UK arable farming about £87 million (£25/ha).
The cost/benefit of black-grass control at the individual farm level
The previous analyses have been aggregated across 745 farms for which FBS data were available. Within this sample there was enormous variability of course, and in this section the precise answer to the question of whether rotational control is economically costly will depend on local circumstances highlighted.
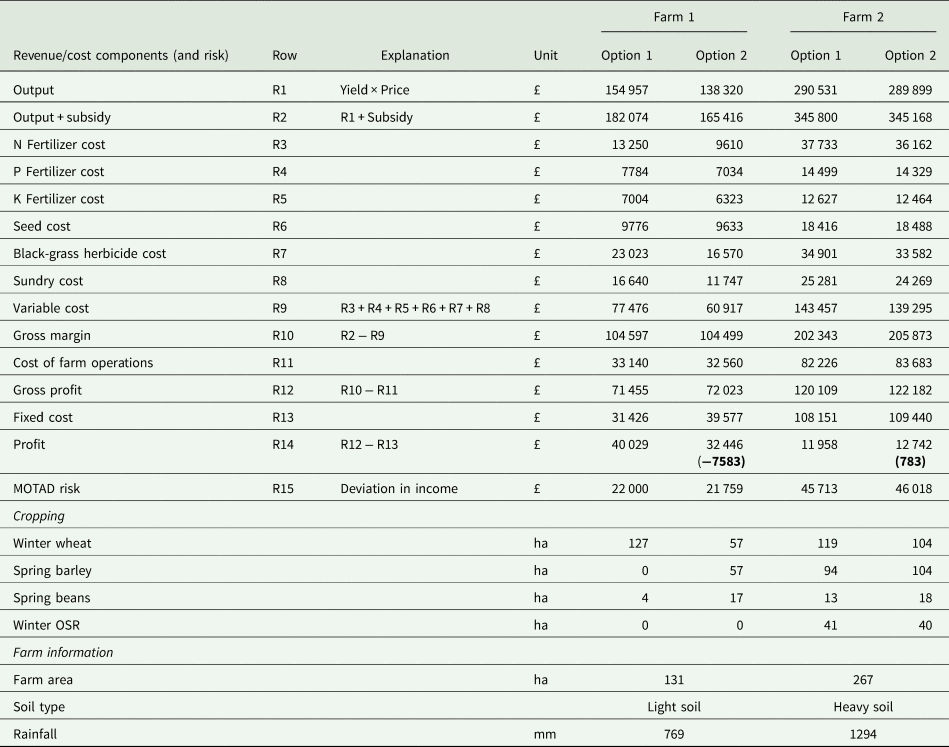
The results of two farms labelled Farm 1 and Farm 2 were used for the illustration (see Table 5). These cases were used to show that, although at the aggregate level, using winter wheat–spring crop rotation as A. myosuroides control measure could cost the arable sector, at the individual farm level, there could be either reductions (costs) or increase (benefits or gains) in farm revenue depending on the location of the farm. The dominant soil type for Farm 1 was a light soil whereas that of Farm 2 was a heavy soil. In terms of rainfall, Farm 1 was located in an area of moderate rainfall and Farm 2 was located in an area of high rainfall. In terms of the control of A. myosuroides, these two cases are significant: A. myosuroides is generally thought to be a more significant problem on heavy land with higher rainfall than on light drier land (Metcalfe et al., Reference Metcalfe, Milne, Webster, Lark, Murdoch, Kanelo and Storkey2018).
Revenues/costs estimates of controlling black-grass with winter wheat–spring barley rotation for low level of black-grass infestations
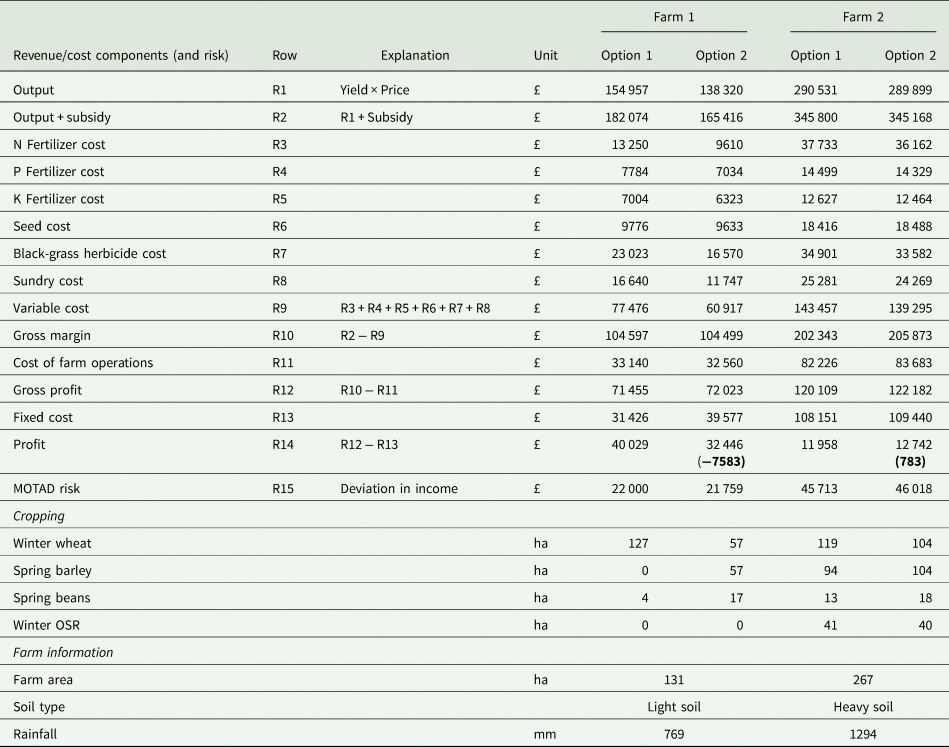
N, nitrogen; P, phosphorus; K, potassium; MOTAD, minimization of total absolute deviation.
R1–R13 represent the rows in the table. The numbers in parentheses are the difference between Option 1 and Option 2 profits.
The differences in soil type are important in terms of workability: Farm 1 had relatively more time available to perform farm operations whereas Farm 2 was restricted. This reflected in the cropping pattern of Farms 1 and 2 (see Table 5). Under Option 1 for Farm 1, about 97% (127 ha) of the land (131 ha) was allocated to winter wheat, which was the most profitable crop whereas under Farm 2 land was allocated to all the four crops in order to maximize profit, with about 45% (119 ha) of farm area (267 ha) allocated to winter wheat.
Under Option 2 for Farm 1, to be able to adopt a winter wheat–spring barley sequence as A. myosuroides control measure and maximize profit, 57 ha of winter wheat was cropped (70 ha or 55% less of 127 ha) however, under Farm 2, 104 ha (15 ha or 13% less of 119 ha) was cropped. There was no drastic reduction in the area of winter wheat, which was the most profitable crop under Farm 2, and this coupled with the selection of all the other crops, associated with lower variable costs resulted in the increase in gross margin (profit) instead of reduction observed under Farm 1.
On Farm 1, using winter wheat–spring barley rotation as A. myosuroides control reduced profit by £7583 (a cost) whereas under Farm 2 profit increased by £783 (a gain or benefit) however, risk increased under Farm 2. The increase in risk may be due to the fact that the estimate of risk was linked to gross margin estimates and hence increase in gross margin was likely to be associated with increase in risk. A farmer whose primary aim is to maximize profit with little consideration to risk is likely to accommodate high risk so as to maximize profit. In terms of herbicide cost, for Farm 1, it reduced by 28% (from £23 023 to £16 570) whereas under Farm 2, it reduced by about 4% (from £34 901 to £33 582). This was as a result of the allocation of land to all four crops under Farm 2 and hence contributed to the smaller reduction in A. myosuroides control cost. The reductions in herbicide cost shows the possibility of gains in terms of cost savings by controlling A. myosuroides with spring cropping however, in the case of Farm 1, the reduction was not big enough to offset the reduction in profit.
Discussion
The results presented in the current study indicate that, in the short-term, the costs of rotational control of A. myosuroides depend on the rotation selected as well as the initial density of the weed. The results suggest that it will cost UK arable farming more by adopting winter wheat–spring beans rotation than adopting winter wheat–spring barley rotation however, under a scenario of very high infestation, winter wheat–spring beans rotation could result in lower profit loss than under low A. myosuroides infestation. A winter wheat–spring barley rotation could cost UK arable farming between £35 million (high infestations; £10/ha) and £286 million (low infestations; £82/ha) whereas controlling A. myosuroides with winter wheat–spring beans could cost UK arable farmers between £87 million (high infestations; £25/ha) and £650 million (low infestations; £187/ha) respectively.
There are potentially long-term benefits, and the economic picture may change if a longer planning horizon is used. This is because, if successful, spring crops reduce the densities of weeds in subsequent crops. The results represent a snapshot of the impacts of alternative management strategies in the short- to medium-term.
The figures presented are averaged across a large number of farms, which masks site-to-site variation. Although there was an average reduction in profit from the use of rotational control, it has been shown that there could be reductions in variable costs and in some cases reduction in farm risk. Consequently on an individual farm basis, there are potentially economic gains from spring cropping as a strategy for controlling A. myosuroides, depending on the location of farm and the area of land available to the farmer. Given such variability, modelling tools are potentially valuable for evaluating the viability of alternative rotational strategies on a farm-by-farm basis.
Investigation of the effect of spring cropping on A. myosuroides has typically been based on field experiments (Chauvel et al., Reference Chauvel, Guillemin, Colbach and Gasquez2001; Moss and Hull, Reference Moss and Hull2012; Keshtkar et al., Reference Keshtkar, Mathiassen, Moss and Kudsk2015). However, such experiments are expensive and time consuming and do not consider economic outcomes. Models, such as the one presented in the current study, allow rapid exploration of a range of alternatives. Although some studies have applied mathematical models to investigate weed management strategies in IWM (Swinton and King, Reference Swinton and King1994; Pannell et al., Reference Pannell, Stewart, Bennett, Monjardino, Schmidt and Powles2004; Pardo et al., Reference Pardo, Riravololona and Munier-Jolain2010; Beltran et al., Reference Beltran, Pannell, Doole and White2012), none of these studies have evaluated the costs of adopting a non-chemical weed control measure across a national scale.
Lower profits from spring crops make arable farmers reluctant to adopt non-chemical weed management strategy under IWM (Chikowo et al., Reference Chikowo, Faloya, Petit and Munier-Jolain2009). Controlling A. myosuroides with spring cropping reduced overall profits owing to lower profits associated with spring crops as well as winter OSR (Nix, Reference Nix2014). Also, the reduction in profit was partly due to the increase in operations and fixed costs due to the crop combination, and the implication is that farmers need to choose cropping plans aimed at reducing labour and machinery costs through efficient labour and machinery planning (Barnard and Nix, Reference Barnard and Nix1973). Thus if arable farmers in UK were to adopt winter wheat–spring crop rotations to control A. myosuroides, the strategy needs to be combined with efficient timing or planning of operations and machinery/labour use especially in periods in which labour requirements are high.
In some cases controlling A. myosuroides with spring cropping can be economically beneficial. The current study has illustrated using two hypothetical examples that this depends on factors such as soil type, prevailing rainfall pattern and the amount of cropping land available to the farm. Although in the case of Farm 1, the selection of crops defied the three-crop rule under the greening policy, it was found that with the imposition of greening constraints, the differences in the model estimates were found to be marginal. Notwithstanding, the results showed that, for some arable farmers, controlling A. myosuroides with spring crops has the potential to be profitable due to the associated lower variable costs and the high cost of chemical control associated with winter crops (ADAS, 2007). With the inability of A. myosuroides to develop resistance to non-chemical control strategies, drawing on the benefits of non-chemical control measures such as crop sequences or rotations, in addition to ploughing and delayed sowing could make A. myosuroides control very effective (Moss and Lutman, Reference Moss and Lutman2013; HGCA, 2014b). This can reduce chemical inputs, which in turn could improve profitability and benefit the environment.
The analysis presented in the current study is most relevant to understanding the short-term economic consequences of rotational management of A. myosuroides with spring crops. In terms of long-term benefit, successful spring crops reduce the densities of weeds in subsequent crops and the mechanism for this is reduced seed input to the soil resulting from lower weed densities. This is why spring cropping has been recommended as a method to control A. myosuroides (Moss and Hull, Reference Moss and Hull2012). However the net impacts of spring cropping on A. myosuroides can be very variable across sites (Freckleton et al., Reference Freckleton, Hicks, Comont, Crook, Hull, Neve and Childs2018). At the farm level, an evaluation of the long-term economics of spring cropping requires that this variability is accounted for, and models for population dynamics of the weed are integrated with whole farm economic models. The model presented in the current study is a first step in this direction.
It is potentially important to view the impact of this modelling in a policy context. The eradication or mitigation of A. myosuroides is a major challenge and in terms of food security and environmental protection, its management provides positive public goods. The provision of positive externalities from agriculture has generally been encouraged through the adoption of the provider gets principle (Hanley et al., Reference Hanley, Kirkpatrick, Simpson and Oglethorpe1998; Hanley and Oglethorpe, Reference Hanley and Oglethorpe1999). Under a provider gets principle, the policy maker rewards the policy adopter. Thus the aggregate per hectare costs of A. myosuroides management provide us with an indication of the need for possible policy payments to incentivize adoption of the system needed to generate those positive externalities. The overall cost of £82/ha suggested by the model for imposition of the spring barley rotation would represent such a possible payment level if farmers were to adopt spring cropping after incidence of zero or low A. myosuroides infestation. However, with relatively lower loss of profit under a scenario of very high A. myosuroides infestations on winter crop fields, farmers may be better off switching to spring cropping and such payments to incentivize adoption may not be required.
The overall effect of controlling A. myosuroides with spring crops resulted in a reduction in profit, which could affect the adoption of such non-chemical strategies by arable farmers. However, with EU Sustainable Use of Pesticides Directive requiring arable farmers to give priority to non-chemical methods of plant protection (HGCA, 2014b), research using linear programming-based optimization approaches to come up with optimal profit estimates of different spring cropping strategies to control A. myosuroides could encourage farmers to adopt such non-chemical control measures as part of a package of weed control strategies.
Conclusions
The investigation of spring cropping as A. myosuroides control measure using a static mixed-integer weighted goal-programming model showed that at the aggregate level, controlling A. myosuroides with winter wheat–spring crop rotation could reduce farm revenues in UK arable farming. At the individual farm level, there could be benefits dependent on the farm's situations. The current study thus gives insight into how the adoption of weed management strategies can impact on farming goals and the need for possible payment schemes to incentivize adoption.
Financial support
This work was funded by the Grantham Centre for Sustainable Futures and BBSRC (BB/L001489/1).
Conflict of interest
None.
Ethical standards
Not applicable.
Appendix A
Appendix A: Model data and evaluation of model parameters
Sequential and non-sequential farm operations of winter wheat, spring barley, spring beans and winter oilseed rape. This was adapted from Cooke et al. (Reference Cooke, Mattison, Audsley, Bailey, Freckleton, Graves, Morris, Queenborough, Sandars, Siriwardena, Trawick, Watkinson and Sutherland2013) who adapted the model of Annetts and Audsley (Reference Annetts and Audsley2002).

Machine types and annual machinery/labour costs

Summary of crop yield, rainfall and farm area data for farms used in model validation
Black-grass chemical control cost (£/ha)

Summary of rainfall, farm area, crop yield and price data for farms used for model runs under different farm plan options

Equations of statistical measures of association


O l is the observed data for the lth observation of the parameter of interest (e.g. crop areas), P l is the model-predicted result of the lth observation of the parameter of interest (e.g. model predicted or generated crop areas), O av and P av are the means of the observed and predicted data respectively and N is the number of observations.
Estimation of yield losses due to the level of black-grass infestation
The estimates of yield losses due to black-grass infestation were averages across 10 fields based 2014 and 2015 winter wheat harvests based on a black-grass survey carried out on farms in England (The English counties in which farms were located are: Northamptonshire, Oxfordshire, Warwickshire and Yorkshire (Hicks et al., Reference Hicks, Comont, Coutts, Crook, Hull, Norris, Neve, Childs and Freckleton2018)). For each field, yield maps were overlaid with the 20 m × 20 m weed survey grid to relate wheat yield to weed density. For each field, mean yield across grid squares in each density state was estimated. To control for variation in yield between fields, the maximum mean yield from the five density states was selected as 100%, and percentage yield calculated for each density state relative to this. The data on yield loss shown in Table A5 were adopted due to inability to obtain a UK level data.
Yield reduction of winter wheat at four different levels of black-grass infestation

Appendix B
Descriptive statistics of study results
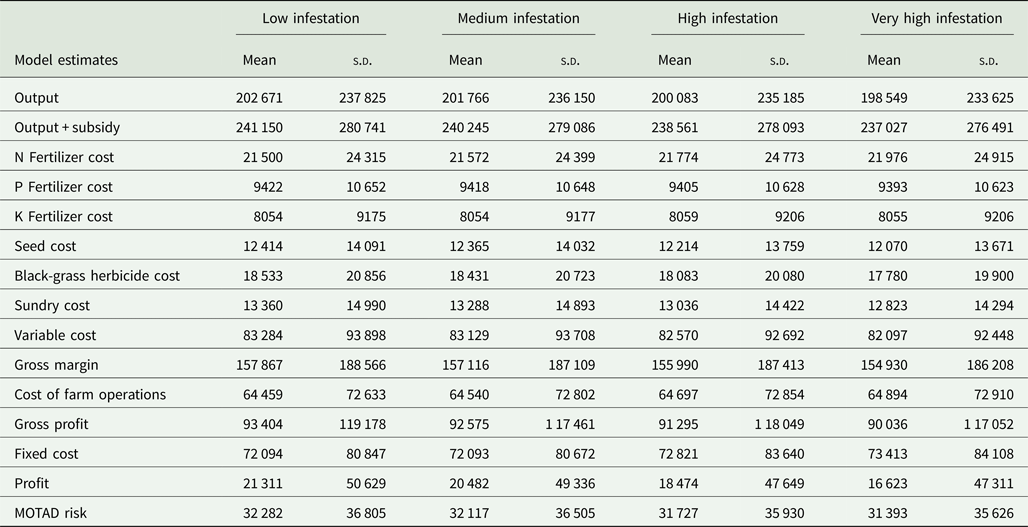
Weighted mean and standard deviation estimates of model results for 745 farms under Option 1 crop plan

Weighted mean and standard deviation estimates of model results for 745 farms under Option 2 crop plan with mandatory winter wheat–spring barley rotation
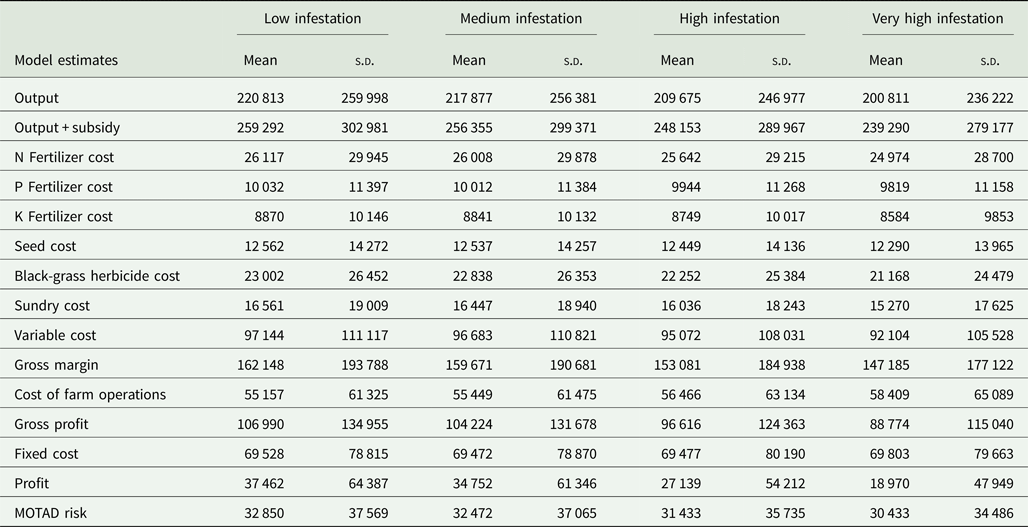
Weighted mean and standard deviation estimates of model results for 745 farms under Option 2 crop plan with mandatory winter wheat–spring beans rotation