The Pacific white shrimp, Penaeus vannamei, is one of the most economically important farmed crustaceans worldwide. Although advances in biosecurity and selective breeding have driven rapid production growth, the reproductive efficiency of broodstock and the resulting seed quality remain strongly dependent on nutritional management(1). Improving broodstock diets through precision nutrition is therefore essential for stabilising egg quality and enhancing reproductive output(Reference Racotta2,Reference Wouters, Lavens and Nieto3) . In decapod crustaceans, lipid demand increases markedly during the reproductive cycle because lipids serve as major energy reserves(Reference Zhu, He and Cao4), key structural components of yolk during vitellogenesis(Reference Subramoniam5) and precursors for steroid hormone synthesis(Reference Miller and Bose6). Accordingly, not only the dietary lipid level but also the lipid class composition and molecular architecture can critically influence ovarian maturation and offspring quality(Reference Zhu, He and Cao4,Reference Subramoniam5,Reference Fatima, Ayub and Ali7,Reference Feng, Zhao and Wang8) .
Among dietary lipids, phospholipids are repeatedly identified as indispensable nutrients for crustaceans(Reference Wouters, Lavens and Nieto3), supporting lipoprotein assembly and lipid transport and modulating membrane properties that affect signalling and reproduction(Reference Liang, Luo and Lin9). Consequently, targeted manipulation of functionally important phospholipid species may be more effective than simply increasing total dietary lipids. However, most previous work has emphasised ‘total phospholipids’ or mixed phospholipid sources(Reference Liang, Luo and Lin9–Reference Wouters, Molina and Lavens11), whereas phosphatidylethanolamine (PE) – a major aminophospholipid – has received far less attention. In particular, a clear dose–response relationship and mechanistic understanding of PE during ovarian maturation in P. vannamei broodstock are still lacking.
PE is structurally distinct from the major bilayer-forming phospholipids(Reference Cullis and De Kruijff12). Because of its conical geometry and propensity to promote negative membrane curvature(Reference Cullis and De Kruijff12), PE can modulate lipid packing(Reference Cullis and De Kruijff12), membrane deformability, vesicle budding and membrane fusion, thereby affecting intracellular trafficking and secretory processes(Reference Bigay and Antonny13). In decapod crustaceans, the hepatopancreas is the primary organ for lipid digestion, storage and export(Reference Zhu, He and Cao4,Reference Fatima, Ayub and Ali7) , and PE is abundant in both hepatopancreatic and ovarian tissues(Reference Ravid, Tietz and Khayat14). These characteristics suggest that PE could be a key determinant of membrane platforms that enable lipid mobilisation and yolk deposition during vitellogenesis. Nevertheless, direct evidence for PE-dependent lipoprotein assembly or secretion in crustaceans remains limited, and mechanistic insights are largely inferred from mammalian systems(Reference Vance and Tasseva15).
In decapods, ovarian growth depends on coordinated lipid mobilisation along the hepatopancreas–haemolymph–ovary axis(Reference Liang, Luo and Lin9). Neutral lipids and phospholipids are mobilised from the hepatopancreas(Reference Liang, Luo and Lin9), transported in the haemolymph as lipoprotein-like particles (including HDL-like fractions)(Reference Ravid, Tietz and Khayat14) and ultimately taken up and deposited by developing oocytes; vitellogenin synthesised mainly in the hepatopancreas and other extra-ovarian tissues further contributes to cargo delivery via receptor-mediated uptake in the ovary(Reference Subramoniam5). Superimposed on this nutrient-transport framework, ovarian maturation is regulated by endocrine signals such as methyl farnesoate (MF) and eyestalk neuropeptides (e.g. gonad-inhibiting hormone, GIH; molt-inhibiting hormone, MIH)(Reference Nagaraju16), which interact with nutrient-responsive intracellular pathways to shape vitellogenesis and oocyte growth(Reference Li, Zhang and Jiao17). However, how dietary PE alter lipid allocation and molecular species composition across this axis, how these changes are related to circulating lipoproteins and reproductive hormones, and whether PE modulate nutrient-sensing pathways in the ovary in a dose-dependent manner remain unclear.
Therefore, the present study aimed to systematically evaluate the effects of graded dietary PE supplementation on ovarian maturation in female P. vannamei. By integrating histological assessment, biochemical analysis, endocrine profiling, targeted gene expression and comprehensive lipidomics, this study sought to elucidate how PE modulate lipid architecture, lipid flux and nutrient‒signalling coupling along the hepatopancreas–haemolymph–ovary axis. These findings provide mechanistic insights into PE-specific nutritional regulation of reproduction and offer a scientific basis for precision formulation of broodstock diets in shrimp aquaculture.
Materials and methods
Animal ethics statement
All experimental procedures involving animals in this study were conducted in accordance with the institutional guidelines for the care and use of laboratory animals of East China Normal University. The animal ethics protocol was approved by the Animal Ethics Committee of East China Normal University (No. 20201001).
Experimental diets
In this study, dietary protein was sourced primarily from defatted fish meal, casein and gelatin. Lipids are supplied by fish oil, soybean oil, PE and cholesterol, whereas carbohydrates are derived mainly from corn starch. Defatted fish meal was used to minimise background lipid interference and to help isolate the effects of PE supplementation as clearly as possible, and cholesterol was kept constant across diets at 16·5 g/kg to maintain a consistent sterol background. The PE supplement was L-α-PE (purity ≥ 98%; CAS No. 39382-08-6), which was extracted from soybean via solvent extraction. In previous work, five semi-purified, isonitrogenous and isolipidic diets were formulated to contain 53·01 % crude protein(Reference Li, Zhang and Jiao17) and 14·04 % crude lipids(Reference Liang, Xu and Wang10). The experimental diets were supplemented with graded levels of PE (3, 6, 9, and 12 g/kg), with a PE-free diet serving as the control. Diets were prepared according to the formulation protocol, air-dried at ambient temperature, and stored at –20 °C until use(Reference Liang, Luo and Lin9). The approximate compositions of the major ingredients and finished diets were assayed via standard methods(Reference Latimer and Horwitz18), including moisture by oven drying at 105 °C to a constant weight (method 934·01), crude protein by Dumas combustion (method 968·06), crude lipids by Soxhlet extraction (method 920·39) and ash by muffle furnace incineration (method 942·05). The diet formulations and proximate compositions are summarised in Table 1.
Experimental diet formulation (g/kg dry basis) and proximate composition (% dry weight) for female P. vannamei

Table 1. Long description
A table detailing the formulation and proximate composition of experimental diets for female P. vannamei. The table has 22 rows and 6 columns. The columns are labeled with different percentages of experimental diets: 0.0 percent, 0.3 percent, 0.6 percent, 0.9 percent, and 1.2 percent. The rows are labeled with various ingredients and their respective amounts in grams per kilogram of dry basis. The ingredients include defatted fish meal, casein, gelatin, corn starch, fish oil, soybean oil, phosphatidylethanolamine, cholesterol, choline chloride, butylated hydroxytoluene, calcium dihydrogen phosphate, vitamin premix, mineral premix, cellulose, betaine, and carboxymethyl cellulose. The table also includes the total amount and the analyzed proximate composition in percentages for moisture, crude protein, crude lipid, and ash. Each row lists the specific amount of each ingredient used in the different experimental diets. The proximate composition section shows the percentages of moisture, crude protein, crude lipid, and ash for each diet formulation.
* Vitamin premix (per 1000 g premix): vitamin A acetate (500 000 IU/g), 0.480; L-ascorbyl2-polyphosphate 35 % active C, 35.710; folic acid, 0.180; 2 % biotin, 2.5; riboflavin, 3; DLCa-pantothenate, 5; 99 % pyridoxine HCl, 1 %; 1 % vitamin B12, 0.200 %; thiamine HCl, 0.500; menadione, 2; DL-alpha-tocopheryl acetate (250 IU/g), 8; nicotinic acid, 5; vitamin D3 (500 000 IU/g), 0.800; defatted rice bran, 935.630. All ingredients were filled with α cellulose to 1000 g.
† Mineral premix (per 1000 g premix): zinc sulphate monohydrate, 20.585; calcium iodate, 0.117; cupric sulphate pentahydrate, 0.625; manganous sulphate monohydrate, 1.625; magnesium sulphate monohydrate, 39.860; cobalt chloride, 0.010; ferrous sulphate monohydrate, 11.179; sodium selenite, 0.025; calcium hydrogen phosphate dihydrate, 166.442; wheat bran flour, 759.532. All ingredients were filled with α cellulose to 1000 g.
Feeding trial
Broodstocks of P. vannamei were obtained from a commercial supplier in Hainan, China. Shrimp were held in black polyethylene tanks (bottom diameter × height = 4·0 m × 1·0 m) and acclimated for 7 d while being fed the control diet. After acclimation, 210 individuals at ovarian stage I were randomly selected. Subsets were randomly sampled to determine the hepatopancreatic somatic index (HSI, 5·74 ± 0·19 %, n 10) and gonadosomatic index (GSI, 0·47 ± 0·16 %, n 10). The remaining 200 females (initial body mass = 38·3 ± 1·8 g) were randomly allocated to twenty black polyethylene tanks (1·0 m × 0·9 m; ten shrimp per tank). Each dietary treatment, including the PE-free control, was assigned to four replicate tanks. The feeding trial lasted 42 d. Tank biomass was measured every 7 d, and the daily ratio was set at 5·5 % of the total biomass. The samples were apportioned into seven equal meals at 07:30, 10:00, 13:00, 15:00, 18:00, 21:00, and 24:00. Uneaten feed and faeces were siphoned at 16:30 daily, followed by 80 % water exchange. Throughout the trial, the water quality was maintained within the following ranges: temperature 26–29 °C, pH 7·9–8·3, salinity 29·5–30·5, dissolved oxygen 5–6 mg/L, ammonia-N 0·01–0·10 mg/L and nitrite-N 0·01–0·10 mg/L; the photoperiod was 12 h light:12 h dark.
Sampling and analytical procedures
Following acclimation, the hepatopancreas and ovaries of ten shrimp were sampled to establish baseline hepatosomatic and gonadosomatic indices. Gonadal maturation was monitored by periodic assessment of gonad size and coloration. During daily water exchange, ovarian development in each individual was examined, and the developmental stage was recorded. At the end of the feeding trial, shrimp were fasted for 24 h. Prior to sampling, the shrimp were anesthetised via immersion in an ice bath for 5 min. Body mass was recorded, and sampling was performed on ice. Haemolymph was withdrawn from the pericardial sinus via a 1 mL sterile disposable syringe, allowed to clot at room temperature, and centrifuged to obtain the serum. Eyestalks (eyeballs removed) were excised with sterile surgical scissors, snap-frozen in liquid nitrogen and stored at –80 °C for subsequent analyses. For each sampled individual, the hepatopancreas and ovaries were weighed; standardised subsamples from equivalent anatomical regions were fixed in 4 % paraformaldehyde, and the remaining tissues were rapidly frozen in liquid nitrogen and stored at –80 °C for later analyses.
Preprocessing was performed on eyestalk, haemolymph, hepatopancreas, and ovary tissues. Haemolymph samples were centrifuged thoroughly and centrifuged at 3000 × g for 10 min at 4 °C in a refrigerated centrifuge (3–18KS, Sigma, Germany); the supernatant was collected for downstream analyses. Eyestalk, hepatopancreas and ovary samples were weighed, transferred to 1·5 mL microcentrifuge tubes, diluted with nine volumes of prechilled physiological saline (0·85 % NaCl) and mixed. The samples were homogenised at 60 Hz for 30 s via a tissue lyser (Tissuelyser-24), followed by centrifugation at 1500 × g for 30 min at 4 °C to remove debris; the supernatants were collected for subsequent analyses. The calculation formulas were as follows:
Weight gain (%) = 100 × (final body weight – initial body weight)/initial body weight
Specific growth rate (%/d) = 100 × (ln final body weight – ln initial body weight)/days
Feed intake (%) = 100 × (total feed offered/total days)/[(initial body weight + final body weight)/2]
Gonadosomatic index (GSI, %) = 100 × (ovary wet mass/body wet mass)
Hepatosomatic index (HSI, %) = 100 × (hepatopancreas wet mass/body wet mass)
Histological examination of the hepatopancreas and ovary
Cryosections of the hepatopancreas were prepared at uniform thickness and stained with Oil Red O. For each experimental group, three high-quality, morphologically intact sections were selected. Areas of identical size were randomly selected from each section for analysis. The relative area of lipid droplets was quantified via Image-Pro Plus 6.0.
Ovarian tissue was fixed in 4 % paraformaldehyde, followed by dehydration, washing and equilibration in ethanol, toluene and xylene. After being embedded in paraffin, the sections were cut at 5 μm thickness on a rotary microtome. Haematoxylin–eosin-stained sections were examined under a fluorescence microscope. Areas of identical size were randomly selected from each section for analysis. The oocyte area was quantified via Image-Pro Plus 6.0.
Accumulation and trafficking of key lipids along the hepatopancreas–ovary axis
Two hepatopancreas and ovary samples were randomly collected from each tank for the quantitative determination of total protein (TP), total cholesterol (TC) and TAG. In addition, serum samples were randomly collected from each tank to determine VLDL, LDL-C and HDL-C. Assay kits were obtained from Nanjing Jiancheng Bioengineering Institute (catalog numbers A045-4-2, A111-1-1-1, A110-1-1, H249-1-2, A113-1-1, and A112-1-1), and all procedures were performed strictly according to the manufacturer’s instructions. VLDL standards were prepared at 0, 0·4, 0·8, 1·6, 3·2 and 6·4 μmol/mL. The intra-assay coefficient of variation was <10 %, and the interassay coefficient of variation was <12 %. The dynamic range of the assay was 0·05–10 μmol/mL.
Determination of hormone concentrations
Two serum aliquots were randomly collected from each tank for quantification of 17β-estradiol (E2), progesterone (P4), and MF concentrations. In addition, from each tank, two eyestalk supernatant aliquots were randomly selected for quantification of GIH and MIH concentrations. The quantification of E2, P4, MF, GIH and MIH was performed via shrimp enzyme-linked immunosorbent assay kits. These assay kits were obtained from Shanghai FanTai Biotechnology Co., Ltd. (catalog numbers FT-X9147X, FT-X9S1235X, FT-X9108X, FT-Y10582X and FT-P91071T, respectively), and all assays were performed strictly in accordance with the manufacturer’s protocols. The standard concentration gradients were prepared as follows: E2, 0, 4, 8, 16, 32 and 64 pg/mL (detection range > 1·0 pg/mL); P4, 0, 1, 2, 4, 8 and 16 ng/mL (detection range > 0·1 ng/mL); MF, 0, 12·5, 25, 50, 100 and 200 ng/mL (detection range > 0·1 ng/mL); GIH, 0, 1·25, 2·5, 5, 10 and 20 ng/mL (detection range > 0·1 ng/mL); and MIH, 0, 10, 20, 40, 80 and 160 μg/mL (detection range > 0·1 μg/mL). For all assays, the standard curves showed strong linear relationships with correlation coefficients (R) ≥ 0·9900. No cross-reactivity with other structurally related soluble analogs was detected, and both intra-assay and inter-assay coefficients of variation were maintained below 15 %.
Analysis of gene expression
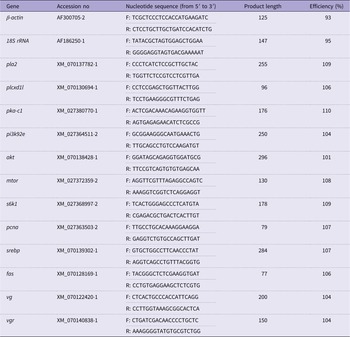
For each group, six ovarian samples were randomly selected, and total RNA was extracted from the ovary tissue via TRIzol reagent (Invitrogen, USA; cat. no. 15596018). The concentration and purity of total RNA were determined using a NanoDrop 2000 spectrophotometer (Thermo Fisher Scientific, Wilmington, USA). Subsequently, 1 μg of total RNA was reverse-transcribed into complementary DNA using a commercial reverse transcription kit (Biosharp, Anhui, China). Quantitative real-time PCR was carried out with ChamQ Universal SYBR qPCR Master Mix (Vazyme Biotech, Nanjing, China) in a final reaction volume of 20 μL. The amplification protocol consisted of an initial denaturation at 95 °C for 10 min, followed by 40 cycles of 95 °C for 10 s and 62 °C for 30 s. A melt–curve analysis was subsequently performed at 95 °C for 15 s, 60 °C for 60 s and 95 °C for 15 s to verify amplification specificity. The endogenous controls were β-actin and 18S rRNA. The relative transcript abundances of target genes – phospholipase A2 (pla2), phosphatidylinositol (PI)-PLC X domain-containing protein 1-like (plcxd1l), protein kinase, cAMP-dependent, catalytic subunit 1 (pka-c1), PI 3-kinase 92E (pi3k92e), Akt kinase (akt), serine/threonine-protein kinase Tor (mtor), ribosomal protein S6 kinase beta-1 (s6k1), proliferating cell nuclear antigen (pcna), sterol regulatory element-binding protein (srebp), fatty acid synthase (fas), vitellogenin-like (vg) and vitellogenin receptor-like (vgr) – were calculated via the 2−ΔΔCt method. The sequences of primers used for qPCR are provided in Table 2.
Primers used for quantitative real-time PCR

Table 2. Long description
A table with 15 rows and 5 columns. The columns are labeled Gene, Accession no, Nucleotide sequence (from 5′ to 3′), Product length, and Efficiency (%). The table lists primers for various genes including β-actin, 18S rRNA, pla2, plcxd1l, pka-c1, pi3k92e, akt, mtor, s6k1, pcna, srebp, fas, vg, and vgr. Each row provides the gene name, accession number, forward and reverse nucleotide sequences, product length in base pairs, and efficiency percentage. The nucleotide sequences are provided for both forward (F) and reverse (R) primers. The product lengths range from 77 to 296 base pairs, and the efficiencies range from 93 to 110 percent.
β-actin, beta-actin; 18S rRNA, 18S ribosomal RNA; pla2, phospholipase A2; plcxd1l, PI-PLC X domain-containing protein 1-like; pka-c1, protein kinase, cAMP dependent, catalytic subunit 1; pi3k92e, phosphatidylinositol 3-kinase 92E; akt, Akt kinase; mtor, serine/threonine-protein kinase Tor; s6k1, ribosomal protein S6 kinase beta-1; pcna, proliferating cell nuclear antigen; srebp, sterol regulatory element-binding protein; fas, fatty acid synthase; vg, vitellogenin-like; vgr, vitellogenin receptor-like.
Comprehensive lipidomic profiling
Three hepatopancreas and three ovary samples were randomly selected from the control and 0·6 % groups. Equal aliquots of the same tissue type from each group were pooled to generate quality-control (QC) samples. Sample preparation (MTBE method): An appropriate mass of tissue was combined with 200 μL of water and 20 μL of internal standard mixture and vortexed; 800 μL of MTBE was added and vortexed, followed by 240 μL of prechilled methanol with further vortexing. The samples were sonicated in a cold water bath for 20 min, incubated at room temperature for 30 min, and centrifuged at 14 000 × g and 10 °C for 15 min. The upper organic phase was collected and evaporated to dryness under nitrogen. The residues were reconstituted in 200 μL of 90 % (v/v) isopropanol/acetonitrile and vortexed, and a 90 μL aliquot was centrifuged at 14 000 × g and 10 °C for 15 min; the resulting supernatant was subjected to LC–MS analysis. During acquisition, samples were maintained at 10 °C in the autosampler and injected in randomised order. LC conditions: UHPLC Nexera LC-30A equipped with a C18 column; column temperature, 45 °C; flow rate, 0·30 mL/min. Mobile phase A was acetonitrile/water (6:4, v/v) with 0·1 % formic acid and 0·1 mM ammonium formate. Mobile phase B: acetonitrile/isopropanol (1:9, v/v) with 0·1 % formic acid and 0·1 mM ammonium formate. Gradient: 0–2 min, 30 % B; 2–25 min, linear to 100 % B; 25–35 min, re-equilibration at 30 % B. MS conditions: Q Exactive operated in ESI positive/negative ion modes. Source parameters: heater temperature, 300 °C; capillary temperature, 350 °C; spray voltage, 3·0 kV; S-Lens RF, 50 %; and sheath/aux/sweep gases, 45/15/1 (arb). MS1 scan range m/z 200–1800; data-dependent Top10 HCD MS2 triggered after full MS; resolving power: MS1 (m/z 200), 70 000; MS2 (m/z 200), 17 500. Data processing and quantification: Peak .detection, extraction and MS/MS annotation were performed in LipidSearch with the following parameters: precursor tolerance, 5 ppm; product tolerance, 5 ppm; and production threshold, 5 %. Absolute quantification was based on internal standard response ratios.
Analyses were conducted in RStudio (version 2024.09.0+375). Features with a QC relative sd (QC-RSD) ≤ 0·30 were retained for statistical analysis. Within the filtered dataset, identifications were enumerated at the lipid subclass level (class), and subclasses were mapped to superclasses according to the LIPID MAPS framework; entities that could not be assigned were labelled ‘other specialised lipids’. Lipid features with a QC-RSD ≤ 0·30 and non-missing classes were subjected to differential analysis.
First, total lipid abundance was assessed at the global level. Within-group normality was evaluated via the Shapiro–Wilk test, and homogeneity of variance was evaluated via Levene’s test. If both normality and homoscedasticity held, Student’s t test was applied; in the presence of variance heterogeneity, Welch’s t test was used; if either group deviated from normality, the Mann–Whitney U test was employed. Two-sided P values are reported. Second, subclass-level effects were evaluated by conducting analogous tests within each class. For molecular-level univariate comparisons, the same testing framework was used, followed by multiple-testing correction with the Benjamini–Hochberg procedure to obtain the false discovery rate (FDR).
For multivariate modelling (OPLS-DA), features with all-zero or entirely missing values were removed. Missingness was computed per lipid, and those with a missing rate ≥50 % were excluded; the remaining missing values were imputed via k-nearest neighbours (kNN). Skewness was computed for each lipid: right-skewed data (skewness > 1) were log2-transformed (a small positive constant was added to shift non-positive values), left-skewed data (skewness < –1) underwent square-root transformation, and all others were left unchanged. A small constant (1e–5) was then added, and Pareto scaling was applied. OPLS-DA was performed with ropls using predI = 1, orthoI = 2, scaleC = ‘none’, permI = 500, and 6-fold cross-validation (crossvalI = 6). Differential lipids were defined by the joint criterion P < 0·05 and VIP > 1.
Pathway analysis followed the Lipidomics Standards Initiative taxonomy: lipid classes were harmonised to construct a class→pathway map, and enrichment was tested at the lipid-class level via a set of significantly altered lipid molecules.
For correlations with the GSI, lipid variables were z-score standardised, and only lipids with ≥ 3 non-missing observations were retained. Spearman’s rank correlation (ρ) between each lipid and the GSI was computed (cor.test) to obtain nominal P values, with the FDR adjusted by Benjamini–Hochberg. Network edges were defined by nominal P < 0·05 and |P| > 0·8; node labels were displayed only for lipids with VIP > 1·5.
For predictive modelling, lipid variables were z-score standardised, and a binary response y was constructed from sample identifiers. Using caret with 3-fold stratified cross-validation, binomial logistic regression was fitted via glmnet with an elastic-net penalty (α = 0·5 or 0·3). Cross-validation over a predefined λ grid (cv.glmnet) was used to select variables with non-zero coefficients at λ_min (the minimum-error λ), yielding the LASSO candidate set. A random forest was then trained on the full feature matrix X (ntree = 500) to derive Gini-based importance (MeanDecreaseGini). Robust selection was achieved by intersecting three feature sets: (i) LASSO candidates, (ii) features exceeding the threshold Gini > mean + 1 sd, and (iii) features identified by the ‘maximum distance’ elbow on the Gini-sorted curve. To quantify the marginal contributions of individual lipids to classification, a random forest was retrained on the LASSO subset and a model was explainer constructed with DALEX; y was encoded as 0/1, per-sample SHAP values were computed to obtain local variable contributions, and the mean absolute SHAP with se was summarised across samples.
For lipid nomenclature, the following annotation system was used: lipid identifiers (e.g. POS3337, NEG1552) denote unique features detected in positive or negative ionisation modes, respectively. Lipid class abbreviations follow standard conventions: PC (phosphatidylcholine), PE, TAG, DG (diacylglycerol), PS (phosphatidylserine), PI, phosphatidylglycerol, ceramide, ceramide phosphate, sphingosine, SM (sphingomyelin), Hex1Cer (monohexosylceramide), Hex2Cer (dihexosylceramide) and wax ester. The numbers in parentheses (e.g. 40:6) indicate total carbon atoms: total double bonds in the fatty chains. Structural modifiers include “p” (plasmalogen/vinyl ether), “e” (ether linkage), “d” (dihydroxy base), “t” (trihydroxy base), “m” (methyl branching) and “+O” (hydroxylation). The ion adducts are specified as +H (protonated), +Na (sodium adduct), +NH4 (ammonium adduct), −H (deprotonated), +HCOO (formate adduct) and −CH3 (demethylated). “phSM” indicates phyto SM, and “−H2O” represents water loss during ionisation.
Integrative lipidomic analysis
Only lipids with a QC-RSD ≤ 0·30 were retained to construct hepatopancreas and ovary expression matrices. For samples shared across tissues, the corresponding matrices were concatenated column-wise to yield a joint lipid expression matrix. The merged matrix was log2(x + 1) transformed and subsequently subjected to quantile normalisation.
Weighted gene co-expression network analysis was performed to construct signed networks under three parallel strategies: (i) a joint network (hepatopancreas and ovary matrices concatenated by columns), (ii) a consensus network (blockwiseConsensusModules; cross-tissue consensus modules) and (iii) tissue-specific networks (separate networks for hepatopancreas and ovary). Soft-threshold powers were selected by scale-free topology fit (pickSoftThreshold, R 2 ≥ 0·8): joint/consensus, power = 27; hepatopancreas, 25; and ovary, 21. The core parameters were set as follows: deepSplit = 4; minModuleSize ≈ 30–50; mergeCutHeight ≈ 0·15–0·25; and networkType and TOMType both ‘signed’. For the consensus network, sensitivity was evaluated across the consensusQuantile 0·6–0·8, and module preservation was assessed with permutation testing (module preservation, n 200). Consensus module eigengenes were computed from the across-tissue average expression of shared lipids per sample.
Module–phenotype associations were quantified by Pearson’s correlations between module eigengenes and the GSI: in the joint network, significant modules were defined by P < 0·05; in the consensus and tissue-specific networks, |r| > 0·3 was used as the significance threshold. For individual lipids, gene significance (GS; lipid–phenotype correlation) and module membership (lipid–module eigengenes correlation) were computed. Within the significant modules, lipids meeting |GS| > 0·5 and at least one | module membership | > 0·8 were designated hub lipids.
Within each hub set, pairwise Pearson’s correlations were computed to construct undirected graphs (igraph). The thresholds were |r| > 0·8 for the same-tissue and joint networks. For the cross-tissue interaction network, pairwise correlations between hepatopancreas hubs and ovary hubs (hub_H × hub_O) were filtered by |r| > 0·9 and bilateral |GS| > 0·6, with an additional 95th-percentile |r| cut-off to control edge density. Force-directed layouts were used; node size was mapped to degree or |GS|; node colour encoded tissue or module; and top-degree nodes were annotated. The lipid class distributions of key nodes were summarised to aid in biological interpretation.
Hub sets from five sources (joint, consensus, hepatopancreas, ovary and cross-tissue interactions) were aggregated. Candidate key lipids were defined by an occurrence count ≥ 3 across these sources, and overlaps were visualised with a Venn diagram. For the core candidates, Pearson’s correlations with the GSI were tested individually and adjusted via the Benjamini–Hochberg procedure (significance P < 0·05). Bubble plots were used to display the effect direction and statistical significance.
Statistical analysis
Outliers in the experimental dataset (excluding omics data) were identified and removed using the boxplot approach based on the interquartile range. According to Tukey’s rule, observations falling below Q1 − 1·5 × interquartile range or above Q3 + 1·5 × interquartile range were considered outliers and excluded from subsequent analyses. The processed data were then examined for normal distribution using the Shapiro–Wilk test and for homogeneity of variances using Bartlett’s test. After confirming normality and homogeneity of variances, one-way ANOVA was conducted. The statistical model applied for the one-way ANOVA was:
 ${Y_{ij}} = \mu + {T_i} + {e_{ij}},$
where Yij denotes the observation from the j-th experimental unit in the i-th treatment group; μ is the overall mean across all groups; Ti represents the deviation of the i-th treatment mean from the overall mean; and eij is the random error term, which is assumed to follow a normal distribution with mean 0 and variance s2.
Subsequently, Duncan’s multiple range test was employed to compare differences among treatment groups, with distinct superscript letters indicating statistically significant differences (P < 0·05). Data presented in the tables are expressed as the mean values with se of the mean (sem). In addition, orthogonal polynomial contrasts were used to assess potential dose-dependent trends across the graded levels of dietary PE supplementation. For selected variables, dose–response relationships were further evaluated using regression models:
 ${Y_i} = {\beta _0} + {\beta _1} \cdot {E_i} + {\beta _2} \cdot {\left( {P{E_i}} \right)^2} + {\varepsilon _i},$
where Yi denotes the observed mean corresponding to the i-th level of PE inclusion; β0 is the intercept term, representing the theoretical expected value of the trait when PE inclusion is 0; β1 is the linear regression coefficient, describing the linear trend in the trait per unit increase in the PE level; β2 is the quadratic regression coefficient, capturing the curvature of the dose–response relationship and thus characterising potential nonlinear (e.g. increase–decrease) biological responses; PEi is the actual PE inclusion level (% dry matter) for the i-th treatment; and ϵi is the random error term, assumed to follow a normal distribution with mean 0 and variance s2.
All data management and statistical analyses were conducted using RStudio (version 2024.09.0+375).
Results
Ovarian and hepatopancreatic development
Dietary PE elicited a clear nonlinear response in ovarian development. The GSI followed a bell-shaped pattern and peaked in the 0·6 % group, which was significantly greater than that in both the 0·0 % and the 1·2 % groups (P < 0·05; Table 3). The 0·3 % and 0·9 % groups presented intermediate values: the GSI in the 0·3 % group did not differ from those in the 0·0 %, 0·9 %, or 1·2 % groups (P > 0·05) but was lower than that in the 0·6 % group (P < 0·05), whereas the 0·9 % group differed from only the 0·0 % group (P < 0·05; Table 3). The HSI exhibited the opposite trend, decreasing and then increasing as dietary PE increased (Table 3). The lowest HSI occurred in the 0·6 % group, which was significantly lower than that in the 0·0 % group (P < 0·05). The 0·0 % group presented the highest HSI, followed by the 1·2 % group; no significant differences were detected between the 1·2 % group and the 0·3 % or 0·9 % groups (P > 0·05; Table 3).
Effects of dietary phosphatidylethanolamine on the phenotypic parameters of P. vannamei *

Table 3. Long description
The table presents data on the effects of dietary phosphatidylethanolamine on various phenotypic parameters of P. vannamei. It includes six groups with different percentages of dietary phosphatidylethanolamine (0.0%, 0.3%, 0.6%, 0.9%, and 1.2%) and their corresponding mean values and standard errors of the mean (SEM) for several items. The items measured include initial body weight (IBW), final body weight (FBW), weight gain (WG), specific growth rate (SGR), feed intake (FI), gonadosomatic index (GSI), hepatosomatic index (HSI), and various stages of ovarian development (N, I, II, III, IV). The table also includes ANOVA and regression analysis P-values for linear and quadratic trends. Each row provides the mean and SEM for each group, and the ANOVA and regression analysis P-values are listed at the end of each row. Notable trends include the bell-shaped pattern of GSI and the inverse trend of HSI with increasing dietary phosphatidylethanolamine.
IBW = initial body weight; FBW = final body weight; WG = weight gain rate; SGR = specific growth rate; FI = daily feed intake; GSI = gonadosomatic index; HSI = hepatosomatic index; TD = time duration; N = elapsed time from the onset of the experiment to stage I and subsequent ovarian recovery; Ⅰ = duration of ovarian stage I; Ⅱ = duration of ovarian stage II; Ⅲ = duration of ovarian stage III; IV = duration of ovarian stage IV.
a,b,cWithin a row, means without a common superscript differ at P < 0·05.
* All values are expressed as means. For IBW, FBW, WG, SGR and FI, each treatment included four replicate tanks (n 4). For GSI and HSI, four shrimp were sampled per treatment (n 4). For TD, n represents the number of occurrences recorded for each ovarian developmental stage within each treatment; therefore, the sample size varied among developmental stages (n 55–88).
The time course of ovarian staging indicated that the duration of stages N, I, and IV was not significantly affected by dietary PE (Table 3). In contrast, progression through stage II accelerated in the 0·6 %, 0·9 %, and 1·2 % groups, with stage II in the 0·6 % group being nearly 2 d shorter than that in the control group. Stage III was also shortened most markedly in the 0·6 % group; except for comparisons involving the control, the differences among the remaining treatments were not significant (Table 3).
Histological observation of the ovaries via haematoxylin–eosin staining further revealed PE-dependent differences in oocyte development (Figure 1). The oocytes in the control group were smaller and contained fewer yolk granules with poorly defined cortical rods (Figure 1a), resulting in the smallest oocyte area (Figure 1f). The 0·3 % group showed partial improvement, characterised by scattered yolk-granule deposition and limited cortical rods (Figure 1b). The 0·6 % group exhibited the most advanced morphology, with oocytes densely packed with yolk granules and abundant, intact cortical rods (Figure 1c), and had the largest oocyte area, significantly exceeding that of the 0·0 % and 0·3 % groups (P < 0·05; Figure 1f). Although yolk granules and cortical rods remained evident in the 0·9 % and 1·2 % groups (Figure 1d–e), the oocyte area decreased relative to that in the 0·6 % group and did not further improve (Figure 1f).
Histological characterisation of ovarian tissue from P. vannamei under graded dietary phosphatidylethanolamine conditions. (a) 0·0 %, (b) 0·3 %, (c) 0·6 %, (d) 0·9 %, (e) 1·2 %, (f) mean oocyte area in the ovary. The orange arrows indicate yolk granules; the blue arrows indicate cortical rods. The values are presented as the means ± se (n 3, three shrimp per treatment). Different lowercase superscript letters denote significant differences among groups.

Oil Red O staining of the hepatopancreas demonstrated that dietary PE also modified lipid droplet deposition patterns (Figure 2). The control group presented fewer and smaller lipid droplets (Figure 2a), corresponding to the lowest relative lipid droplet area (Figure 2f). The lipid droplet area increased in the 0·3 % group (Figure 2b) and reached a maximum in the 0·6 % group, which presented the most intense staining, with abundant droplets distributed throughout the tubule parenchyma (Figure 2c; P < 0·05 v. 0·0 % and 0·3 %; Figure 2f). In the 0·9 % and 1·2 % groups, the droplets remained abundant, but the overall droplet area was slightly reduced relative to that in the 0·6 % group (Figure 2d–f).
Effects of graded dietary phosphatidylethanolamine on hepatopancreatic lipid accumulation in P. vannamei. (a) 0·0 %, (b) 0·3 %, (c) 0·6 %, (d) 0·9 %, (e) 1·2 %, (f) relative area of lipid droplets in the hepatopancreas. The data are presented as the means ± se (n 3, three shrimp per treatment). Different lowercase superscript letters indicate significant differences among groups.

Figure 2. Long description
The image contains five microscopic photos and one bar graph. Panel A: Microscopic image of hepatopancreas tissue in shrimp with 0.0 percent dietary phosphatidylethanolamine supplementation. Lipid droplets are visible. Panel B: Microscopic image of hepatopancreas tissue in shrimp with 0.3 percent dietary phosphatidylethanolamine supplementation. Lipid droplets are visible. Panel C: Microscopic image of hepatopancreas tissue in shrimp with 0.6 percent dietary phosphatidylethanolamine supplementation. Lipid droplets are visible. Panel D: Microscopic image of hepatopancreas tissue in shrimp with 0.9 percent dietary phosphatidylethanolamine supplementation. Lipid droplets are visible. Panel E: Microscopic image of hepatopancreas tissue in shrimp with 1.2 percent dietary phosphatidylethanolamine supplementation. Lipid droplets are visible. Panel F: Bar graph showing the relative lipid droplet area in the hepatopancreas of shrimp with varying levels of dietary phosphatidylethanolamine supplementation. The x-axis represents the supplementation level of phosphatidylethanolamine in percent, and the y-axis represents the relative lipid droplet area in percent. Different lowercase superscript letters indicate significant differences among groups.
Ovarian and hepatopancreatic nutrient deposition
Dietary PE significantly altered the hepatopancreatic biochemical composition (Table 4). The TP content of the hepatopancreas increased overall with increasing PE, and that of the 1·2 % group was significantly greater than that of the 0·3 % group (P < 0·05), whereas no other between-group differences were detected (P > 0·05; Table 4). In contrast, hepatopancreatic TC (T-CHO) and TAG were significantly lower in all PE-supplemented groups than in the control group (P < 0·05), with no significant differences among the PE-supplemented treatments (P > 0·05; Table 4).
Effects of different phosphatidylethanolamine levels on the protein and lipid biochemical composition of P. vannamei *

Table 4. Long description
A table with six columns and twelve rows, including headers and grouped rows. The columns are labeled as Groups with percentages (0.0 percent, 0.3 percent, 0.6 percent, 0.9 percent, 1.2 percent), Mean, SEM, ANOVA P-value, and Regression analysis P-values (Linear, Quadratic). The rows are grouped into two main categories: Hepatopancreas and Ovary, each with three items: TP (g per L), TC (10 to the power of negative 2 mmol per gprot), and TAG (mmol per gprot). Each row provides mean values and standard error of the mean (SEM) for each group. Notable trends include variations in TP, TC, and TAG levels across different phosphatidylethanolamine levels in both Hepatopancreas and Ovary.
TP = total protein; TC = total cholesterol.
a,b Within a row, means without a common superscript differ at P < 0·05.
* All values are expressed as means. For TP, TC and TAG, eight shrimp were sampled per treatment (n 8).
In the ovary, TP and T-CHO were not significantly affected by dietary PE (P > 0·05; Table 4). However, the ovarian TAG content differed significantly among the treatments (P < 0·05; Table 4): the 0·6 % and 0·9 % groups presented greater TAG contents than did the 0·0 %, 0·3 %, and 1·2 % groups, among which no significant differences were detected (Table 4).
Lipid transport
Dietary PE significantly influenced the serum lipoprotein profile (Table 5). Serum HDL-C and LDL-C differed among the treatment groups (P < 0·05; Table 5), whereas VLDL did not (P > 0·05; Table 5). HDL-C showed an overall decreasing tendency with increasing PE; that of the 1·2 % group was significantly lower than that of the 0·0 % and 0·6 % groups (P < 0·05) and that of the 0·9 % group was intermediate (Table 5). LDL-C concentrations were significantly lower in the 0·6 % and 1·2 % groups than in the 0·0 % and 0·3 % groups (P < 0·05), whereas the 0·9 % group did not differ significantly from the other treatment groups (P > 0·05; Table 5). VLDL levels were comparable among the treatment groups (Table 5).
Effects of different phosphatidylethanolamine concentrations on the serum biochemical composition of P. vannamei *

Table 5. Long description
The table presents data on the effects of different phosphatidylethanolamine (PE) concentrations on the serum lipoprotein profile of P. vannamei. It includes six columns for different PE concentrations (0.0 percent, 0.3 percent, 0.6 percent, 0.9 percent, and 1.2 percent) and three rows for different lipoprotein measurements (HDL-C, LDL-C, and VLDL). Each column shows the mean and standard error of the mean (SEM) for each measurement. The table also includes ANOVA and regression analysis results with P-values for linear and quadratic trends. Row 1: HDL-C, mmol per liter. Row 2: LDL-C, mmol per liter. Row 3: VLDL, micromoles per milliliter. The table shows that HDL-C and LDL-C levels vary significantly among the treatment groups, while VLDL levels do not. HDL-C shows a decreasing trend with increasing PE concentration, and LDL-C levels are lower in the 0.6 percent and 1.2 percent groups compared to the 0.0 percent and 0.3 percent groups.
a,b,cWithin a row, means without a common superscript differ at P < 0·05.
* All values are expressed as means. For HDL-C, LDL-C and VLDL, eight shrimp were sampled per treatment (n 8).
Hormonal regulation of reproduction
Dietary PE supplementation produced distinct endocrine responses (Table 6). The serum 17β-estradiol (E2) and progesterone (P4) concentrations increased with PE inclusion, and the concentrations in the 0·6–1·2 % groups were significantly greater than those in the 0·0 % and 0·3 % groups (P < 0·05; Table 6). In the eyestalk, the level of GIH was generally greater in the PE-supplemented groups than in the control group, with marked increases in the 0·6 % and 1·2 % groups (P < 0·05; Table 6). In contrast, the contents of MF and MIH did not differ significantly among the treatments (P > 0·05; Table 6). Quadratic regression based on the normalised GSI and HSI indicated that the optimal PE supplementation level was 0·67 %–0·68 % on a dry-matter basis (Figure 4a).
Effects of different phosphatidylethanolamine concentrations on serum and eyestalk hormone levels in P. vannamei *

Table 6. Long description
The table presents data on the effects of different phosphatidylethanolamine concentrations on serum and eyestalk hormone levels in P. vannamei. It has 10 columns and 6 rows, including headers. The columns are labeled with phosphatidylethanolamine concentrations (0.0%, 0.3%, 0.6%, 0.9%, 1.2%) and statistical analysis (ANOVA, Regression analysis). The rows are labeled with hormone items (Serum: E2, P4, MF; Eyestalk: GIH, MIH). Each concentration column contains mean values and standard error of the mean (SEM) for each hormone item. The ANOVA and Regression analysis columns provide P-values for linear and quadratic regression. Notable trends include increasing serum E2 and P4 concentrations with higher phosphatidylethanolamine levels, significant differences in GIH levels in the eyestalk, and no significant differences in MF and MIH levels.
E2 = 17β-estradiol; P4 = progesterone; MF = methyl farnesoate; GIH = gonad-inhibiting hormone; MIH = molt-inhibiting hormone.
a,b,c Within a row, means without a common superscript differ at P < 0·05.
* All values are expressed as means. For E2, P4, MF, GIH and MIH, eight shrimp were sampled per treatment (n 8).
Effects of graded dietary phosphatidylethanolamine on gene expression in P. vannamei. Relative mRNA expression of (a) phospholipase A2; (b) PI-PLC X domain-containing protein 1-like; (c) protein kinase, cAMP-dependent, catalytic subunit 1; (d) phosphatidylinositol 3-kinase 92E; (e) Akt kinase; (f) serine/threonine-protein kinase Tor; (g) ribosomal protein S6 kinase beta-1; (h) proliferating cell nuclear antigen; (i) sterol regulatory element-binding protein; (j) fatty acid synthase; (k) vitellogenin-like; (l) vitellogenin receptor-like. The values are presented as the means ± se (n 6, 6 shrimp per treatment). Different lowercase superscript letters indicate significant differences among groups.

Figure 3. Long description
Panel A: A bar graph comparing the relative mRNA expression of phospholipase A2 across different dietary phosphatidylethanolamine levels (0.0 percent, 0.3 percent, 0.6 percent, 0.9 percent, 1.2 percent). The horizontal axis represents the dietary phosphatidylethanolamine levels, and the vertical axis represents the relative mRNA expression. The bars are vertical and color-coded. The expression levels increase with higher dietary phosphatidylethanolamine levels, with significant differences indicated by different lowercase letters. Panel B: A bar graph comparing the relative mRNA expression of PI-PLC X domain-containing protein 1-like across different dietary phosphatidylethanolamine levels. The horizontal axis represents the dietary phosphatidylethanolamine levels, and the vertical axis represents the relative mRNA expression. The bars are vertical and color-coded. The expression levels increase with higher dietary phosphatidylethanolamine levels, with significant differences indicated by different lowercase letters. Panel C: A bar graph comparing the relative mRNA expression of protein kinase, cAMP-dependent, catalytic subunit 1 across different dietary phosphatidylethanolamine levels. The horizontal axis represents the dietary phosphatidylethanolamine levels, and the vertical axis represents the relative mRNA expression. The bars are vertical and color-coded. The expression levels vary with different dietary phosphatidylethanolamine levels, with significant differences indicated by different lowercase letters. Panel D: A bar graph comparing the relative mRNA expression of phosphatidylinositol 3-kinase 92E across different dietary phosphatidylethanolamine levels. The horizontal axis represents the dietary phosphatidylethanolamine levels, and the vertical axis represents the relative mRNA expression. The bars are vertical and color-coded. The expression levels vary with different dietary phosphatidylethanolamine levels, with significant differences indicated by different lowercase letters. Panel E: A bar graph comparing the relative mRNA expression of Akt kinase across different dietary phosphatidylethanolamine levels. The horizontal axis represents the dietary phosphatidylethanolamine levels, and the vertical axis represents the relative mRNA expression. The bars are vertical and color-coded. The expression levels increase with higher dietary phosphatidylethanolamine levels, with significant differences indicated by different lowercase letters. Panel F: A bar graph comparing the relative mRNA expression of serine/threonine-protein kinase Tor across different dietary phosphatidylethanolamine levels. The horizontal axis represents the dietary phosphatidylethanolamine levels, and the vertical axis represents the relative mRNA expression. The bars are vertical and color-coded. The expression levels increase with higher dietary phosphatidylethanolamine levels, with significant differences indicated by different lowercase letters. Panel G: A bar graph comparing the relative mRNA expression of ribosomal protein S6 kinase beta-1 across different dietary phosphatidylethanolamine levels. The horizontal axis represents the dietary phosphatidylethanolamine levels, and the vertical axis represents the relative mRNA expression. The bars are vertical and color-coded. The expression levels increase with higher dietary phosphatidylethanolamine levels, with significant differences indicated by different lowercase letters. Panel H: A bar graph comparing the relative mRNA expression of proliferating cell nuclear antigen across different dietary phosphatidylethanolamine levels. The horizontal axis represents the dietary phosphatidylethanolamine levels, and the vertical axis represents the relative mRNA expression. The bars are vertical and color-coded. The expression levels increase with higher dietary phosphatidylethanolamine levels, with significant differences indicated by different lowercase letters. Panel I: A bar graph comparing the relative mRNA expression of sterol regulatory element-binding protein across different dietary phosphatidylethanolamine levels. The horizontal axis represents the dietary phosphatidylethanolamine levels, and the vertical axis represents the relative mRNA expression. The bars are vertical and color-coded. The expression levels vary with different dietary phosphatidylethanolamine levels, with significant differences indicated by different lowercase letters. Panel J: A bar graph comparing the relative mRNA expression of fatty acid synthase across different dietary phosphatidylethanolamine levels. The horizontal axis represents the dietary phosphatidylethanolamine levels, and the vertical axis represents the relative mRNA expression. The bars are vertical and color-coded. The expression levels increase with higher dietary phosphatidylethanolamine levels, with significant differences indicated by different lowercase letters. Panel K: A bar graph comparing the relative mRNA expression of vitellogenin-like across different dietary phosphatidylethanolamine levels. The horizontal axis represents the dietary phosphatidylethanolamine levels, and the vertical axis represents the relative mRNA expression. The bars are vertical and color-coded. The expression levels increase with higher dietary phosphatidylethanolamine levels, with significant differences indicated by different lowercase letters. Panel L: A bar graph comparing the relative mRNA expression of vitellogenin receptor-like across different dietary phosphatidylethanolamine levels. The horizontal axis represents the dietary phosphatidylethanolamine levels, and the vertical axis represents the relative mRNA expression. The bars are vertical and color-coded. The expression levels increase with higher dietary phosphatidylethanolamine levels, with significant differences indicated by different lowercase letters.
Curve fitting of standardised physiological parameters in female P. vannamei (a) and lipid class composition and molecular species counts in the hepatopancreas (b) and ovary (c) lipidomes.

Gene expression analysis
PE supplementation markedly affected the expression of genes involved in the PI3K/Akt/mTOR signalling pathway, lipid biosynthesis and vitellogenesis (Figure 3a–l). The mRNA expression of pla2, plcxd1l, pka-c1 and pi3k92e generally increased with increasing dietary PE levels, with pla2, plcxd1l and pka-c1 reaching maximal expression in the 1·2 % group, whereas pi3k92e peaked in the 0·6 % group (P < 0·05; Figure 3a–d). Consistently, the mRNA expression of akt, mtor and s6k1 was significantly greater in the 0·6–1·2 % groups than in the 0·0–0·3 % groups (P < 0·05; Figure 3e–g); akt expression was highest in the 0·9 % group, whereas mtor and s6k1 remained at relatively high levels in the 0·6 % and 1·2 % groups. Similarly, the cell proliferation marker pcna was significantly up-regulated in the 0·6–1·2 % groups, with a peak in the 0·6 % group (P < 0·05; Figure 3h). The mRNA expression of the lipid metabolism-related genes srebp and fas increased progressively with PE addition, and the high-supplemented groups (0·9–1·2 %) presented markedly higher levels than did the low-supplemented groups (P < 0·05; Figure 3i, j). Moreover, the mRNA expression of the vitellogenin and vitellogenin receptor genes (vg and vgr) was significantly elevated in the 0·6–1·2 % groups, with the highest expression observed in the 0·9 % group (P < 0·05; Figure 3k, l).
Lipidomic remodelling in the hepatopancreas and ovary
Comprehensive lipidomics identified seven lipid superclasses across the hepatopancreas and ovary: glycerophospholipids, glycerolipids, sphingolipids, glycolipids, sterols, fatty acid derivatives and metabolic cofactors (Figure 4b–c). GP accounted for the greatest diversity of molecular species in both tissues, dominated by PC (738 species) and PE (461 species) (Figure 4b–c). TAG were the most diverse subclass overall (1016 species detected in both tissues), which is consistent with their central role in energy storage (Figure 4b–c). Multiple sphingolipid subclasses with broadly similar distributions between tissues were also detected, whereas glycolipids were rare (approximately 1–9 species). Sterols and fatty acid derivatives were represented by fewer molecular species but showed comparable patterns across tissues (Figure 4b–c).
Hepatopancreas. The total lipid abundance did not differ significantly between the 0·6 % and 0·0 % groups (P = 0·786; Figure 5a). Among the forty-four subclasses, significant differences were detected only for ZyE (sterols; P = 0·014) and sphingosine (P = 0·025) (Figure 5b), whereas PC and PE tended to increase without reaching significance (P > 0·05). OPLS-DA demonstrated clear separation between groups (predictive component, 7·0 %; orthogonal component, 79·6 %; Figure 5c). On the basis of the combined criteria P < 0·05 and VIP > 1, 35 differential lipids were identified, including twenty-eight up-regulated and seven down-regulated lipids. The up-regulated lipids were enriched in the PE group, whereas the down-regulated lipids were enriched in the PC, PS and TAG groups (Figure 5d).
Effects of dietary phosphatidylethanolamine on the hepatopancreatic lipid composition of P. vannamei. (a) Total lipid content; (b) distribution of lipid subclass abundances; (c) orthogonal partial least squares discriminant analysis (OPLS-DA) score plot; (d) volcano plot of differentially abundant metabolites.

Ovary. The total lipid abundance was greater in the 0·6 % group than in the control group but did not reach statistical significance (P = 0·367; Figure 6a). Among the subclasses, lysophosphatidylserine (LPS) and SM were significantly increased in the 0·6 % group (P = 0·027 and 0·049, respectively; Figure 6b), whereas the other subclasses were not significantly different. OPLS-DA likewise displayed clear group separation (predictive component 19·6 %; orthogonal component 45·3 %; Figure 6c). Using P < 0·05 and VIP > 1, twenty differential lipids were identified (nineteen up-regulated and one down-regulated). The up-regulated species were mainly TAG, PC, PI, PE and SM; the single down-regulated lipid was Hex1Cer (Figure 6d).
Effects of dietary phosphatidylethanolamine on the ovarian lipid composition of female P. vannamei. (a) Total lipid content; (b) distribution of lipid subclass abundances; (c) OPLS–DA score plot; (d) volcano plot of differentially abundant metabolites.

Figure 6. Long description
Panel A: A vertical bar graph shows the total lipid content in the ovary for two groups, 0.0 percent and 0.6 percent. The y-axis represents the total lipid content in micrograms per gram, and the x-axis shows the two groups. The p-value is 0.367, indicating no significant difference between the groups. Panel B: A vertical bar graph displays the distribution of lipid subclass abundances in the ovary for the same two groups. The y-axis represents the log10 of lipid content in micrograms per gram, and the x-axis lists various lipid classes. Each lipid class has a corresponding p-value indicating the significance of the difference between the groups. Panel C: A scatter plot, labeled as an OPLS-DA score plot, compares the 0.0 percent and 0.6 percent groups. The x-axis is the predictive component (19.6 percent), and the y-axis is the orthogonal component (45.3 percent). The plot shows distinct clustering of the two groups. Panel D: A volcano plot illustrates the differentially abundant metabolites between the two groups. The x-axis represents the log2 fold change, and the y-axis represents the negative log10 p-value. Metabolites are categorized into four groups: strongly up-regulated, up-regulated, strongly down-regulated, and down-regulated, with different colors indicating these categories.
Lipid pathway signals and lipid–phenotype association networks
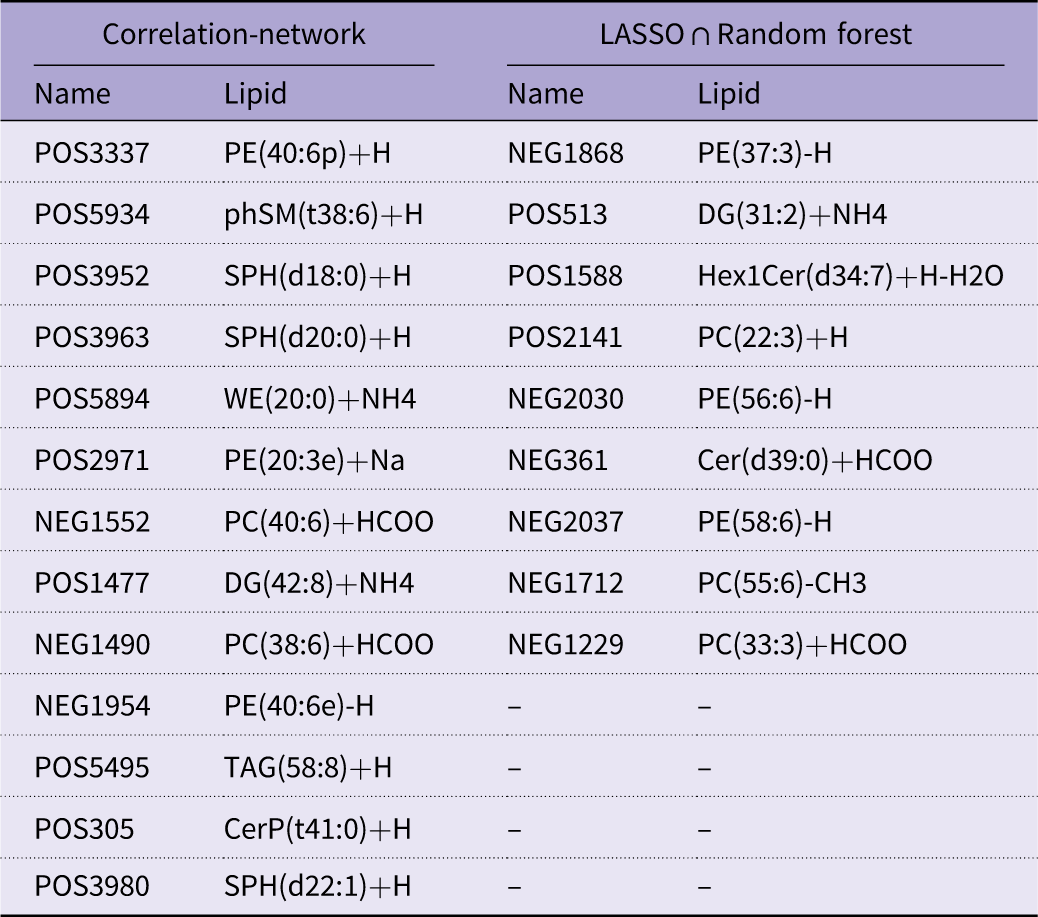
In the hepatopancreas, pathway enrichment of differential lipids highlighted five pathways, with sphingolipid metabolism and glycerophospholipid metabolism containing the largest numbers of altered lipid categories (Figure 7a). A lipid–GSI correlation network comprised 148 lipid nodes (ninety-two glycerophospholipids, thirty-six sphingolipids, twelve glycerolipids, one glycolipid, six fatty acid derivatives and one metabolic cofactor), and thirteen features had a VIP > 1·5 (Table 7; Figure 7(b)). Feature selection integrating LASSO (α = 0·5) and random forest (Gini importance) prioritised nine candidate lipids (Table 7). SHAP analysis further ranked their contributions (Figure 7c), with POS2141, POS1588 and NEG2037 among the top contributors.
Pathway enrichment of differentially abundant hepatopancreatic lipids, their correlation network with the gonadosomatic index (GSI) and key lipid biomarkers. (a) Bubble plot of lipid pathway enrichment; (b) lipid–GSI correlation network; (c) SHAP importance of key lipid biomarkers (mean ± se).

Hepatopancreas lipid candidates from two selection routes displayed side by side: correlation network v. multivariate selection (LASSO at λmin intersected with random forest)

Table 7. Long description
The table presents a comparison of lipid names and their corresponding identifiers from two different selection methods: Correlation-network and LASSO ∩ Random forest. It consists of two columns for each method, with the first column listing the names and the second column listing the corresponding lipid identifiers. The table has 14 rows and 4 columns. Row 1: POS3337, PE(40:6p)+H, NEG1868, PE(37:3)-H. Row 2: POS5934, phSM(38:6)+H, POS513, DG(31:2)+NH4. Row 3: POS3952, SPH(d18:0)+H, POS1588, Hex1Cer(d34:7)+H-H2O. Row 4: POS3963, SPH(d20:0)+H, POS2141, PC(22:3)+H. Row 5: POS5894, WE(20:0)+NH4, NEG2030, PE(56:6)-H. Row 6: POS2971, PE(20:3e)+Na, NEG361, Cer(d39:0)+HCOO. Row 7: NEG1552, PC(40:6)+HCOO, NEG2037, PE(58:6)-H. Row 8: POS1477, DG(42:8)+NH4, NEG1712, PC(55:6)-CH3. Row 9: NEG1490, PC(38:6)+HCOO, NEG1229, PC(33:3)+HCOO. Row 10: NEG1954, PE(40:6e)-H,, . Row 11: POS5495, TAG(58:8)+H,, . Row 12: POS305, CerP(41:0)+H,, . Row 13: POS3980, SPH(d22:1)+H,, .
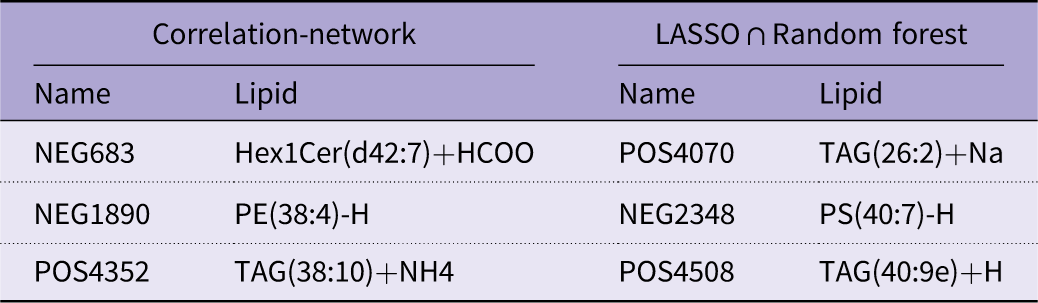
In the ovary, enrichment analysis revealed three pathways (glycerophospholipid, sphingolipid and glycerolipid metabolism), again with glycerophospholipid and sphingolipid metabolism comprising the largest altered lipid categories (Figure 8a). The lipid–GSI network contained 116 associated lipids (forty-seven glycerophospholipids, twenty-two sphingolipids, forty glycerolipids, one sterol and six fatty-acid derivatives), with three features showing VIP > 1·5 (Table 8; Figure 8b). The combination of LASSO (α = 0·3) and random forest screening identified three priority ovarian lipids: NEG2348, POS4070 and POS4508 (Table 8; Figure 8c).
Pathway enrichment of differentially abundant ovarian lipids, their correlation network with the gonadosomatic index (GSI) and key lipid biomarkers. (a) Bubble plot of lipid pathway enrichment; (b) lipid–GSI correlation network; (c) SHAP importance of key lipid biomarkers (mean ± se).

Ovarian lipid candidates from two selection routes are displayed side by side: correlation network v. multivariate selection (LASSO at λ min intersected with random forest)

Table 8. Long description
A table comparing lipid candidates from two selection routes: correlation network and multivariate selection. The table has two columns: Correlation-network and LASSO ∩ Random forest. Each column has two sub-columns: Name and Lipid. The Correlation-network column lists three rows: NEG683 with Hex1Cer(d42:7)+HCOO, NEG1890 with PE(38:4)-H, and POS4352 with TAG(38:10)+NH4. The LASSO ∩ Random forest column lists three rows: POS4070 with TAG(26:2)+Na, NEG2348 with PS(40:7)-H, and POS4508 with TAG(40:9e)+Na.
Cross-tissue integrative lipidomic networks and hub lipids linked to gonadosomatic index
Weighted correlation network analysis was applied to integrate the hepatopancreas and ovary lipidomes and identify lipid modules associated with ovarian development (GSI) (Figure 9). Hub lipids in GSI-associated modules were defined as those meeting |GS| > 0·5 and | module membership | > 0·8, and networks were visualised via |r| thresholds as specified in the Methods. The integrated (joint) network displayed a dense topology dominated by positive correlations, with hepatopancreas and ovary lipids intermingled into cross-tissue clusters. In contrast, tissue-specific networks presented clearer modular segregation and a greater fraction of negative edges, indicating distinct intratissue connectivity patterns (Figure 9a). Across networks, the most abundant hub classes were glycerophospholipids (particularly PC and PE) and glycerolipids (notably DG) (Figure 9a).
The cross-network hub lipids, their class composition, overlap across networks and association with the gonadosomatic index. (a) Cross-network hub lipids and their sources. Nodes represent hub lipids, coloured by lipid class; edges indicate within- or cross-network connections. Four hub sources are annotated: I, high-degree hub lipids within the integrated network; C, hub lipids within the consensus network; H, module-specific hub lipids within the hepatopancreatic network; and O, module-specific hub lipids within the ovarian network. (b) Class distribution of key cross-tissue hub lipids; (c) overlap of hub lipids across the five networks; (d) significant correlations between hub lipids and the GSI.

Figure 9. Long description
Panel A: This panel contains four network diagrams representing cross-network hub lipids and their sources. Nodes represent hub lipids, colored by lipid class; edges indicate within- or cross-network connections. Four hub sources are annotated: I, high-degree hub lipids within the integrated network; C, hub lipids within the consensus network; H, module-specific hub lipids within the hepatopancreatic network; and O, module-specific hub lipids within the ovarian network. Panel B: This panel features a horizontal bar graph showing the class distribution of key cross-tissue hub lipids. The x-axis represents the count, and the y-axis lists the lipid classes. Panel C: This panel displays a Venn diagram illustrating the overlap of hub lipids across five networks: Consensus, Hepatopancreas, Ovary, CrossTissue, and Combined. Panel D: This panel contains a dot plot showing significant correlations between hub lipids and the gonadosomatic index (GSI). The x-axis represents the correlation coefficient, and the y-axis lists the hub lipids. The size and color of the dots indicate the significance of the correlations.
The cross-tissue hub interaction network exhibited clear tissue stratification and dense within-tissue connectivity (Figure 9b). The class distribution of key cross-tissue hub lipids indicated that PC and TAG were the most common, followed by PE, DG, ceramide, PS, CL and Hex1Cer, whereas PI, acylcarnitines, LPC/LPE, SM, PA and phosphatidylglycerol appeared less frequently (Figure 9b). The overlap among the hub sets derived from the five strategies (joint, consensus, hepatopancreas, ovary and cross-tissue) was generally low, and no lipids were shared across all five sets (Figure 9c). Nevertheless, a subset of hub lipids showed significant correlations with the GSI, supporting their close association with ovarian development (Figure 9d).
Discussion
Owing to its intrinsic negative curvature and capacity to remodel membrane microdomains, PE may facilitate processes such as lipoprotein assembly and secretion, receptor-mediated endocytosis and the spatial organisation of signalling complexes. In this study, we systematically evaluated the effects of graded dietary PE supplementation on ovarian development in P. vannamei and explored the potential underlying mechanisms. By integrating histology, biochemistry, targeted gene expression, lipidomics and network analyses, we found that the reproductive optimum was not accompanied by bulk lipid accumulation. Instead, the results are consistent with PE-centred remodelling of the tissue phospholipid composition, lipid allocation/flux and intracellular signalling along the hepatopancreas–haemolymph–ovary axis.
PE is a major non-bilayer-forming phospholipid in intracellular membranes(Reference Cullis and De Kruijff12) and in the lipid-droplet monolayer(Reference Thiam, Farese and Walther19). Because of its conical geometry(Reference Gruner20) and propensity to promote negative membrane curvature(Reference Cullis and De Kruijff12), PE can facilitate membrane budding(Reference Bigay and Antonny13), neck constriction(Reference Chernomordik and Kozlov21) and vesicle fission at the endoplasmic reticulum and Golgi apparatus(Reference McMahon and Gallop22). These biophysical properties have been linked to secretory trafficking(Reference Bigay and Antonny13), including the assembly and secretion of lipoproteins and other cargo(Reference Vance and Tasseva15,Reference Vance23) . In this study, all the PE-supplemented groups presented significantly lower hepatopancreatic TC and TAG contents than did the PE-free control group, whereas Oil Red O staining revealed larger and more abundant lipid droplets, most notably in the 0·6 % group. The TP content of the hepatopancreas increased only at the highest PE level. This combination – reduced measured neutral-lipid content but expanded lipid droplet area – suggests that dietary PE altered hepatopancreatic lipid handling during ovarian development rather than simply increasing lipid storage. This pattern is consistent with the hepatopancreas functioning as a lipid-mobilising and lipid-exporting organ to support the ovary in reproductive crustaceans(Reference Zhu, He and Cao4,Reference Fatima, Ayub and Ali7) . Lipidomics further revealed PE-associated compositional remodelling in the hepatopancreas. The levels of polyunsaturated PE species were markedly increased, whereas those of PC/PS/TAG species were largely unchanged or modestly decreased. PI-related species also differed between groups, with an apparent redistribution from PI/LPI/PIP2 toward PIP/PIP3. These changes are compatible with the modulation of glycerophospholipid metabolism by dietary PE and their digestion products(Reference Vance23–Reference Gibellini and Smith25). In addition, PE can be metabolically coupled to PC via PEMT in other systems, and such coupling has been discussed in relation to ApoB-lipoprotein assembly(Reference Cole, Vance and Vance26). Together with curvature-based models of membrane remodelling(Reference McMahon and Gallop22), these observations support the idea that dietary PE may influence the hepatopancreatic membrane–lipid environment in ways that are relevant to lipid packaging and export during reproduction. This difference also helps explain why the lipid droplet morphology shown in Figure 2 and the lipid class composition shown in Figure 5 do not necessarily change in the same way.
The haemolymph lipid profile broadly paralleled the hepatopancreatic ‘lean-but-active’ pattern, indicating more efficient lipid utilisation rather than bulk accumulation in circulation. VLDL levels did not differ among the treatments, whereas HDL-C decreased with increasing dietary PE and LDL-C was significantly lower at 0·6 % and 1·2 % than at 0·0 % and 0·3 %. The unchanged VLDL suggests that PE supplementation did not simply increase the abundance of TAG-rich particles in the haemolymph, even though lipid droplets in the hepatopancreas became larger and more numerous. In contrast, the reduction in LDL-C at medium to high PE levels is consistent with enhanced removal of lipoprotein-like particles from circulation by peripheral tissues(Reference Racotta2), particularly the ovary, as proposed for lipid transport during crustacean reproduction(Reference Wouters, Lavens and Nieto3). Mechanistically, studies in vertebrates have shown that the assembly and secretion of ApoB-containing lipoproteins depend on the availability and composition of phospholipids(Reference Cole, Vance and Vance26) and microsomal TAG transfer protein, which together influence the export of TAG and cholesteryl esters(Reference Wetterau, Lin and Jamil27). In addition, nascent HDL-C formation requires ABCA1-mediated transfer of phospholipids and cholesterol to ApoA-I, followed by esterification by LCAT(Reference Lee, Park and Koo28). Because PE can affect membrane physical properties and phospholipid organisation, it has been discussed as a potential modulator of lipoprotein biogenesis and phospholipid transfer processes(Reference Vance and Tasseva15). Although these molecular mechanisms have not yet been fully elucidated in P. vannamei, our haemolymph data are most consistent with a model in which dietary PE support ovarian development primarily by improving the routing and utilisation of circulating lipid carriers (including lipoprotein-like particles and vitellogenin) rather than by elevating their steady-state concentrations. This interpretation aligns with the broader view that effective broodstock nutrition should emphasise the provision of specific phospholipid species and efficient lipoprotein-mediated transport instead of relying solely on increasing crude lipid intake(Reference Coutteau, Geurden and Camara29).
At the utilisation interface, the ovarian membrane platform for ‘uptake and deposition’ appears to be qualitatively remodelled rather than simply expanded. In crustaceans, vitellogenesis depends on the internalisation of circulating vitellogenin and lipoprotein-like particles, which deliver yolk proteins and neutral lipids to developing oocytes(Reference Subramoniam5). Analogous processes in vertebrates involve receptor-mediated uptake of VLDL/LDL-like particles(Reference Lubzens, Young and Bobe30) and selective acquisition of HDL-C cholesteryl esters via SR-BI(Reference Trigatti, Rigotti and Krieger31). Although the specific receptors and trafficking machinery are not fully understood in P. vannamei, these frameworks provide a useful reference for interpreting ovarian lipid handling. Consistent with enhanced ovarian deposition, oocytes in the 0·6 % PE group presented the largest cross-sectional area, denser yolk granule and cortical-rod accumulation, and a shortened duration of ovarian stages II–III. Biochemically, the ovarian TAG content was significantly greater in the 0·6 % and 0·9 % groups than in the 0·0 %, 0·3 %, and 1·2 % groups, whereas the total ovarian protein and cholesterol contents did not differ among the treatments. This pattern suggests preferential enrichment of neutral lipid reserves while maintaining protein and sterol pools within a relatively stable range. Ovarian lipidomics further revealed coordinated changes across multiple lipid classes, with increases in TAG, PC, PE, PI, SM and lyso-PS (LPS), together with a decrease in Hex1Cer, suggesting concurrent remodelling of storage lipids and membrane lipid domains. Several features of the observed lipid shifts are compatible with improved endocytic capacity and membrane organisation. Conical, polyunsaturated PE tend to promote negative curvature(Reference Cullis and De Kruijff12) and can lower the energetic cost of invagination and neck constriction during internalisation(Reference Fuller and Rand32). Conversely, inverted-conical lysophospholipids are often enriched in the outer leaflet and have been implicated in membrane budding/completion steps(Reference Epand, Fuller and Rand33). In parallel, SM can associate with cholesterol to stabilise ordered membrane microdomains (‘rafts’), which may facilitate the clustering and regulation of receptor–signalling complexes(Reference Simons and Sampaio34). PS/LPS can modulate inner leaflet electrostatics and the recruitment of endocytic and signalling proteins(Reference Yeung, Gilbert and Shi35). The concurrent decrease in Hex1Cer and increase in SM also suggest a shift in sphingolipid metabolism that could influence microdomain properties and receptor–signal coupling(Reference Hannun and Obeid36). Taken together, the elevated ovarian TAG reserves and the coordinated remodelling of the PE/PC/SM/PS/LPS-related membrane composition are consistent with a more permissive membrane environment for binding, internalisation and processing of circulating vitellogenin and lipoprotein-like particles during ovarian development. Finally, the cross-tissue OPLS-DA separation supports tissue-specific responses, with the hepatopancreas and ovary exhibiting distinct but complementary lipidomic signatures, in line with their respective roles in lipid supply v. utilisation.
Transcriptional profiles of key signalling and metabolic genes link these structural changes to cellular programmes controlling growth, steroidogenesis and vitellogenesis and thus represent the ‘effector arm’ of the PE response. pla2, plcxd1l and pka-c1 were up-regulated with increasing dietary PE, and the expression of pi3k92e, akt, mtor, s6k1 and the proliferation marker pcna was significantly greater in the 0·6–1·2 % groups than in the 0·0–0·3 % groups. In parallel, srebp and fas expression increased progressively with PE inclusion, and vg and vgr were markedly elevated at 0·6 %–1·2 %, peaking at 0·9 %. Together with the lipidomic signature of increased PI/LPI/PIP2 and reduced PIP/PIP3 in the ovary, these patterns indicate activation of the PI3K–Akt–mTOR(Reference Manning and Toker37) and PLC–DAG–IP3/Ca2+ pathways(Reference Suh, Park and Manzoli38), characterised by high turnover but low steady-state accumulation of terminal phosphoinositides and increased lipogenic and vitellogenic capacity(Reference Fruman, Chiu and Hopkins39). mTORC1 promotes SREBP maturation and nuclear entry(Reference Düvel, Yecies and Menon40), thereby up-regulating hubs such as FASN to furnish lipids required for vitellogenin assembly and membrane biogenesis(Reference Laplante and Sabatini41), whereas the PLC–DAG–IP3/Ca2+ system strengthens the coupling of receptor signalling to exocytosis and secretory processes(Reference Suh, Park and Manzoli38). The concomitant increase in vg/vgr expression indicates that the synthesis-receptor-mediated uptake–deposition loop has been driven into a high-throughput regime, which is consistent with the histological evidence of faster yolk granule and cortical-rod deposition at 0·6 % PE. These features echo the conserved paradigm – exemplified in insects – in which nutrient-responsive TOR signalling acts as a central regulator linking lipid availability, vitellogenesis and oocyte maturation(Reference Armstrong42–Reference Roy, Saha and Zou44), suggesting that PE-driven activation of these pathways in shrimp reflects a conserved strategy that translates membrane and flux remodelling into reproductive output(Reference Subramoniam5).
The endocrine milieu observed here is broadly consistent with this interpretation while adding an additional layer of regulation to the membrane–flux–signalling circuitry. The serum estradiol and progesterone concentrations increased significantly in the 0·6–1·2 % group relative to those in the 0·0–0·3 % group, which was in line with enhanced ovarian steroidogenesis supported by improved cholesterol routing and ovarian metabolic activation(Reference Miller and Bose6). In vertebrates, HDL-derived cholesteryl esters provide a high-turnover substrate reservoir for steroid biosynthesis via selective uptake pathways(Reference Trigatti, Rigotti and Krieger31), and our lipidomic and lipoprotein data suggest that PE-induced adjustments in the circulating lipid composition of P. vannamei may similarly favour a more targeted supply of cholesterol substrates to the gonad, even though the specific receptors involved in shrimp have not yet been identified. In many decapods, the crustacean gonadotropic hormone MF and the inhibitory neuropeptides GIH and MIH jointly define a ‘gain setting’ of the reproductive axis(Reference Nagaraju16). In our study, the MF and MIH levels were not significantly altered by dietary PE, implying that PE primarily modulates reproduction through membrane biophysics and nutrient-sensing pathways rather than via strong shifts in juvenile hormone analogs or molting regulators. GIH levels were generally greater in the PE-fed groups than in the control groups, which may reflect a feedback response to accelerated ovarian development rather than a direct stimulatory effect. Our measurements were obtained at the end of the feeding period and thus represent a time-integrated endocrine state rather than secretion dynamics across developmental transitions. A parsimonious explanation is compensatory feedback: as ovarian growth and steroidogenesis proceed more rapidly under optimal PE supply, feedback from the enlarged and metabolically active gonad may elicit increased GIH secretion to restrain further acceleration and maintain endocrine homeostasis. Importantly, reproductive indices improved despite elevated GIH, implying that the inhibitory ‘brake’ was insufficient to offset the strengthened ‘drive’ generated by PE-enhanced membrane architecture, optimised lipid routing, and activation of nutrient-responsive signalling pathways.
System-level synergy is further supported by the inferred network architecture. Weighted correlation network analysis revealed that, in both integrated and consensus networks, lipid features from the hepatopancreas and ovary assembled into interlaced modules rather than segregating into tissue-isolated blocks(Reference Langfelder and Horvath45,Reference Zhang and Horvath46) . Within these modules, PC, PE, DG, TAG, PS/phosphatidylglycerol and PIP displayed high intramodular connectivity (hub-like positions), which is consistent with the coordinated regulation of lipid synthesis, signalling supply and membrane remodelling(Reference Langfelder, Luo and Oldham47). Conceptually, this topology supports parallel amplification of two coupled subsystems: a ‘synthesis and signalling-supply arm’ centred on PC/PE/DG/PIP (supporting phospholipid provision and phosphoinositide signalling capacity) and a ‘receptor and membrane-platform arm’ enriched in PE/PC/PS/TAG/SM (supporting curvature control, microdomain organisation and storage-to-utilisation coupling). Mechanistically, the hub identities are biologically plausible. Phosphoinositides are core membrane signalling lipids that connect trafficking to signal transduction through rapid interconversion among PI-phosphate species(Reference Balla48). SM, together with cholesterol, promotes ordered membrane microdomains that can facilitate receptor clustering and endocytic organisation(Reference Simons and Sampaio34). DG plays a dual role as a biosynthetic intermediate for phospholipid production(Reference Luo, Regier and Prescott49) and a lipid second messenger that activates PKC/PKD pathways and supports secretory trafficking from the trans-Golgi network(Reference Baron and Malhotra50). The emergence of these species as hubs therefore strengthens the interpretation that PE supplementation reorganises lipid metabolism around nodes, which simultaneously controls membrane construction, signalling competence, and cargo handling. In tissue-resolved networks, we observed an increased proportion of negative edges, a pattern consistent with substrate sharing, branch point competition and flux reallocation across lipid pathways(Reference Krumsiek, Suhre and Illig51). Importantly, such antagonistic correlations do not contradict overall activation; rather, they suggest that, under conditions of higher total lipid throughput, tissues may preferentially channel intermediates into function-priority modules by shunting and trade-offs, thereby improving robustness and efficiency at the system level(Reference Barabási and Oltvai52). Finally, module eigengenes and hub-associated lipid sets were strongly correlated with the GSI, which is consistent with the general network principle that highly connected features are more likely to track and potentially shape organismal phenotypes(Reference Langfelder and Horvath45). Collectively, these network properties provide systems-level support for a PE-driven structural and functional reconfiguration of lipid metabolism that is tightly coupled to reproductive traits.
When dietary PE reached ≥0·9 %, several effector-level indices began to decline despite the persistence of elevated upstream signals. Specifically, mtor and vg/vgr decreased, whereas s6k1, akt and srebp remained relatively high, indicating a partial ‘upstream drive–effector decoupling’. This pattern suggests that additional PE no longer translates linearly into vitellogenic output and may even compromise aspects of oocyte provisioning – i.e. lipid availability remains sufficient, but the efficiency with which substrates are converted into terminal reproductive products declines, a situation often described as ‘quantity maintained but quality reduced’. A plausible mechanistic explanation involves homeostatic negative feedback within nutrient-sensing and lipogenic circuits. First, sustained mTORC1/S6K1 activation can dampen upstream insulin/PI3K signalling through feedback inhibition, limiting further gains in pathway throughput even when proximal components (e.g. Akt) remain transcriptionally elevated(Reference Fruman, Chiu and Hopkins39,Reference Tremblay, Brûlé and Hee Um53) . Second, sterol accumulation and oxysterol signalling can engage LXR–SREBP cross-regulation, restricting additional lipogenic and cholesterol-handling responses via autoregulatory loops(Reference Hong and Tontonoz54,Reference Shimano55) . Together, these feedback controls can impose a regulatory ‘ceiling’, whereby incremental precursor supply and signalling input are increasingly buffered rather than being proportionally converted into end-point reproductive effectors such as vitellogenin. In combination with potential biophysical constraints of excessive membrane PE (e.g. altered curvature stress and organelle trafficking capacity), these regulatory ceilings provide a coherent framework for the observed plateau and subsequent decline in ovarian maturation benefits at higher PE inclusion. This explains the bell-shaped dose–response relationship and is consistent with the statistically estimated optimal dietary window of 0·67 %–0·68 % PE.
At the phenotypic level, the multilayered PE-dependent shifts in lipid flux, nutrient-sensing signalling, and endocrine status converge on a coherent ovarian outcome. In the 0·6 % PE group, ovarian development followed a ‘faster yet more advanced’ trajectory: the duration of stages II–III was shortened, yolk granules and cortical rods were more abundant, and the GSI increased while the HSI decreased, together with a greater density of hepatopancreatic lipid droplets. This constellation argues against a mechanism on the basis of nonspecific systemic lipid deposition. Because the diets were isonitrogenous and isolipidic and feed intake was comparable among groups, PE had little effect on short-term growth performance but was instead more likely to alter reproductive allocation and lipid remodelling. Accordingly, these findings support the interpretation that PE improves reproduction primarily by coordinating the composition of function-critical lipid classes, haemolymph lipid transport and delivery, and receptor-side membrane platforms that govern uptake and signalling – thereby enhancing traits closely linked to oocyte quality. This reasoning aligns with the parental nutrition paradigm in aquatic species, which emphasises that egg quality depends more on lipoprotein transport efficiency and vitellogenin deposition than on total lipid load (Reference Lubzens, Young and Bobe30,Reference Izquierdo, Fernández-Palacios and Tacon56–Reference Tocher58) . Mechanistically, PE occupies a strategic biophysical position in both the endoplasmic reticulum membrane(Reference Cullis and De Kruijff12) – where lipoproteins and secretory cargos are assembled – and the phospholipid monolayer of lipid droplets(Reference Thiam, Farese and Walther19), which interfaces storage with mobilisation. By modulating intrinsic curvature stress and lateral domain organisation(Reference Cullis and De Kruijff12), PE can plausibly reduce energetic barriers for lipoprotein assembly/budding and secretion on the supply side while facilitating endocytosis and vesicle formation on the ovarian uptake side. Concurrently, an upward shift along the PI→PIP3 axis, together with remodelling of SM/PS/PE-enriched membrane domains, is expected to enhance receptor signalling gain and trafficking efficiency by tightening the coupling between the membrane microenvironment, kinase activation and vesicular transport(Reference Simons and Sampaio34,Reference Balla48,Reference Wenk59) . Taken together, the optimal PE level does not simply expand lipid reserves; rather, it selectively refines lipid molecular species composition and geometric/biophysical properties so that structural supply, energy support, secretory export, receptor-mediated uptake and nutrient/endocrine signalling form a more efficiently coupled loop. This integrated mechanism provides a parsimonious explanation for the more advanced ovarian development and improved oocyte quality-related morphology observed at 0·6 % PE.
In summary, moderate dietary PE supplementation promotes reproduction in P. vannamei through three coupled and mutually reinforcing axes. (1) Phospholipid remodelling axis: lipidomics of the hepatopancreas and ovary indicate a PE-centred shift in membrane-lipid architecture, characterised by changes in PE (including PUFA-enriched PE) together with coordinated remodelling of PC/PS/SM/LPS. These lipids assemble into modules whose eigengenes (or hub-associated sets) are tightly correlated with the GSI, supporting the inference that ovarian advancement is linked to a reconfiguration of essential structural lipids rather than a nonspecific increase in total lipid content. (2) Lipid-flux axis: across the hepatopancreas–haemolymph–ovary continuum, PE enhances the coordination of lipid mobilisation, lipoprotein transport, and ovarian deposition, thereby reallocating resources toward gonadal growth. (3) Signalling axis: PE strengthens nutrient-responsive and secretory programmes – primarily via the PI3K–Akt–mTOR/SREBP and PLC–Ca2+ pathways – within an endocrine context that is permissive for vitellogenesis and oocyte growth, improving the conversion of metabolic inputs into reproductive outputs. When PE exceeds the optimal window, the system appears to enter a regime of diminishing returns: excessive membrane remodelling (‘overdrive’) and compensatory negative feedback restrain pathway throughput and weaken the translation of upstream activation into terminal effectors, thereby partially reversing the molecular and cellular advantages observed at moderate PE. Overall, the optimal PE level does not simply expand lipid reserves; it refines phospholipid composition, reorganises cross-tissue lipid flux and stabilises key signalling programmes, tightening the coupling among structural supply, energy metabolism and reproductive performance.
Conclusion
This study demonstrated that dietary PE supplementation in P. vannamei markedly promoted ovarian maturation, with an optimal supplementation level of 0·67–0·68 % on a dry matter basis. Appropriate PE supplementation accelerates the progression of ovarian development, elevates the GSI, reduces the HSI and increases the abundance of yolk granules and cortical rods. The promoting effects of PE are mediated by coordinated lipid remodelling and signal integration along the hepatopancreas–haemolymph–ovary axis. In the hepatopancreas, PE establishes a metabolically active lipid-supply state characterised by enrichment of polyunsaturated PE species and heightened lipid droplet dynamics, despite a decline in total neutral lipid content. In the ovary, selective TAG accumulation, together with the remodelling of PE, PC, SM and PS, supports efficient lipid uptake and intracellular trafficking during vitellogenesis. These structural changes coincide with the activation of the PI3K–Akt–mTOR and PLC–Ca2+ signalling cascades, alongside the up-regulation of key genes involved in lipid biosynthesis and vitellogenin utilisation. Integrative lipidomics and network analyses further identified cross-tissue hub lipids – including PC, PE, DG, TAG, PS and PI – that are tightly associated with ovarian development, indicating that the effects of PE arise from its capacity to reconfigure interorgan lipid architecture and connectivity rather than to alter total lipid content. At higher PE levels (≥0·9 %), ovarian development is decelerated, which is consistent with homeostatic constraints on membrane remodelling and nutrient-sensing pathways. Collectively, these findings indicate that judicious dietary PE fine-tunes phospholipid composition, lipid flux and intracellular signalling to increase ovarian development in P. vannamei, providing a mechanistic foundation for the precise formulation of phospholipids in broodstock diets.
Data availability statement
The data support the finding of this study are available from the corresponding author upon reasonable request.
Acknowledgements
The authors contributed to this study as follows: Long Zhang: conceptualisation, methodology, investigation, formal analysis, and writing – original draft. Tong Chang: methodology, investigation, formal analysis, and validation. Xiaolong Liang: investigation, formal analysis, and visualisation. Fenglu Han: investigation, formal analysis, data curation, visualisation, and funding acquisition. Chang Xu: resources, validation, supervision, project administration, funding acquisition, and writing – review and editing. Erchao Li: conceptualisation, supervision, project administration, funding acquisition, and writing – review and editing.
This research was funded by the National Natural Science of Foundation of China (32674045), the National Key Research and Development Program of China (2023YFD2402000), the Hainan Provincial Key Research and Development Program (ZDYF2024XDNY185) and the Earmarked Fund for the Hainan Agricultural Production Research System (HNARS-10-ZJ05).
We also acknowledge the Instruments Sharing Platform of School of Life Sciences, East China Normal University for providing instrumental support and technical assistance.
There are no conflicts of interest.