Introduction
Sea ice, being one of the critical components of the global climate system, modulates atmospheric and oceanic circulations by affecting ocean surface radiation, temperature, energy balance and the circulation of salt flow (Walsh Reference Walsh1983). In recent decades, sea ice in in the two hemispheres has experienced different trends of change, with a negative trend in the Arctic (Serreze & Stroeve Reference Serreze and Stroeve2015) and a positive trend in the Antarctic (Parkinson & Cavalieri Reference Parkinson and Cavalieri2012). The sea ice decrease in the Arctic is tied to global warming (ACIA 2005), while the sea ice trend in the Antarctic is dominated by the increase in the Ross Sea sector, where the sea ice extent is significantly correlated with the depth of the Amundsen Sea Low (Turner et al. Reference Turner, Hosking, Bracegirdle, Marshall and Phillips2015). Sea ice in the Antarctic Ocean plays an important role in the climate system, which profoundly affects regional and global climate changes (Zwally et al. Reference Zwally, Comiso, Parkinson, Cavalieri and Gloersen2002). As different sea ice types have different densities and snow depths that can significantly affect the retrieval of sea ice thickness, accurate estimation of sea ice type is required for the calculation of sea ice thickness from satellite altimeters. Furthermore, an accurate record of the multi-year (MY) ice coverage and its variability is crucial to understanding the relationship between climate and sea ice (Kwok Reference Kwok2004). To assess the interactions between sea ice and climate, information on the concentration, extent and thickness of sea ice is required. On the other hand, assessment of these parameters by means of satellite remote sensing requires accurate information on sea ice type (Thorndike et al. Reference Thorndike, Rothrock, Maykut and Colony1975).
Recently, distinguishing MY sea ice and first-year (FY) sea ice on a large scale using remote sensing data has become a pivotal focus in sea ice research. The physical properties of sea ice evolve with age, resulting in differences in porosity, salinity and roughness between MY and FY sea ice. Such physical differences produce differences in the microwave signatures and enable the classification of sea ice type using microwave sensors (Early & Long Reference Early and Long2001). Remote sensing data used for sea ice-type classification include three major sensor types: passive microwave radiometers, scatterometers and synthetic aperture radar (SAR) systems. Gloersen & Cavalieri (Reference Gloersen and Cavalieri1986) used passive microwave radiometer data to identify seawater and sea ice, and then applied the gradient ratio threshold to distinguish Arctic FY ice and MY ice. Maslanik et al. (Reference Maslanik, Stroeve, Fowler and Emery2011) used the Lagrangian operator to compute the ice age distribution of the Arctic based on passive microwave remote sensing data. Zhang et al. (Reference Zhang, Guo, Zhang, Liu and Bai2016) ascertained the extent of Arctic MY ice based on Advanced Microwave Scanning Radiometer for Earth Observing System (AMSR-E) radiometer data. Walker et al. (Reference Walker, Partington, Van Woert and Street2006) classified Arctic sea ice jointly using scatterometer and passive microwave remote sensing data. Techniques for ice classification using SAR have been explored and developed. Geldsetzer & Yackel (Reference Geldsetzer and Yackel2009) identified Arctic FY ice, MY ice and open water using dual-polarized C-band SAR images. Zakhvatkina et al. (Reference Zakhvatkina, Alexandrov, Johannessen and Sandven2013) classified sea ice in the Central Arctic from Envisat SAR images using a neural network-based algorithm and Bayesian algorithm.
Previous studies on the large-scale classification of sea ice have mainly focused on the Arctic. In these studies, the main types of data have been passive microwave radiometer, SAR and scatterometer data. Space-borne passive microwave data cover a large area, but they suffer from a low spatial resolution. SAR images, on the other hand, exhibit high spatial resolution, but they are limited by a narrow swath, resulting in reduced spatiotemporal coverage. The enhanced-resolution Ku-band (QuikSCAT and Oceansat-2 Scatterometer; OSCAT) and C-band (Advanced Scatterometer; ASCAT) scatterometer data accessed from Brigham Young University (BYU) have a higher spatial resolution (4.45 km) than the passive microwave data and a larger area of coverage than SAR images, and thus they are an ideal data source for obtaining large-scale sea ice-type information.
In this paper, three different sea ice classification methods (histogram threshold (HT), Spreen model (SM) and strong contrast (SC) classification methods) are tested in the Weddell Sea using Ku-band and C-band scatterometer data and AMSR-E/AMSR2 radiometer data, and the results are validated against ship observations. The aim of the study is to compare and evaluate sea ice classification methods based on satellite scatterometer or radiometer data in order to better understand their relative performance levels, so as to retrieve better long-term Antarctic sea ice-type information in the future.
Data and methods
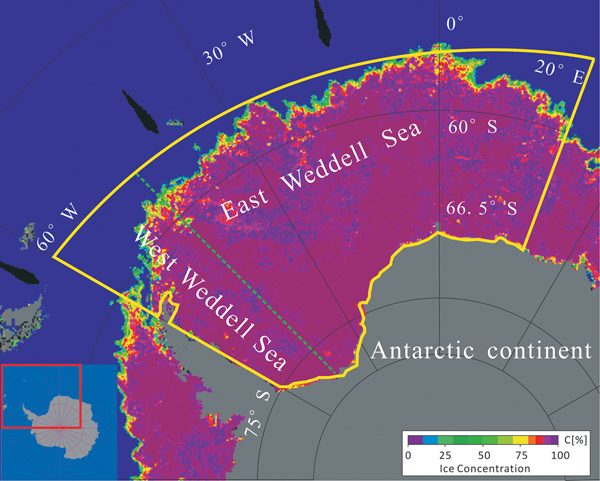
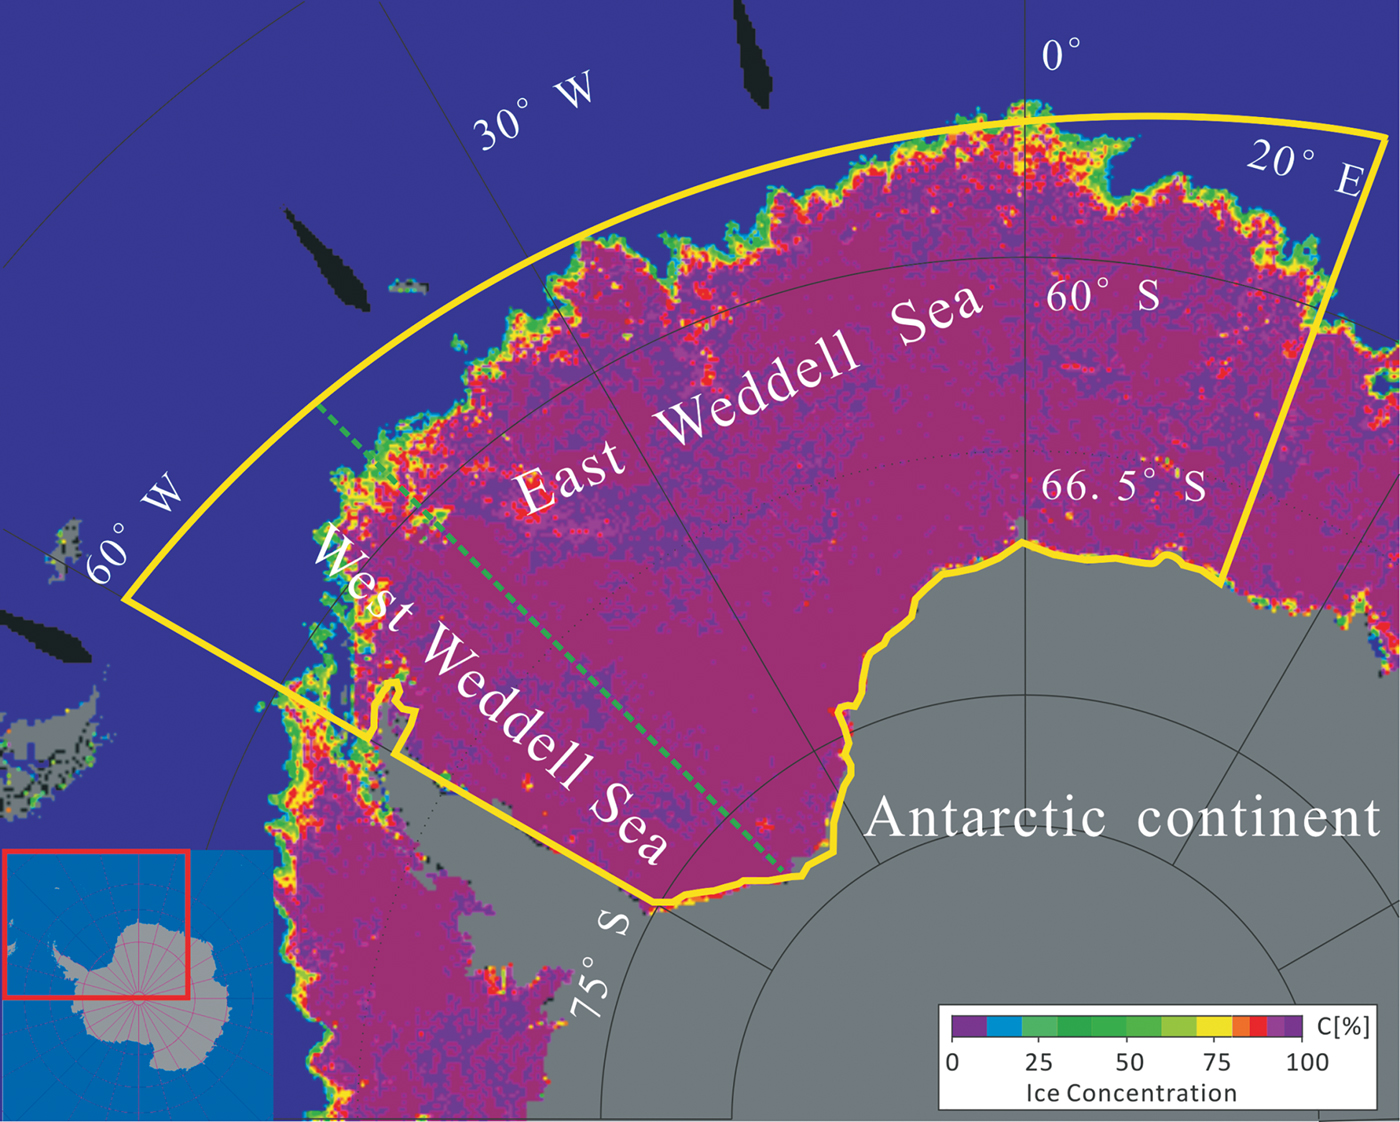
The region of this study is the Weddell Sea (Fig. 1), which is located within 60°W–20°E, including the western and eastern Weddell Sea. The Weddell Sea is located in a wide basin whose boundaries are defined by the bay formed from the coasts of the Antarctic Peninsula. The area of MY sea ice in the Weddell Sea is larger than in other regions of the Antarctic. In general, the area of sea ice reaches a maximum in September and a minimum in February. The MY ice typically persists during the austral summer melt season in the Weddell Sea. Since the microwave signatures of MY ice and FY ice are difficult to distinguish during the sea ice-melting season, the sea ice growth season (May–September) was chosen for the sea ice classification.
Schematic of the study area. The yellow box denotes the extent of the Weddell Sea. The dotted green line (longitude 45°W) separates the East Weddell Sea from the West Weddell Sea. The AMSR-E sea ice concentration of 31 July 2005 from the University of Bremen is used as the background.
QuikSCAT, ASCAT and OSCAT scatterometer data
QuikSCAT is a sun-synchronous orbit satellite with an orbital altitude of 803 km and an inclination angle of 98.6°. The instrument aboard QuikSCAT is the SeaWinds scatterometer, which shares its name with the scatterometer aboard the Advanced Earth Observation Satellite 2 (ADEOS-II). To distinguish the two instruments, NASA Jet Propulsion Laboratory renamed the SeaWinds instrument aboard the QuikSCAT satellite to QuikSCAT. The QuikSCAT scatterometer operates at a Ku-band with a frequency of 13.4 GHz (wavelength 2.23 cm) using the internal and external beam scanning modes. The horizontally polarized (HH) inner beam covers a swath width of 1400 km at an incidence angle of 46° and the vertically polarized (VV) outer beam covers a swath width of 1800 km at an incidence angle of 54°. The QuikSCAT, operating from June 1999–November 2009, covers 90% of the Earth's surface in one day (NASA/JPL 2006). The instrument was designed to measure the ocean wind speeds and directions, as well as to monitor the sea ice (Nghiem et al. Reference Nghiem, Chao, Neumann, Li, Perovich, Street and Clemente-Colón2006).
The ASCAT sensor is an active microwave scatterometer mounted on the MetOp-A platform, which was launched in October 2006 by the European Organization for the Exploitation of Meteorological Satellites (EUMETSAT). It is a sun-synchronous, near-polar orbit satellite and it operates at a C-band with a frequency of 5.3 GHz (wavelength 5.7 cm) in vertical co-polarization and continues to deliver near-global daily coverage. ASCAT has two sets of three fan beam antennas, each covering a swath width of 550 km, producing 80% global coverage per day. ASCAT has been widely used to retrieve surface wind speed data (which it is primarily intended for), to retrieve the surface soil moisture and to monitor sea ice (Mortin et al. Reference Mortin, Howell, Wang, Derksen, Svensson, Graversen and Schrøder2014).
The OSCAT sensor is an active microwave sensor aboard the Oceansat-2 satellite in a sun-synchronous orbit at an altitude of 720 km, which was launched in 2009 by the Indian Space Research Organization (ISRO). It has a pencil-beam antenna and, similarly to QuikSCAT, it operates at the Ku-Band with a frequency of 13.5 GHz (wavelength 2.22 cm). OSCAT, operating from November 2009–February 2014, has an HH inner beam covering a swath width of 1400 km at an incidence angle of 49° and a VV outer beam covering a swath width of 1800 km at an incidence angle of 57° (Bhowmick et al. Reference Bhowmick, Kumar and Kumar2014).
In this paper, the QuikSCAT, OSCAT and ASCAT scatterometer data with a spatial resolution of 4.45 km and a temporal resolution of one day were downloaded from the Scatterometer Climate Record Pathfinder from BYU (www.scp.byu.edu/data/SigBrw/SigBrw.html). The enhanced-resolution QuikSCAT scatterometer data, which take advantage of the spatial overlap in scatterometer measurements made at different times of a single day, can provide more sea ice details compared to the original resolution (Long et al. Reference Long, Hardin and Whiting1993). The enhanced-resolution ASCAT data are produced in the same way as the QuikSCAT data, which are two day-averaged σ0 data normalized to an incidence angle of 40° in a polar stereographic projection. Following a previous study (Spreen Reference Spreen2008), the data used in this study for distinguishing MY ice and FY ice were the VV scatterometer data.
AMSR-E and AMSR2 passive microwave radiometer data
The AMSR-E is a passive microwave radiometer aboard the NASA Aqua satellite, with an incidence angle of 55° (Kawanishi et al. Reference Kawanishi, Sezai, Ito and Imaoka2003). It measures HH and VV brightness temperatures (Tb) at 6.9, 10.7, 18.7, 23.8, 36.5 and 89.0 GHz. The spatial resolution of the individual measurements varies from 5.4 km at 89 GHz to 56 km at 6.9 GHz. The AMSR-E Tb data can be used to retrieve data on sea ice concentration, snow depth, thin sea ice thickness and other parameters. As the radiation varies between seawater and sea ice at different frequencies and polarizations, AMSR-E data are commonly used to compute the extent of sea ice (Comiso & Nishio Reference Comiso and Nishio2008), as well as to discriminate between MY ice and FY ice (Hao & Su Reference Hao and Su2015). AMSR-E was launched in May 2002 and operated until 4 October 2011. As a successor to AMSR-E, AMSR2 was mounted on the Global Change Observation Mission 1st - Water (GCOM-W1) satellite, which was launched on 18 May 2012 by the Japan Aerospace Exploration Agency (JAXA). Both AMSR2 and AMSR-E have similar instrument configurations. Compared with AMSR-E, AMSR2 has a new frequency at 7.3 GHz and a larger antenna for enhanced spatial resolution (Imaoka et al. Reference Imaoka, Maeda, Kachi, Kasahara, Ito and Nakagawa2012).
In this study, AMSR-E and AMSR2 Tb data were used to identify sea ice type and sea ice concentration data in order to extract sea ice zone. The AMSR-E Tb data with a spatial resolution of 12.5 km were accessed from the National Snow and Ice Data Center (NSIDC; http://nsidc.org/data/AE_SI12/versions/3) (Cavalieri et al. Reference Cavalieri, Markus and Comiso2014). The AMSR2 Tb data with a spatial resolution of 10 km were obtained from JAXA G-portal (https://gportal.jaxa.jp/gpr). The AMSR-E and AMSR2 sea ice concentration products with a spatial resolution of 6.25 km were downloaded from the University of Bremen (http://iup.physik.uni-bremen.de:8084/amsr) based on the ARTIST (Arctic Radiation and Turbulence Interaction Study) Sea Ice (ASI) algorithm (Spreen et al. Reference Spreen, Kaleschke and Heygster2008).
ASPeCt and PANGAEA ship-based observational data
Antarctic Sea Ice Processes and Climate (ASPeCt) is an archival collection dataset of sea ice observations made during ice navigation for scientific expeditions. The dataset contains sea ice parameters that include sea ice concentration, sea ice thickness, sea ice type and other ice variables, which are typically recorded on the ship within an observation distance of 1 km according to an international sea ice visual observation standard (Worby et al. Reference Worby, Geiger, Paget, Van Woert, Ackley and Deliberty2008).
For the Antarctic Weddell Sea, the ASPeCt dataset is available from 2000–2005 (http://aspect.antarctica.gov.au/data), and the ship-based sea ice observation data following the ASPeCt protocol from 2013–2017 can be download from PANGAEA (https://doi.pangaea.de/10.1594) (Schwegmann Reference Schwegmann2013). During the sea ice-melting season, the microwave signatures from FY ice and MY ice become mixed, which makes it difficult to classify sea ice. The sea ice growth seasons in the ASPeCt data are only available for 2005 and 2013, which were chosen as the validation datasets. The 2005 ASPeCt data are from 31 June–19 August 2005, and these data were used as validation data for the classification of results from the QuikSCAT and AMSR-E data. The 2013 ASPeCt data are from 17 June–8 August 2013, and these data were used as validation data for the classification of results from the ASCAT, OSCAT and AMSR2 data.
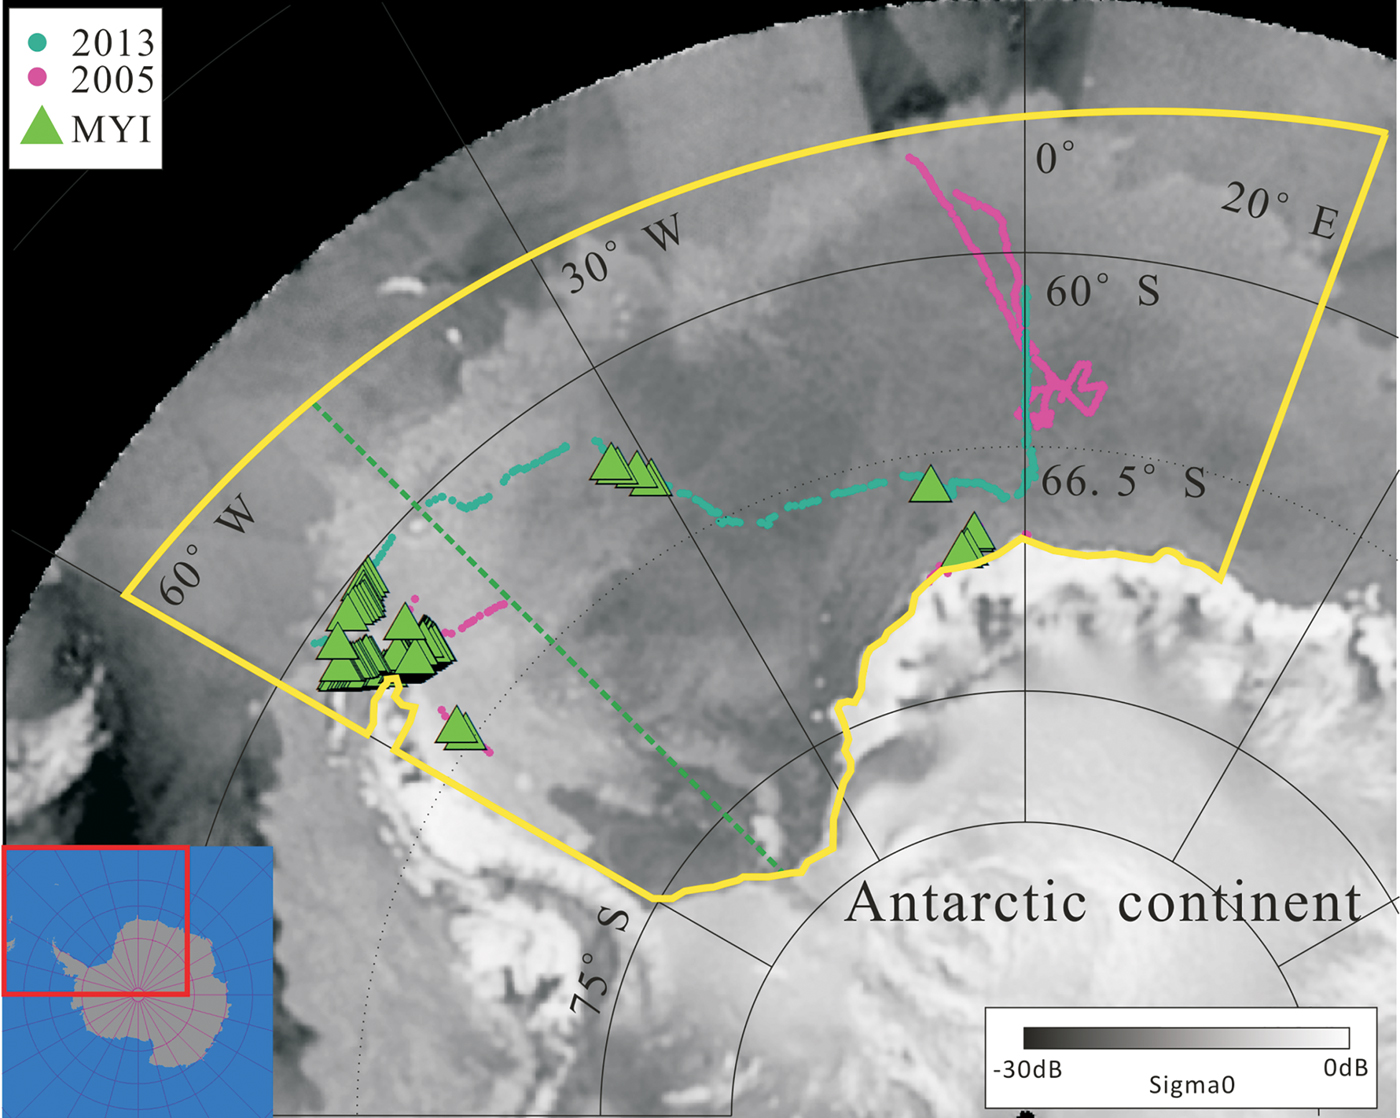
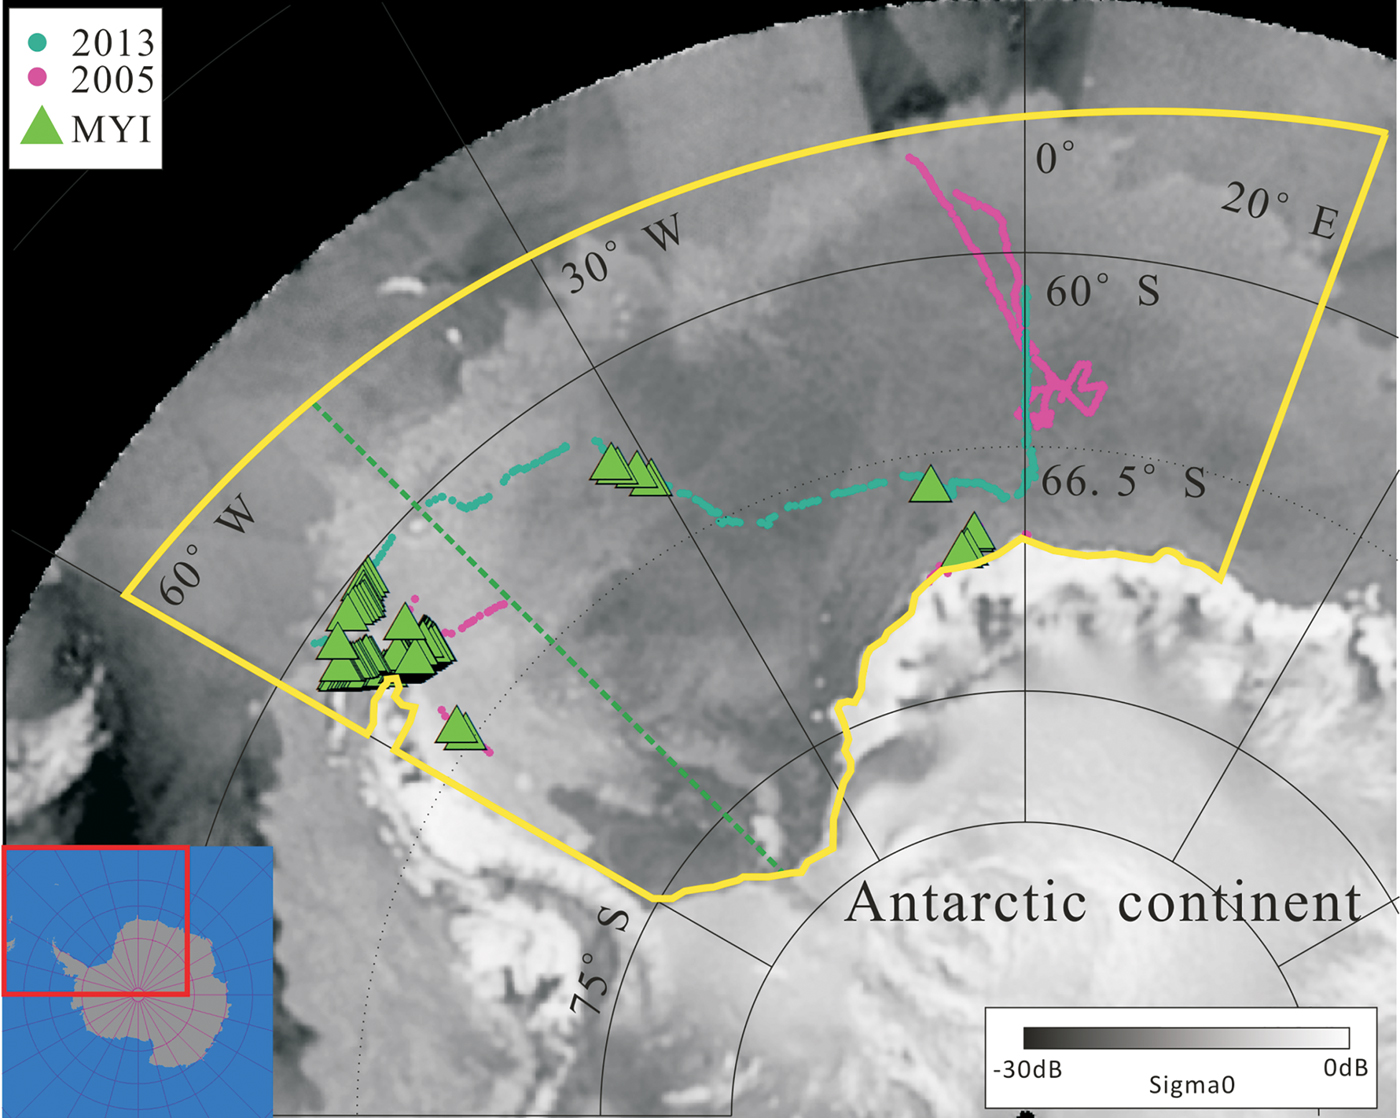
The ship-observed data for the points chosen to be the validation data in the Weddell Sea are shown in Fig. 2, and the acquired primary ice-type information was extracted from the ASPeCt and PANGAEA datasets as the ground true data in order to validate the sea ice classification results from the scatterometer and radiometer data using three methods. The nearest data point of the ASPeCt and PANGAEA data of a specific day within one grid cell of the respective satellite image was used for comparison. The green triangles in Fig. 2 denote the MY ice distribution derived from ASPeCt ship observations.
Positions of the ASPeCt measurement points in the Weddell Sea. A QuikSCAT scatterometer image of 31 July 2005 is used as the background. The colours of the dots indicate the year of the scientific research expedition cruise. The green triangles denote the MY ice (MYI) distribution derived from ASPeCt ship-based observations.
The HT method (Kwok Reference Kwok2004), the SM method (Spreen Reference Spreen2008) and the SC method (Zhang et al. Reference Zhang, Guo, Zhang, Liu and Bai2016), the former two apply scatterometer data in order to classify sea ice, while the latter is based on the radiometer data. In the following sections, these methods are first briefly introduced, and then the workflow for sea ice classification in this paper is described.
The HT sea ice classification method
The backscatter of FY and MY sea ice has been observed to vary seasonally (Ezraty & Cavanié Reference Ezraty and Cavanié1999). Due to the significant salinity and difference in air pockets between MY ice and FY ice, the scattering effect of MY ice is stronger than that of FY ice, resulting in a higher backscatter coefficient in the scatterometer image. Hence, it is possible to set a threshold to separate MY ice and FY ice from the histogram of the scatterometer image. The HT sea ice classification method uses a threshold to classify ice as FY ice or MY ice. In this classification scheme, pixels with σ0 measurements above the threshold are classified as MY ice, while those with measurements below the threshold are classified as FY ice. However, several different thresholds of the histogram have been reported. Kwok (Reference Kwok2004) has applied the HT sea ice classification method according to the threshold selected from the scatterometer histogram to classify FY ice and MY ice with a threshold of -14.5 dB, while Haarpaintner (Reference Haarpaintner and Spreen2007) uses a threshold of -12 dB for the Arctic. As the physical properties of FY ice and MY ice change every day, including surface roughness, brine content and ice thickness, this contributes to the observed differences in backscatter (Tucker et al. Reference Tucker, Grenfell, Onstott, Perovich, Gow, Snuchman and Sutherland1991), and the error may become large if only a fixed threshold is used to classify FY ice and MY ice. Therefore, in this paper, a self-adaptive sea ice classification threshold was adopted according to the distribution of each histogram. Firstly, the histogram of the QuikSCAT scatterometer data covering sea ice was calculated. Secondly, for every histogram of the QuikSCAT scatterometer data covering sea ice, the threshold classifying the MY ice and FY ice was set to the lowest value between two peaks with a constrained condition that the threshold should be in the subjective range between -16 and -12 dB. If there was no minimum in the range of the histogram, a fixed threshold of -14.5 dB was used for the respective day. To mitigate the errors caused by the fluctuation of the histogram, a monthly threshold averaged from the daily threshold of the respective month was used in sea ice classification.
The SM sea ice classification method
The SM sea ice classification method is an empirical relationship between the MY sea ice fraction C MYf and the QuikSCAT backscatter data, which is established based on Radarsat SAR data and QuikSCAT scatterometer data (Spreen Reference Spreen2008). The MY ice fractions of three wintertime months (December 1999–February 2000) were derived from Radarsat data using the Radarsat geophysical processor system (Kwok Reference Kwok, Tsatsoulis and Kwok1998). A seventh-order polynomial was used to fit the relationship between C MYf and QuikSCAT backscatter using a least-squares method. Once the model of the relationship between the MY ice concentration and the QuikSCAT scatterometer data has been built, the MY ice concentration can be retrieved from the QuikSCAT scatterometer data. The model can be expressed as in Eqs (1) & (2).
 $$\eqalign{L_{MY} =\,& 45.4268 + 27.9618{\rm \sigma} _{VV} + 7.08118{\rm \sigma} _{VV}^2 \cr & + 0.943513{\rm \sigma} _{VV}^3 + 0.0720040{\rm \sigma} _{VV}^4 \cr & + 0.00317470{\rm \sigma} _{VV}^5 + 7.53719\cdot 10^{-5}{\rm \sigma} _{VV}^{6} \cr & + 7.46839\cdot 10^{-7}{\rm \sigma} _{VV}^7} $$
 $$C_{MYf} = \left\{ {\matrix{ {0, {\rm \sigma}_{VV} \le -21\; dB} \cr {L_{MY}\; {\rm \;} -21{\rm dB} \le {\rm \sigma}_{VV} \le -9\; dB} \cr {1, {\rm \sigma}_{VV} \ge -9\; dB} \cr}} \right.$$
where σVV refers to the vertical polarization backscatter coefficient of the QuikSCAT, L MY represents the component of the MY ice whose value range is between 0 and 1 and C MYf is the ratio of the MY ice in one pixel, which exceeds 0.5 could be seen as MY ice.
The SC sea ice classification method
Unlike the HT and SM sea ice classification methods based on scatterometer data, the SC method identifies sea ice type based on radiometer data. The MY ice and FY ice have an obvious emissivity difference between Tb(V18.7) and Tb(V36.5), which can be used to distinguish MY ice and FY ice (Zhang et al. Reference Zhang, Guo, Zhang, Liu and Bai2016). The detailed flow of processing of the SC method is described in Eqs (3) & (4).
 $$s\lpar {k_i} \rpar = m\lpar {k_i} \rpar /n\lpar {k_i} \rpar $$
 $$g\lpar {k_i} \rpar = \partial \lsqb {s\lpar {k_i} \rpar } \rsqb /\partial \lpar {k_i} \rpar $$
In Eqs (3) & (4), k i represents the different ratios of Tb(V18.7) to Tb(V36.5) from the radiometer data values. For each ratio value of k i, n(k i) represents the number of pixels with the value of k i. For a pixel with a ratio value k i, m(k i) represents the number of pixels whose neighbour four-pixel value is greater than a threshold P. s(k i) represents the strong contrast value, which is defined as the ratio of m(k i) to n(k i). Furthermore, g(k i) represents the gradient value of s(k i).
Sea ice can then be classified according to the k i–g(k i) plot. When g(k i) reaches a maximum at k i, indicating the pixels with value k i change most intensely, the value of k i would be recognized as a threshold for classifying MY ice and FY ice. Pixels in the ratio image with ratio values above the threshold k i are classified as MY ice, while those below the threshold are classified as FY ice.
Workflow of the data processing
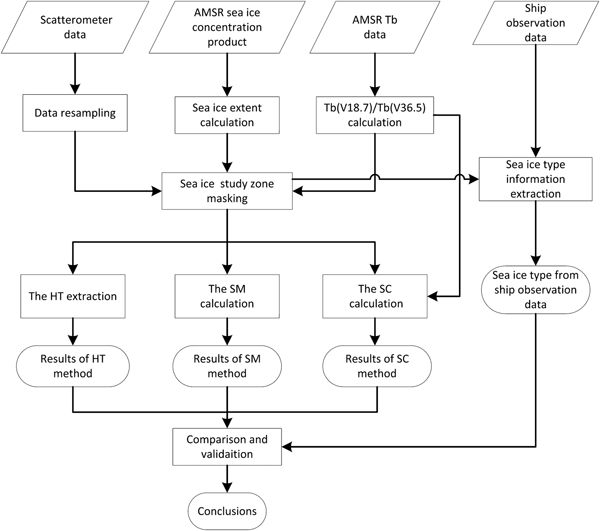
Figure 3 displays the workflow of the data processing in this study. For comparison with the AMSR-E/AMSR2 Tb data, the scatterometer data and the AMSR-E/AMSR2 ASI sea ice concentration data were first resampled to 12.5 km spatial resolution based on the nearest neighbour method, and then sea ice extent was extracted according to the rule that AMSR-E sea ice concentration was greater than 15% (Worby & Comiso Reference Worby and Comiso2004). Meanwhile, the sea ice zone of the Weddell Sea was extracted using a geographical mask of the area. Finally, sea ice in the study area was classified by the HT method, SM method and SC method, respectively, and the results were compared against sea ice-type information extracted from the ASPeCt ship-based observational data.
Workflow of the data processing in this study.

Results
Histogram of the QuikSCAT data from 2004 and 2005 in the Weddell Sea
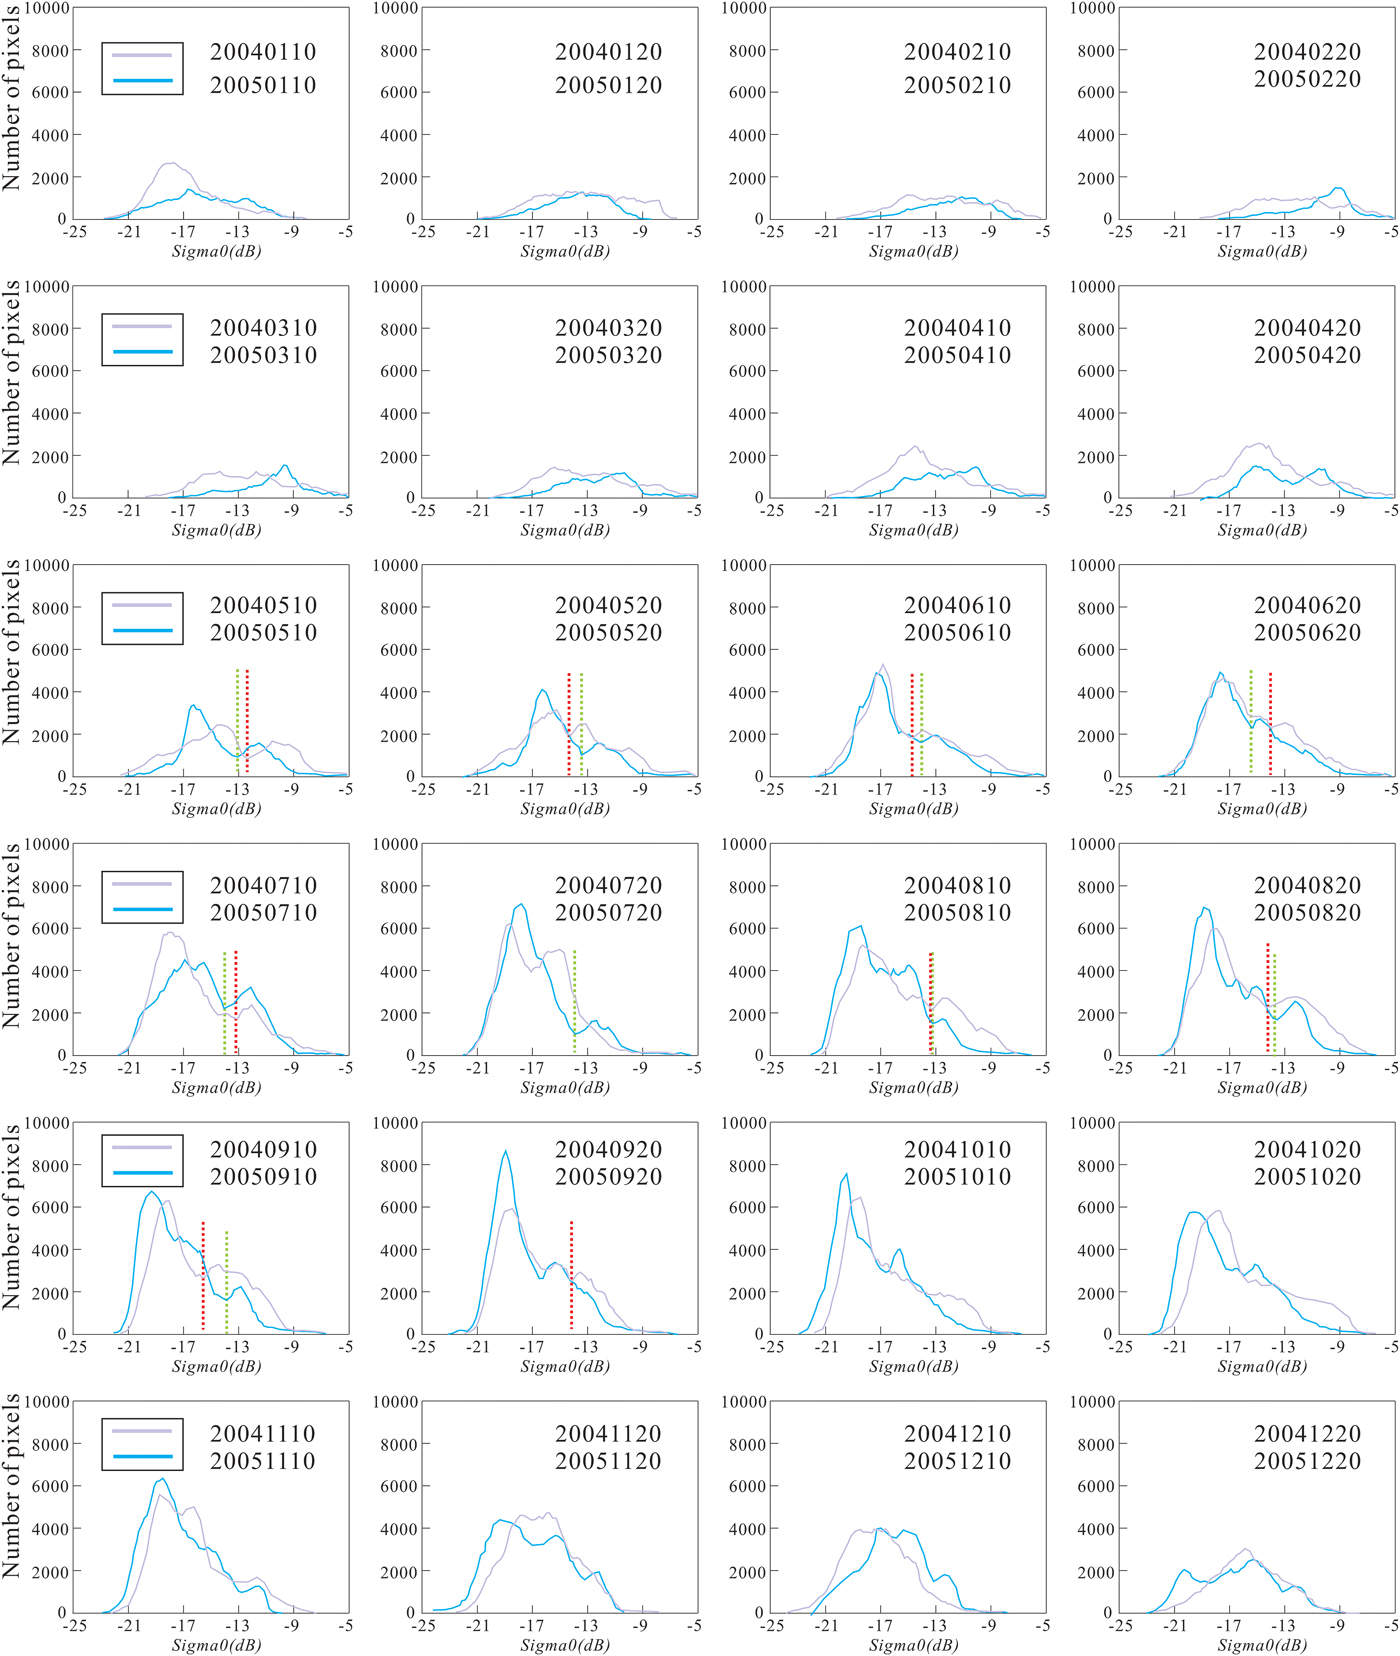
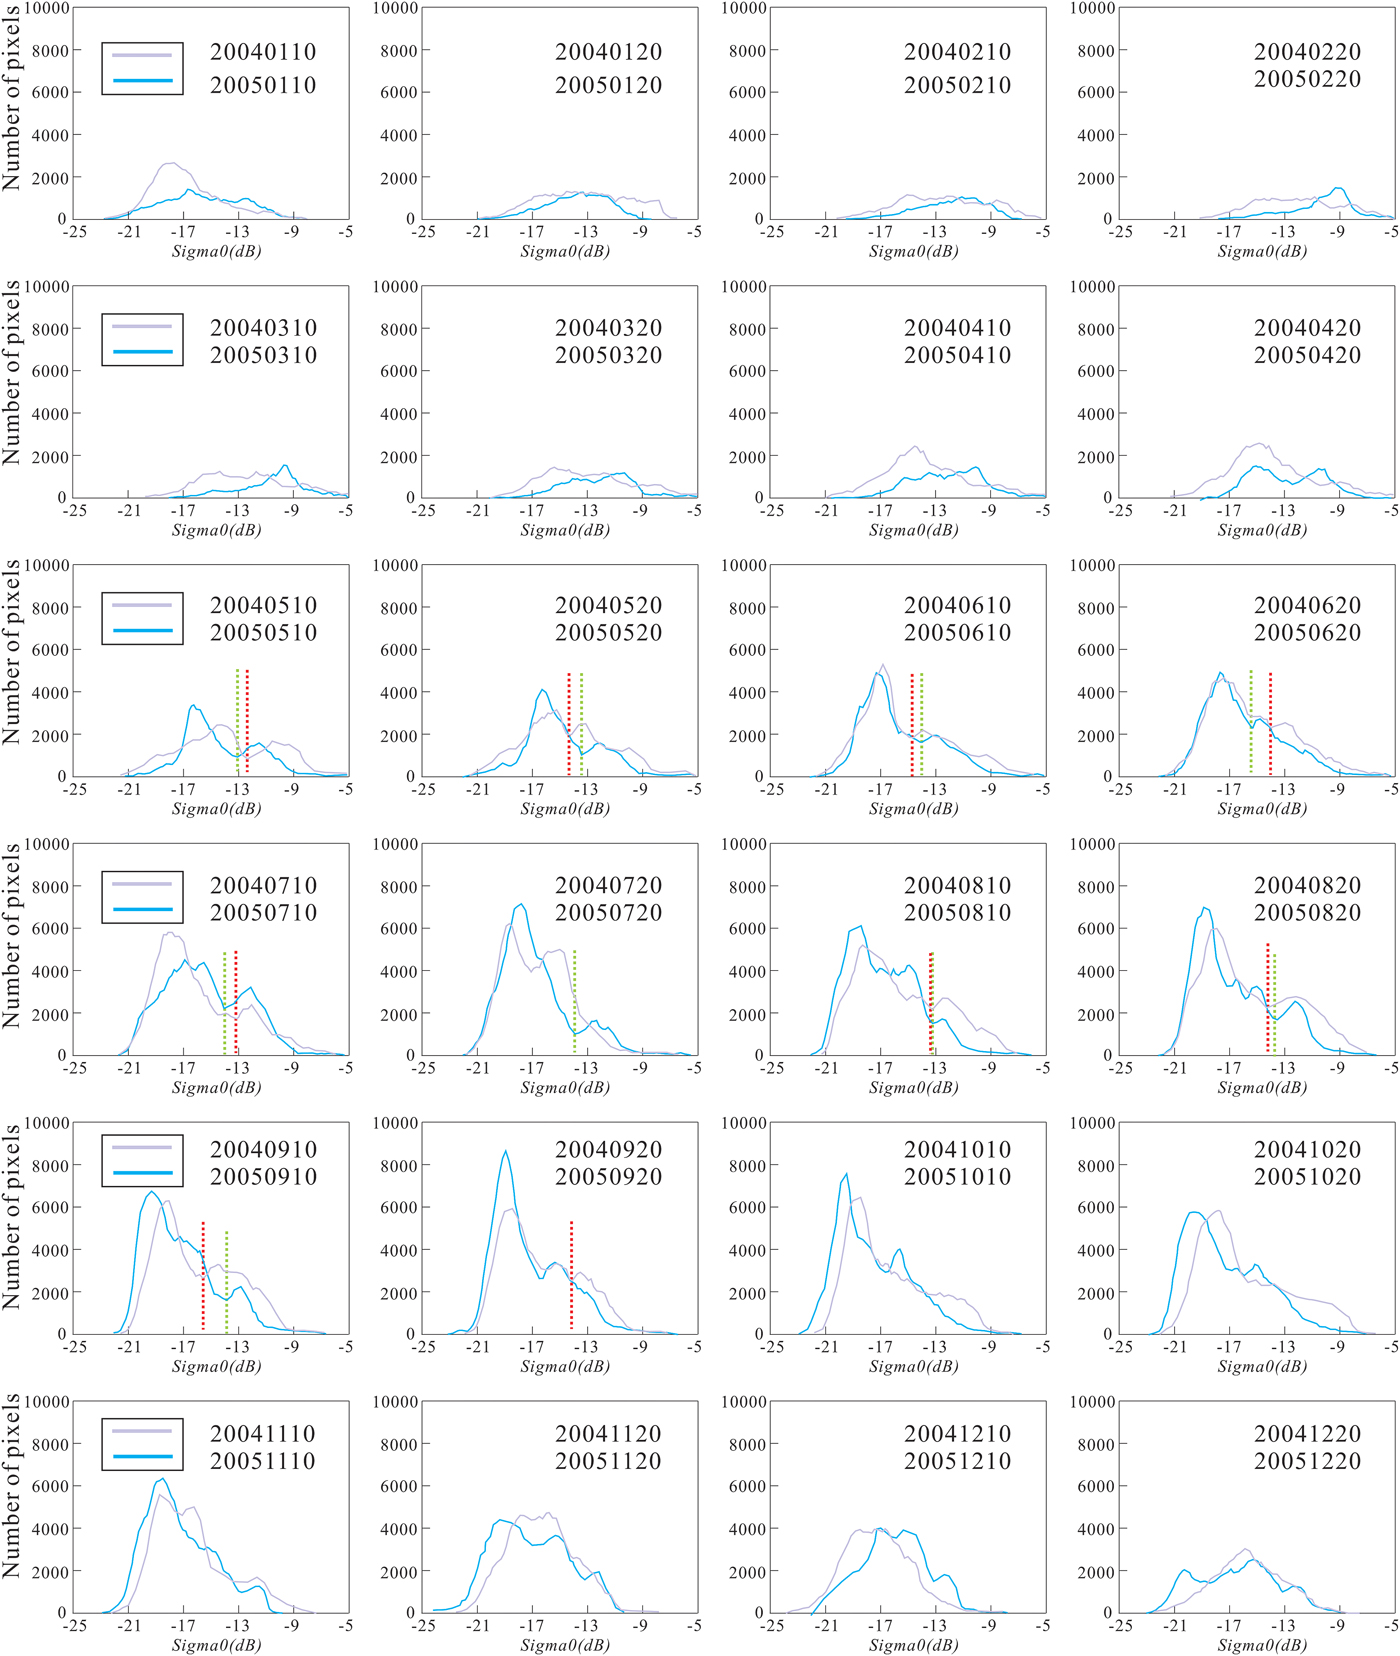
The QuikSCAT scatterometer data of the 10th and 20th days of every month in 2004 and 2005 were selected for making the histogram. The number of sea ice pixels showed an increasing trend from March–September when the ice in the Weddell Sea was in the growth stage, and the opposite was shown from October–December when the Weddell Sea ice was in the melt season. In Fig. 4, the purple lines and blue lines represent the histograms of 2004 and 2005, respectively, and the red and green dashed lines represent the thresholds derived from the HT method for MY ice and FY ice classification in 2004 and 2005. From May–September, most of the thresholds for sea ice classification can be obtained from the Ku-band QuikSCAT scatterometer histogram using the HT method. The thresholds of different months in 2005 range from -13.0 to -15.4 dB, while the thresholds of different months in 2004 range from -12.6 to -15.6 dB.
Histograms of the QuikSCAT data of sea ice for the Weddell Sea in 2004 and 2005. The red and green dashed lines represent the daily thresholds in 2004 and 2005, which were calculated according to the specific histogram to classify the MY ice and FY ice.
Histograms of the ASCAT and OSCAT data from 2013 in the Weddell Sea
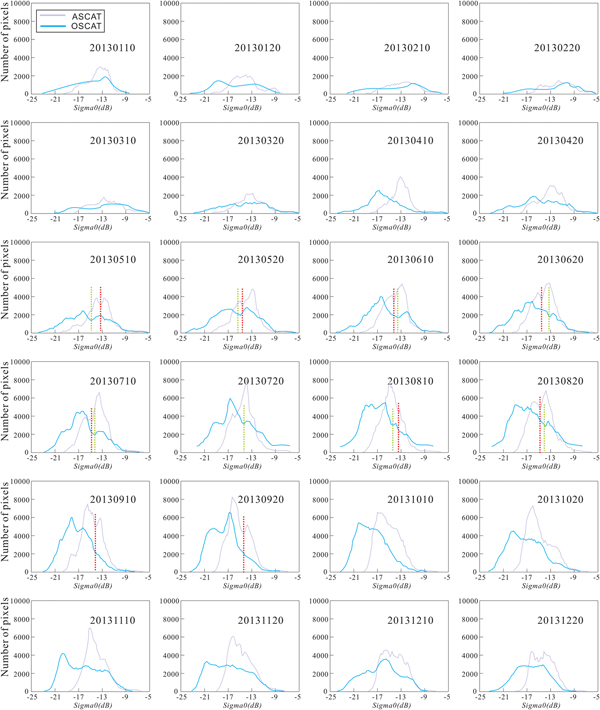
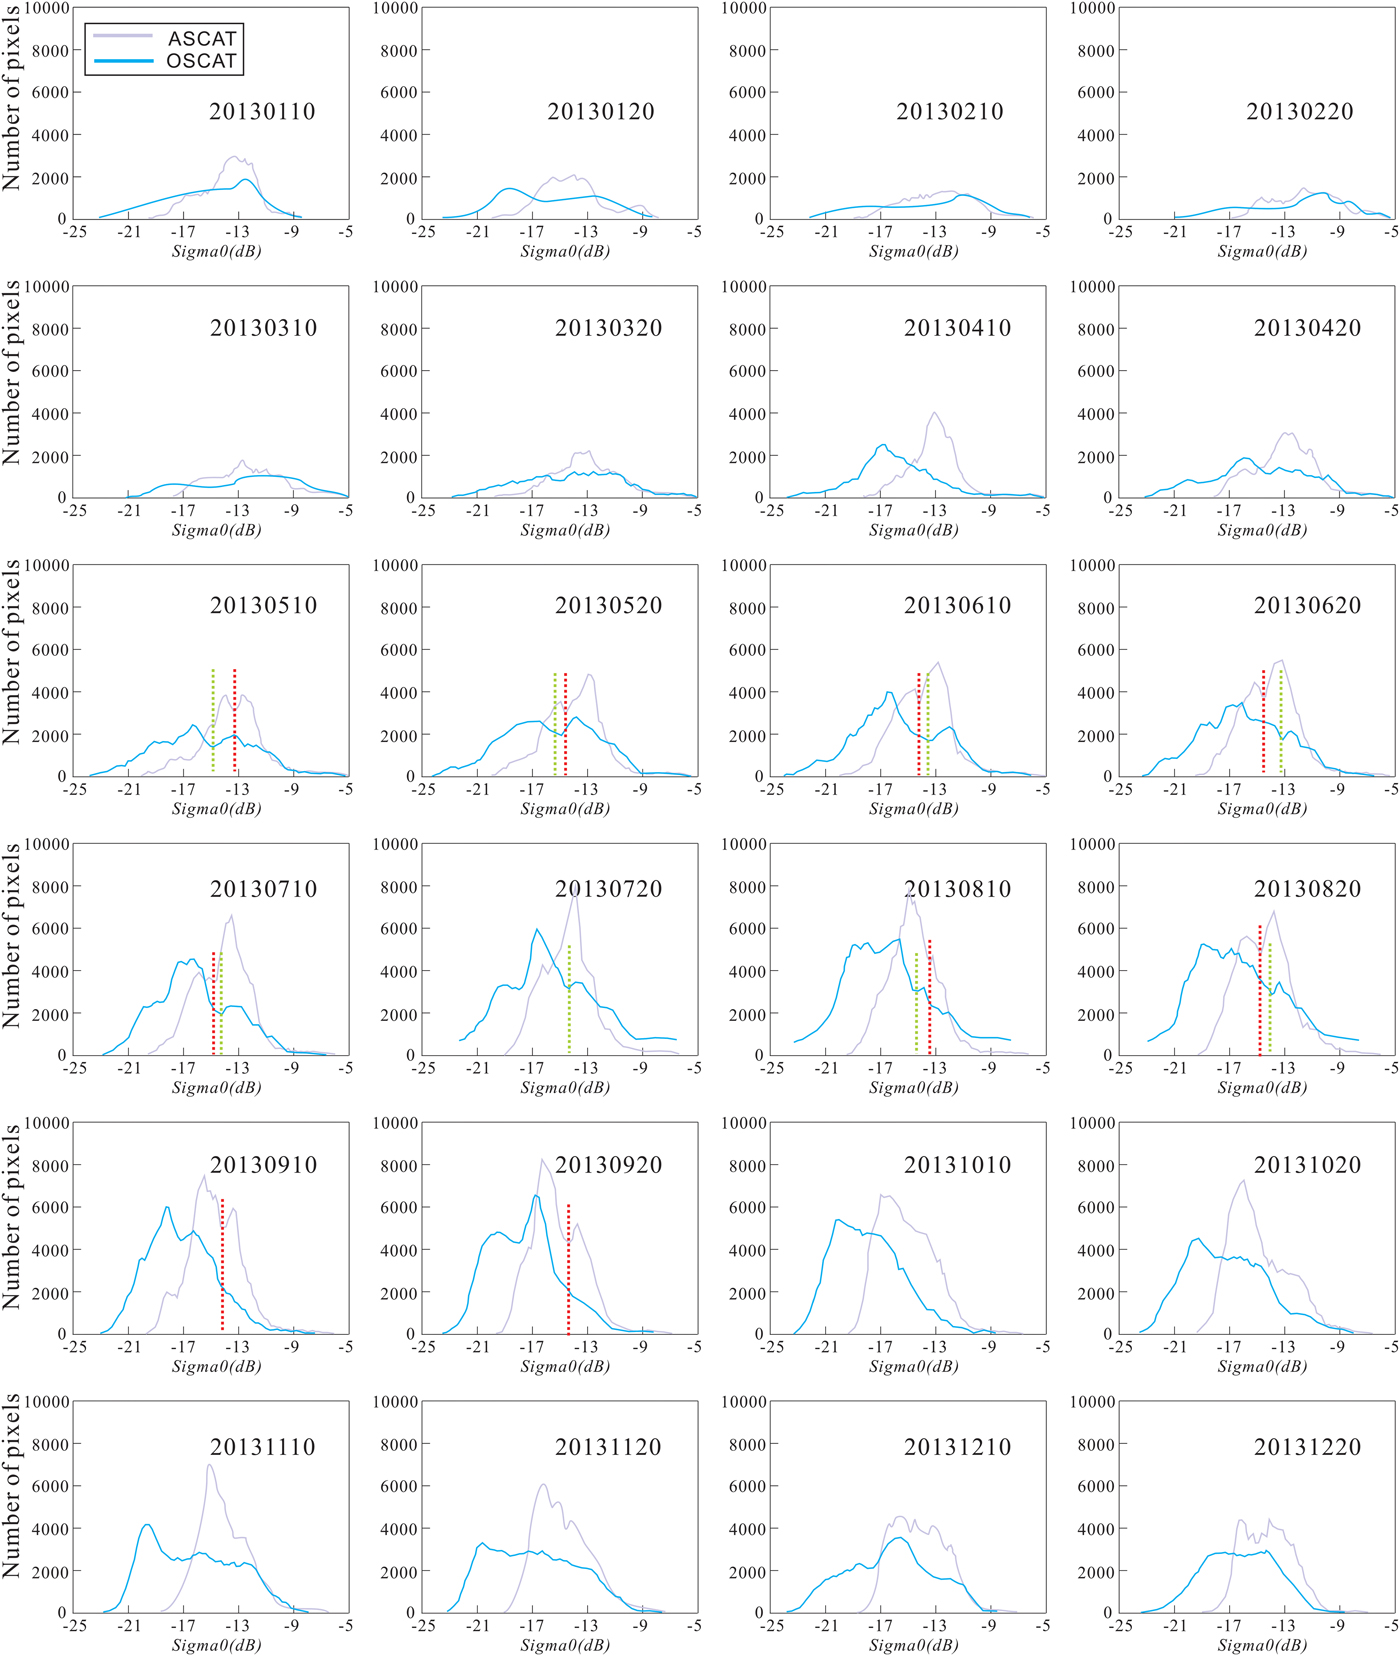
For the purpose of comparing the C-band and Ku-band scatterometer backscatter signals, the ASCAT and OSCAT scatterometer data of the 10th and 20th days of every month in 2013 were selected for making the histograms. In Fig. 5, the purple lines and blue lines represent the histograms of ASCAT and OSCAT in 2013, respectively, and the red and green dashed lines represent the thresholds derived from the HT method for MY ice and FY ice classification in the ASCAT and OSCAT data from 2013. On the same sea ice area, the histograms of ASCAT have a right distribution compared with OSCAT's left distribution. The mean backscatter value of ASCAT appears to be higher than that of OSCAT. The thresholds of different months in 2013 using the OSCAT data range from -13.4 to -15.4 dB, while the thresholds of different months in 2013 using the ASCAT data range from -13.6 to -15.0 dB.
Histograms of the ASCAT and OSCAT data of sea ice for the Weddell Sea in 2013. The red and green dashed lines represent the daily thresholds, which were calculated according to the specific histogram to classify the MY ice and FY ice of the ASCAT and OSCAT data.
Classification results of the HT method, SM method and SC method
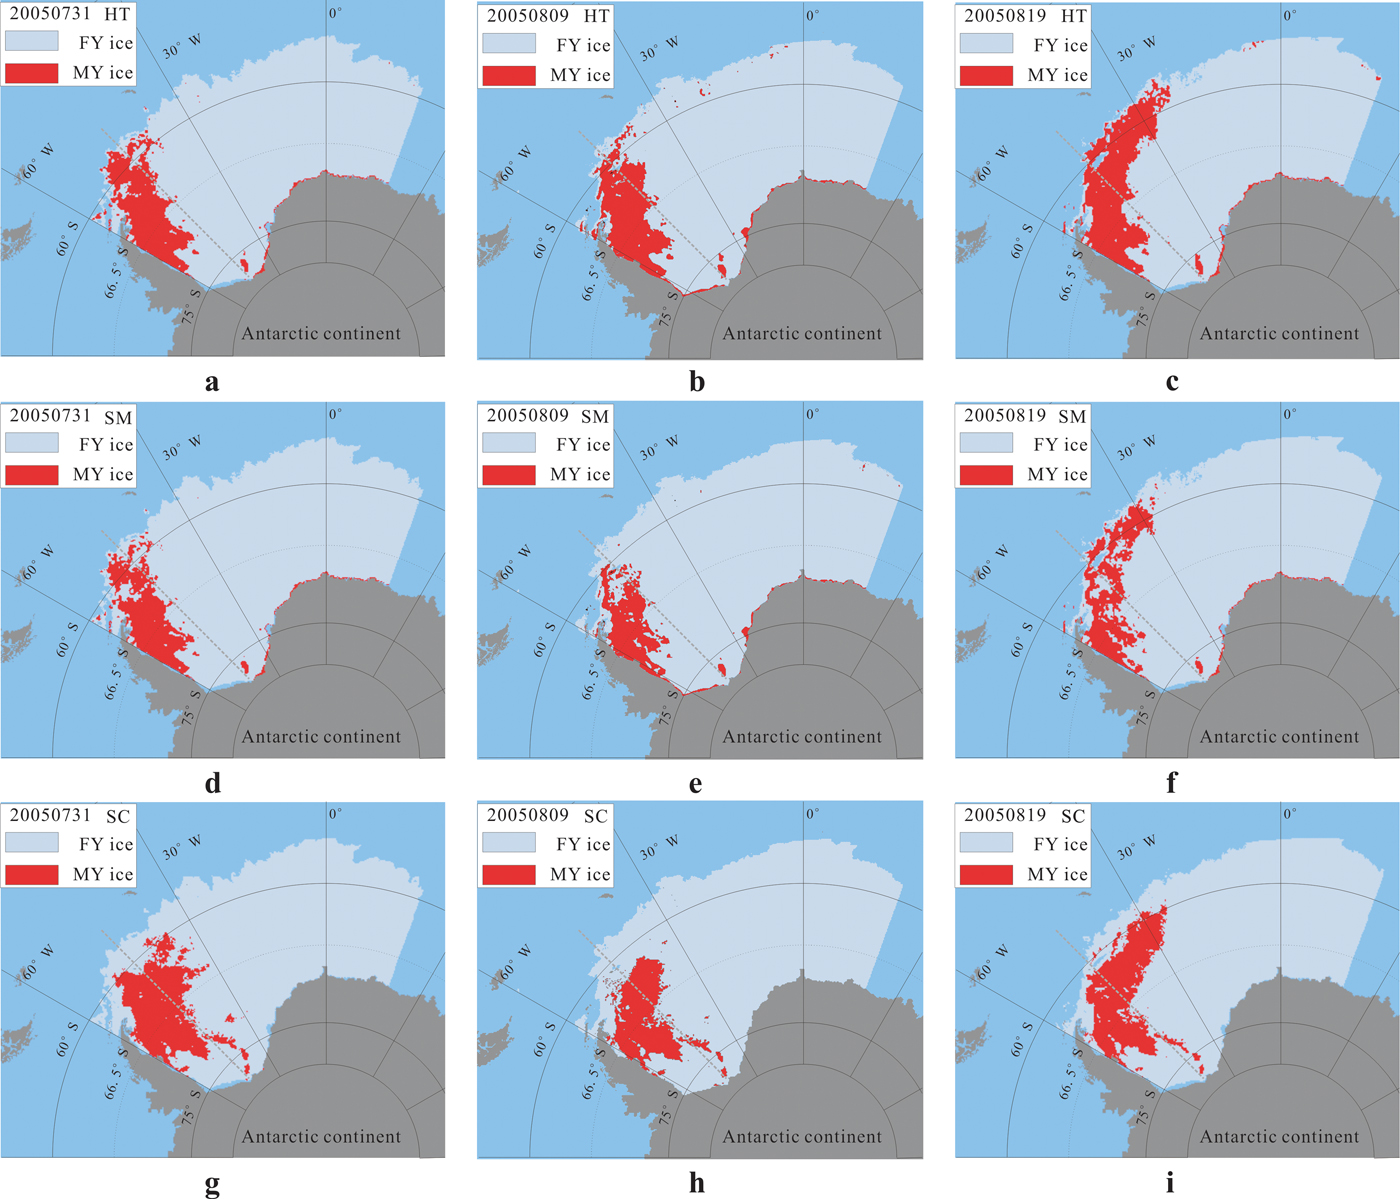
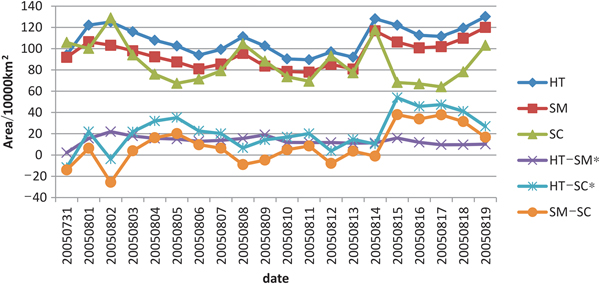
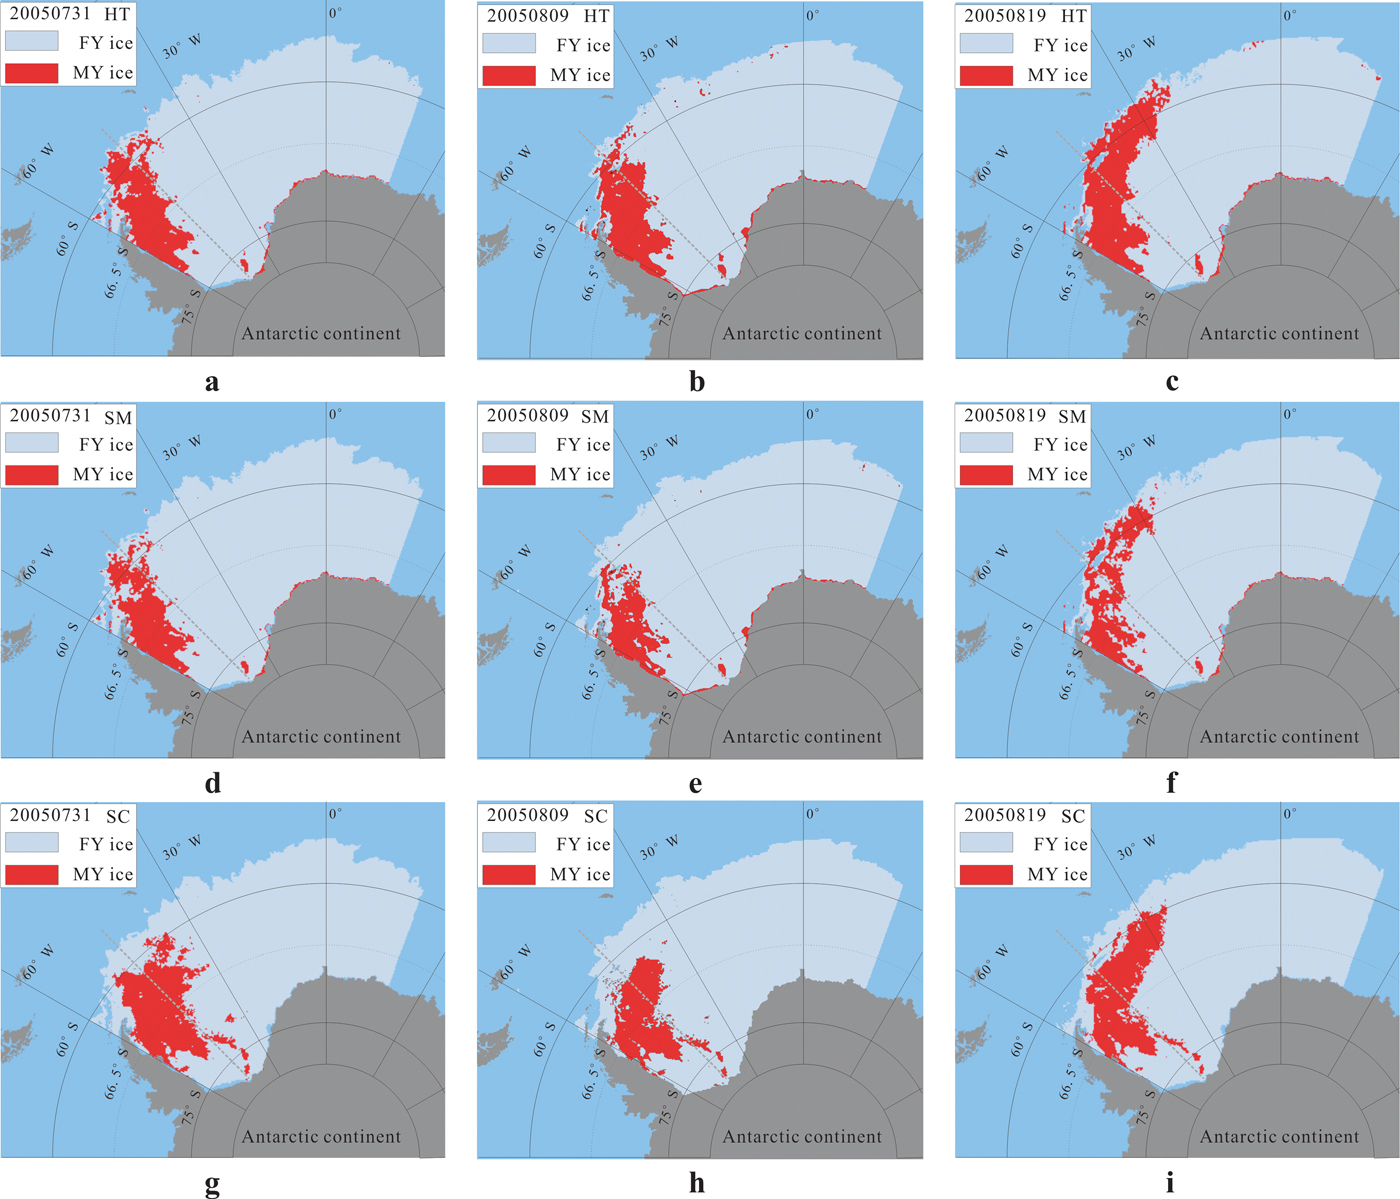
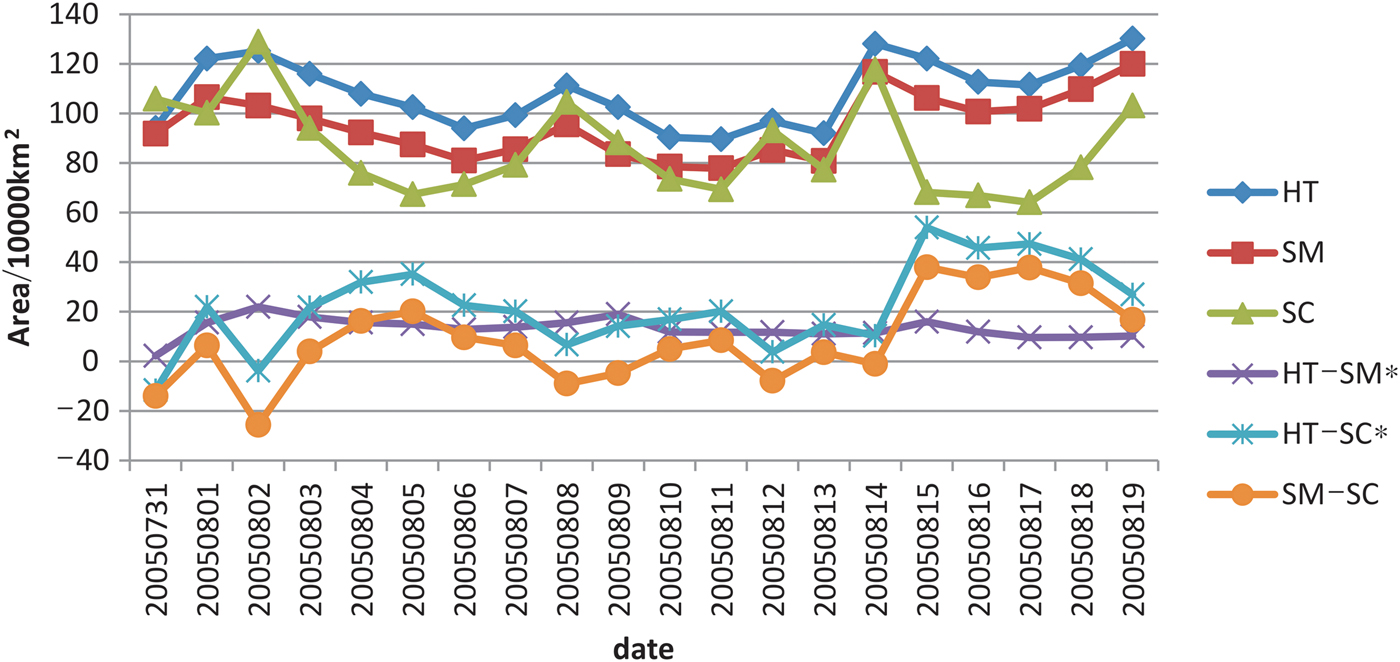
As the time window of ASPeCt ship-based observational data in 2005 for the Weddell Sea was from 30 July 2005–7 September 2005, QuikSCAT data and AMSR-E Tb data from 31 July 2005–19 August 2005 were selected for the sea ice classification using the HT method, SM method and SC method, respectively. The representative classification results of 31 July, 9 August and 19 August 2005 are shown in Fig. 6. The MY ice area and the differences between different methods derived from the HT method, SM method and SC method from 31 July 2005–19 August 2005 are shown in Fig. 7. The HT–SM (differences between the HT method and SM method) and HT–SC (differences between the HT method and SC method) are statistically significant.
Comparison of sea ice type between the HT method, SM method and SC method: a., b. and c. are the classification results based on the HT method; d., e. and f. are the classification results based on the SM method; and g., h. and i. are the classification results based on the SC method.
The MY ice area of the HT method, SM method and SC method and the differences between the different methods using QuikSCAT scatterometer data and AMSR-E radiometer data from 31 July 2005–19 August 2005. The asterisks indicate that the differences between the methods are statistically significant.
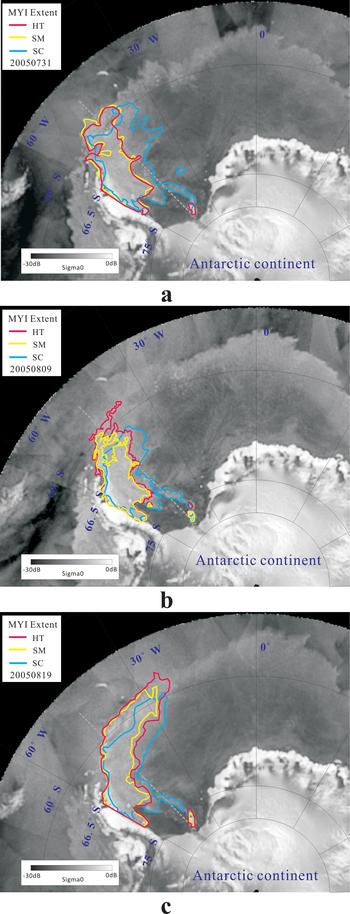
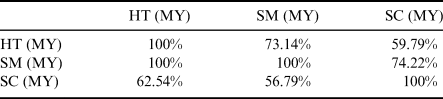
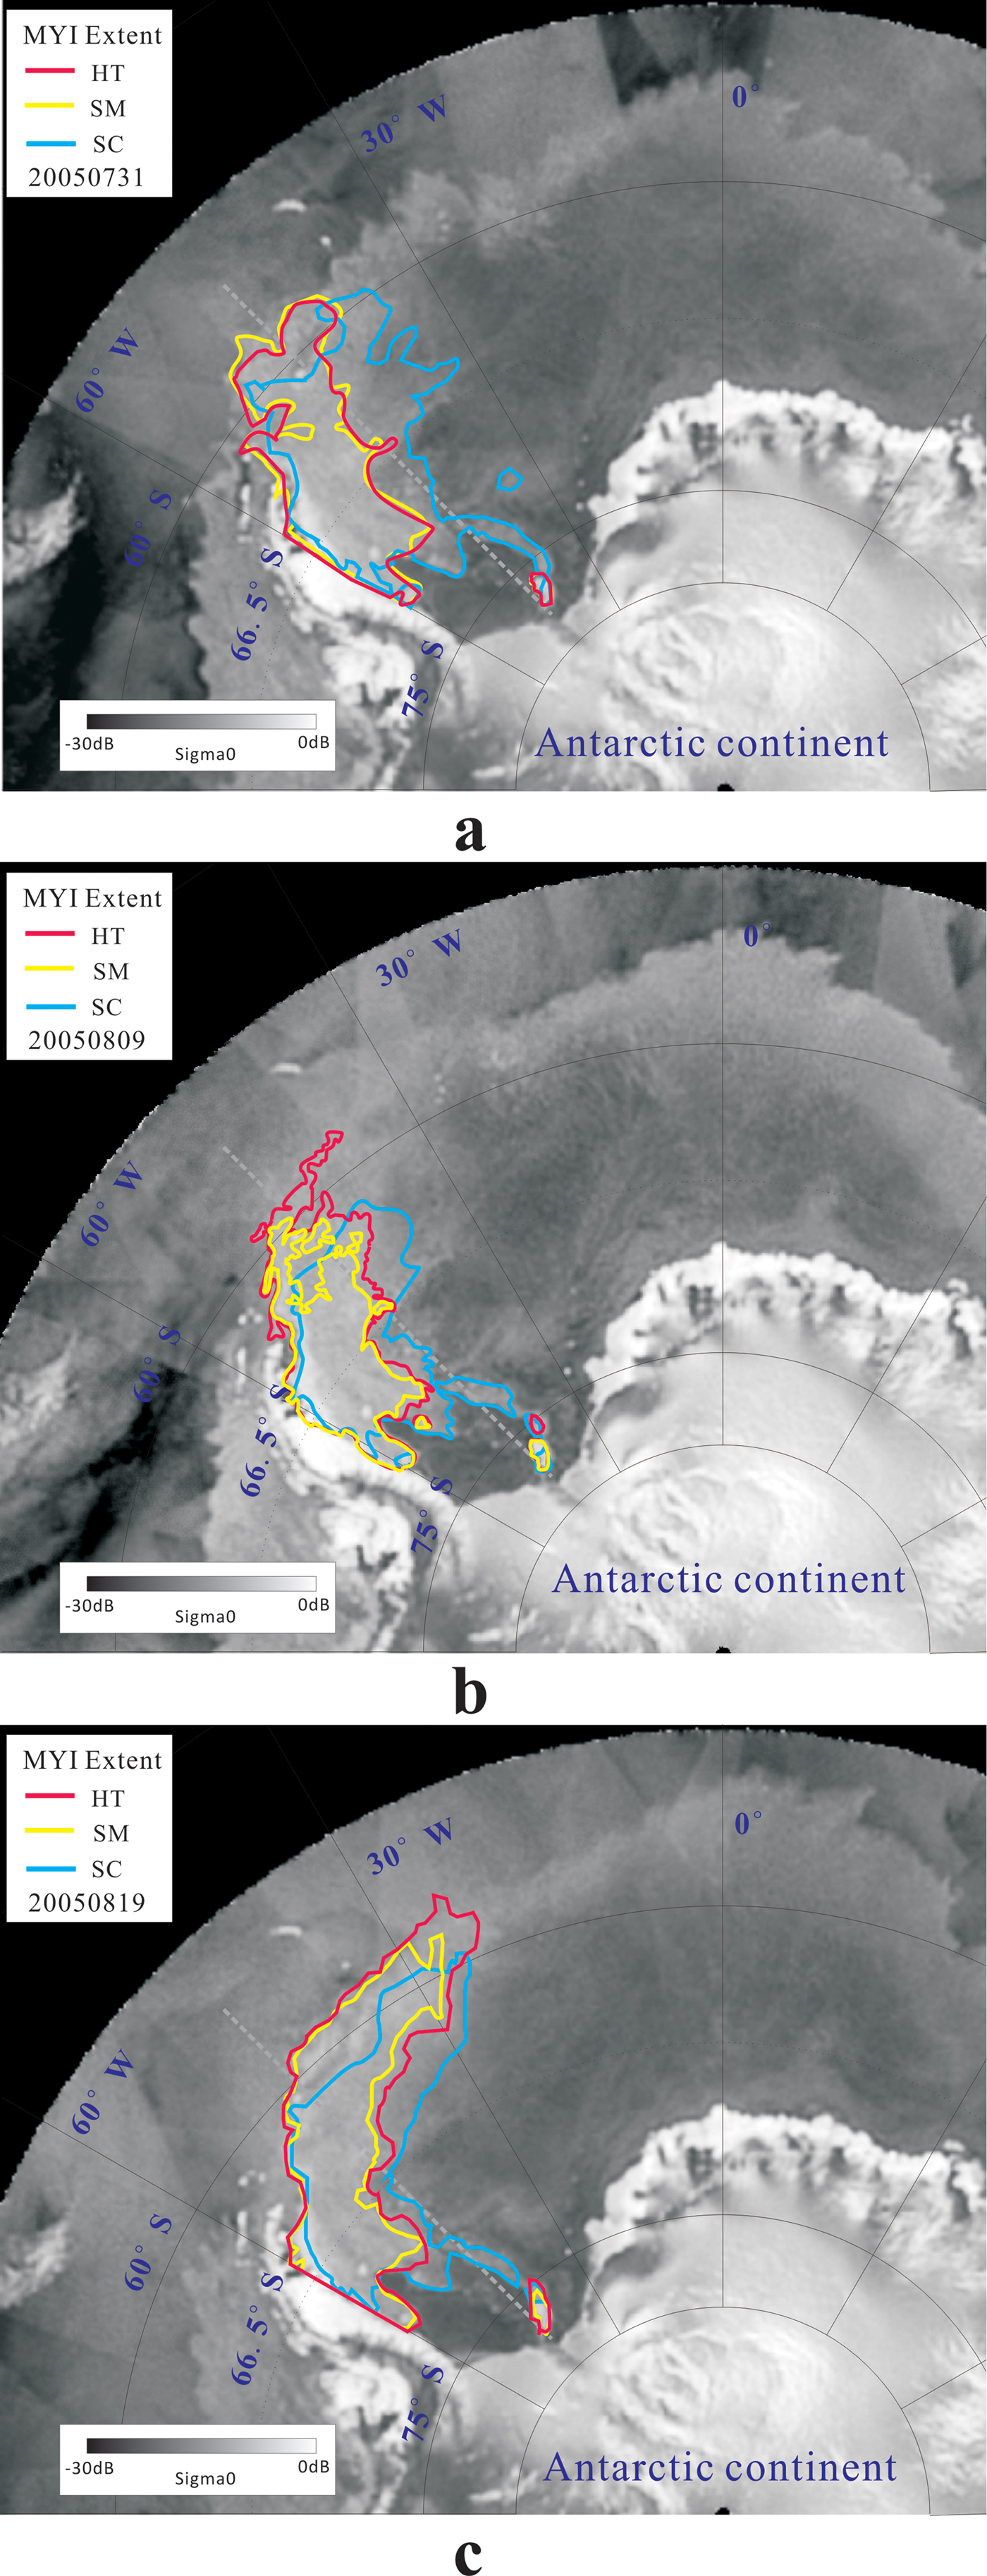
In Fig. 8, the red, yellow and blue lines represent the MY ice extents of the specific days derived from the HT method, SM method and SC method, respectively, and all three methods can retrieve sea ice-type information from satellite scatterometer or radiometer data in 2005. The MY ice was mainly in the West Weddell Sea region and the FY ice was mainly distributed in the East Weddell Sea. To further reveal the differences and similarities between the different methods, a round-robin exercise was performed by comparing one method to the other two methods (Table I). The HT-to-SM represents the ratio of the matched MY ice area classification results of the HT method and SM method to the MY ice area of the HT method. The HT-to-SM and SM-to-HT were 73.14% and 100%, respectively, while the SC-to-HT and HT-to-SC were 62.54% and 59.79%. Meanwhile, the SC-to-SM and SM-to-SC were 56.79% and 74.22%.
Comparison of the MY ice (MYI) extent in the Weddell Sea of Antarctica derived from the HT method (red polygon), SM method (yellow polygon) and SC method (blue polygon). a. Results from 31 July 2005, b. results from 9 August 2005, c. results from 19 August 2005, overlapped with the QuikSCAT σ0 image of the same day as the background.
The match of MY ice classification results for the three different methods. The percentages were calculated using the ratios of the matched two methods.

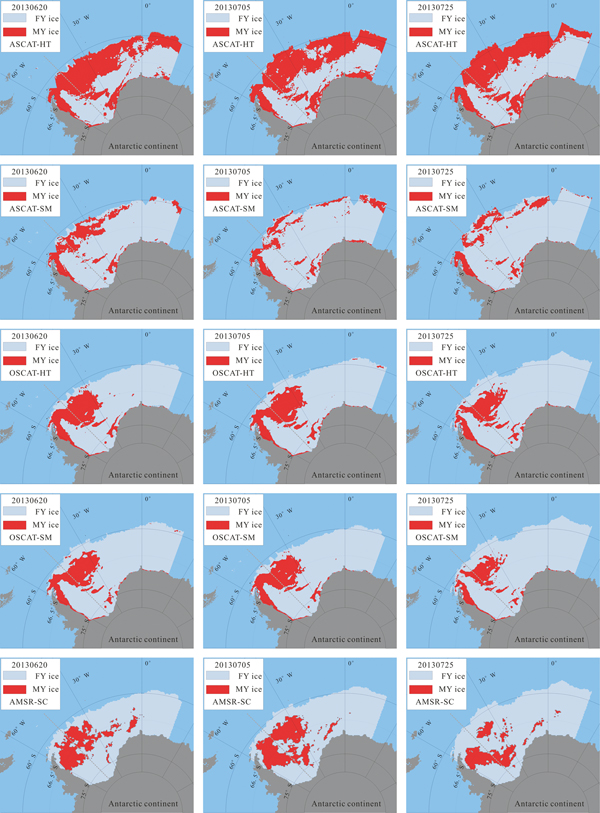
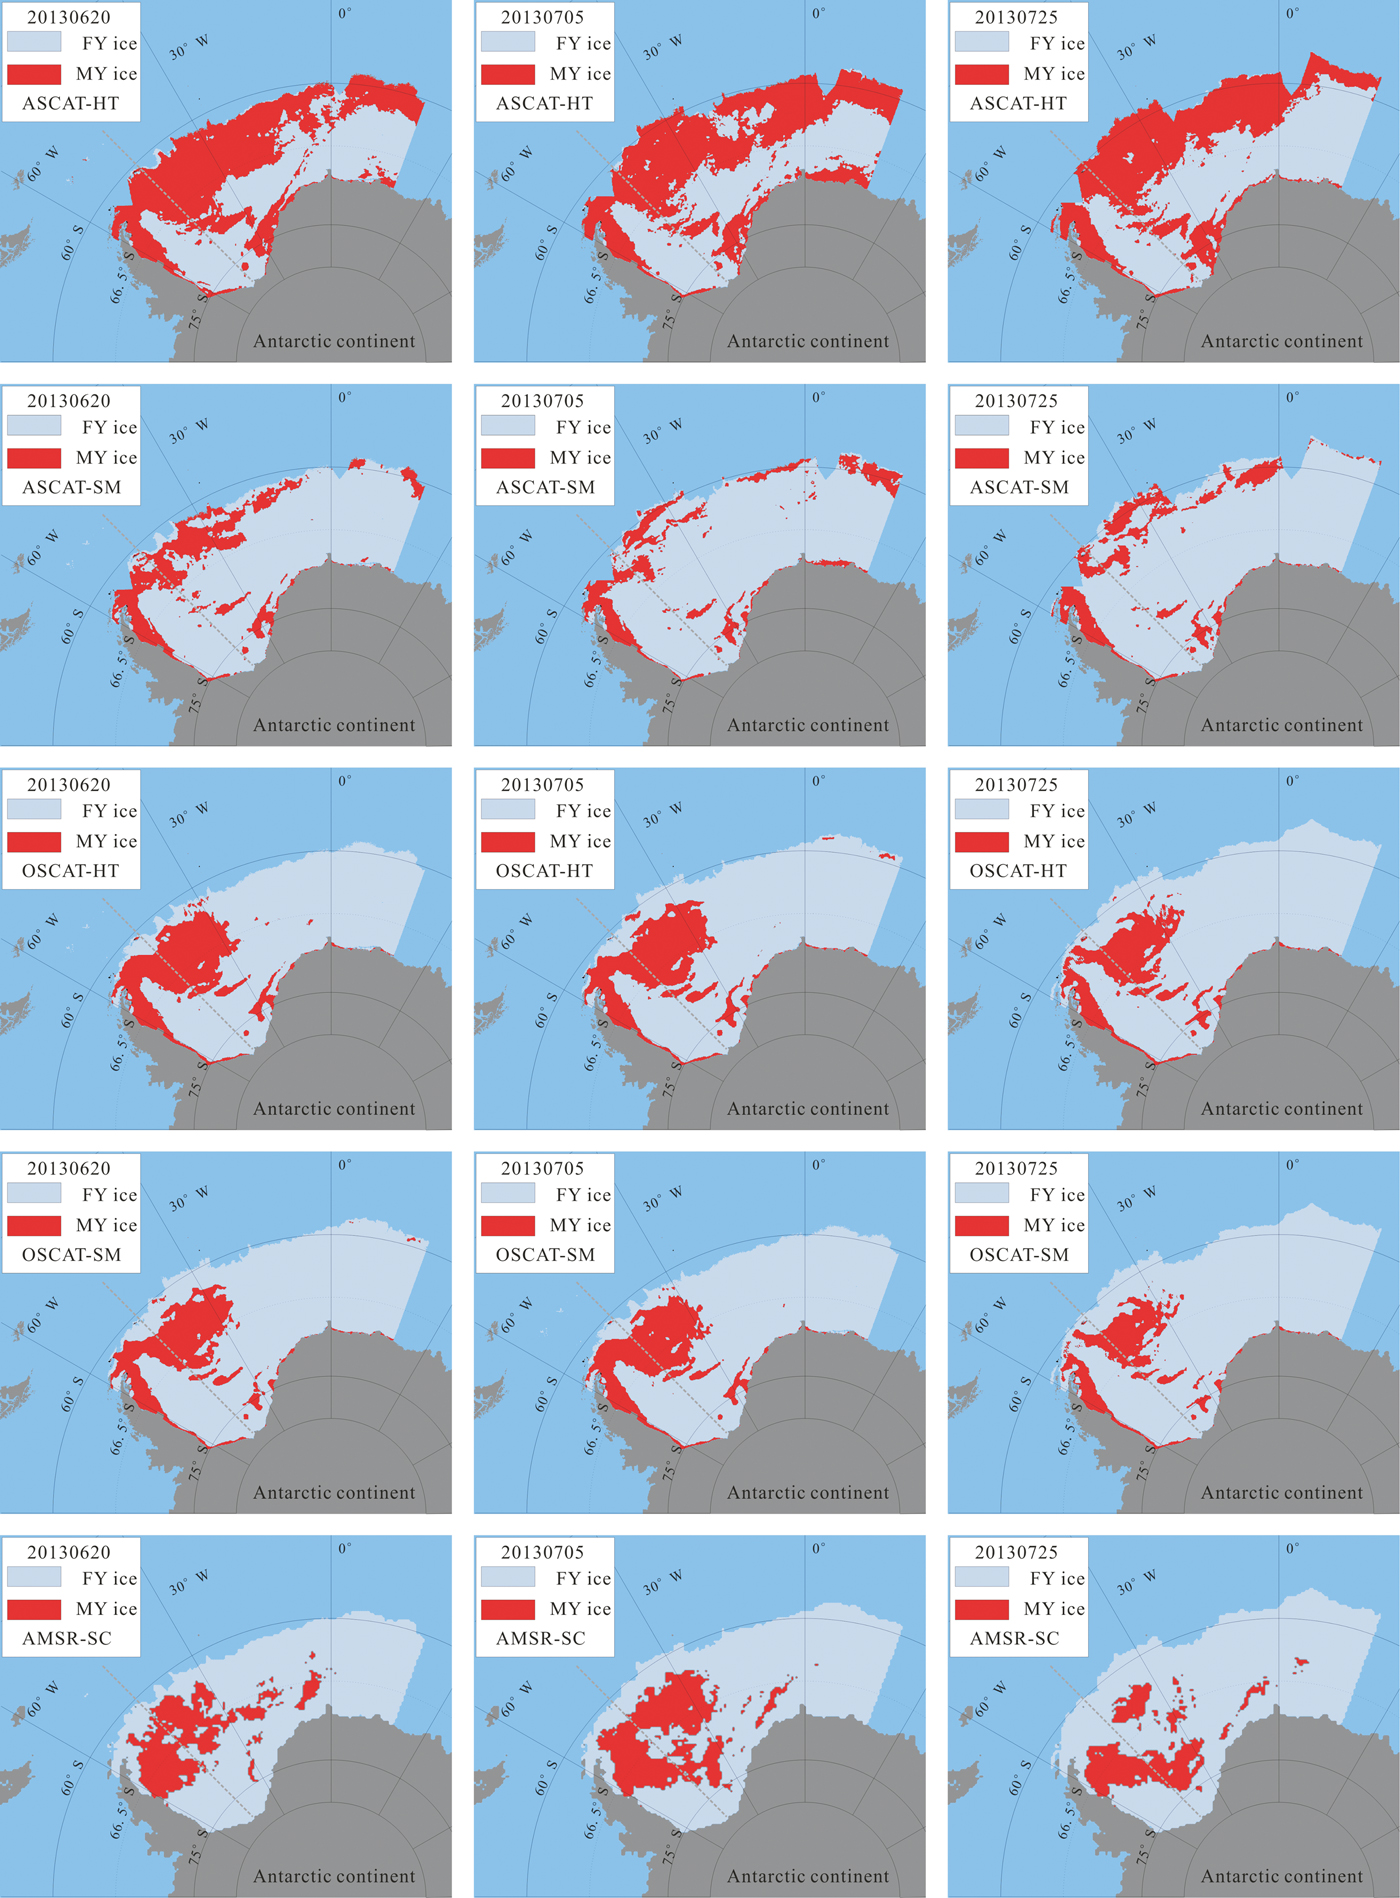
As the time window of ASPeCt ship-based observational data in 2013 for the Weddell Sea was from 17 June 2013–8 August 2013, in order to compare the MY ice distribution derived from C-band and Ku-band scatterometer data, ASCAT scatterometer data, OSACT scatterometer data and AMSR-2 Tb data from 18 June 2013–8 August 2013 were selected for the sea ice classification using the HT method, SM method and SC method, respectively. The representative classification results of 20 June, 5 July and 25 July 2013 are shown in Fig. 9. The first and second rows in Fig. 9 denote the sea ice classification results from ASCAT scatterometer data using the HT method and SM method. The MY ice extent derived from C-band ASCAT using the HT method and SM method appears to be an erroneous classification result. The reason for this erroneous classification result when using ASCAT data is explored in the Discussion.
Comparison of sea ice type between the HT method, SM method and SC method based on different data in 2013. The results in the first and second rows are the classification results based on the HT and SM methods using ASCAT scatterometer data; the results on the third and fourth rows are the classification results based on the HT and SM methods using OSCAT scatterometer data; the results on the fifth row are the classification results based on the SC method using AMSR2 data.
Monthly MY ice area of the different methods in the Weddell Sea
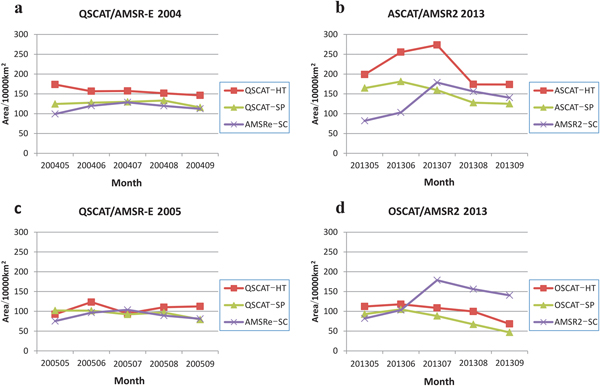
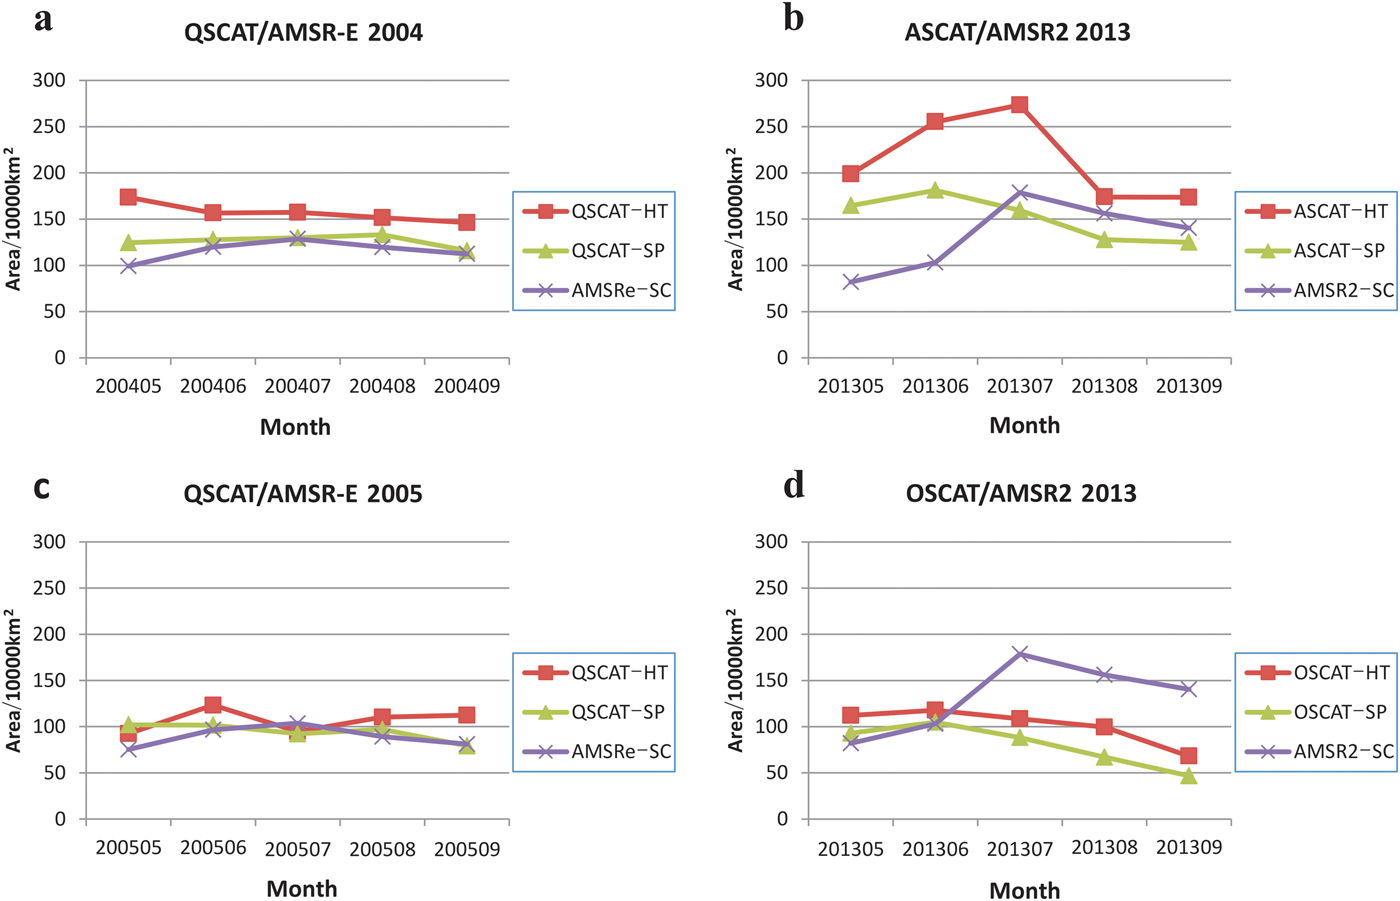
The monthly MY ice area of the Weddell Sea as identified with different methods during the sea ice growth season (May–September) is show in Fig. 10. Figure 10a & c show the monthly MY ice area in 2004 and 2005 using QuikSCAT and AMSR-E data. Figure 10b & d show the monthly MY ice area in 2013 using ASCAT and OSCAT scatterometer data, respectively. For the 2004 QuikSCAT scatterometer data and AMSR-E data, the identified monthly extent of MY ice ranged from 146.2 × 10⁴ km2 to 173.5 × 10⁴ km2 based on the HT method, while for the SM method it ranged from 115.8 × 10⁴ km2 to 133.2 × 10⁴ km2, and for the SC method it ranged from 99.2 × 10⁴ km2 to 128.5 × 10⁴ km2. For the 2005 QuikSCAT scatterometer data and AMSR-E data, the identified monthly extent of MY ice ranged from 92.5 × 10⁴ km2 to 123.52 × 10⁴ km2 based on the HT method, while for the SM method it ranged from 79.4 × 10⁴ km2 to 102.1 × 10⁴ km2, and for the SC method it ranged from 75.3 × 10⁴ km2 to 103.7 × 10⁴ km2. For the 2013 OSCAT scatterometer data and AMSR2 data, the identified monthly extent of MY ice ranged from 68.1 × 10⁴ km2 to 117.9 × 10⁴ km2 based on the HT method, while for the SM method it ranged from 46.8 × 10⁴ km2 to 104.8 × 10⁴ km2, and for the SC method it ranged from 82.0 × 10⁴ km2 to 178.6 × 10⁴ km2.
The monthly MY ice area of the HT method, SM method and SC method using different data. a. and c. show the monthly MY ice area using QuikSCAT (QSCAT) scatterometer data and ASMR-E data in 2004 and 2005, respectively. b. Shows the monthly MY ice area using ASCAT scatterometer data and ASMR2 data in 2013. d. Shows the monthly MY ice area using OSCAT scatterometer data and ASMR2 data in 2013.
Validation based on the ASPeCt ship-based observation data
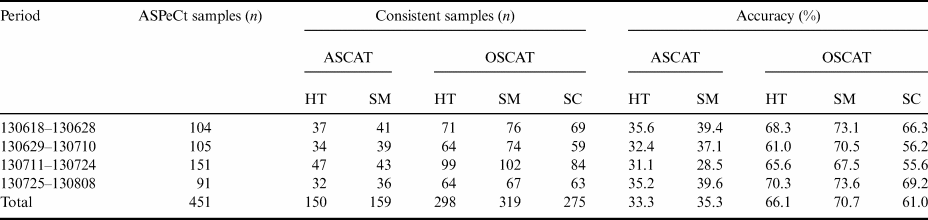
The sea ice classification results of the three methods using QuikSCAT scatterometer data and AMSR-E data were assessed with 2005 ASPeCt ship-based observations on the same dates, which are shown in Table II. The classification accuracies were 77.8%, 80.3% and 73.5% for the HT method, SM method and SC method, respectively. The sea ice classification results of the three methods using ASCAT scatterometer data, OSCAT scatterometer data and AMSR2 data were assessed with 2013 ASPeCt ship-based observations on the same dates, which are shown in Table III. The classification accuracies were 66.1%, 70.7% and 61.0% for the HT method, the SM method using OSCAT data and the SC method using AMSR2 data, respectively. The classification accuracies were 33.3% and 35.3% for the HT method and SM method using ASCAT data, which indicates that the HT method and SM method are not available in C-band scatterometer data. Relatively speaking, using Ku-band QuikSCAT and OSCAT scatterometer data was better than using AMSR-E and AMSR2 passive microwave data for sea ice classification in the Weddell Sea, and the accuracy of the SM method was greater than the HT method using Ku-band scatterometer data. The uncertainty regarding the validation data is explored in the discussion section.
Comparison of sea ice classification results based on the HT method, SM method and SC method with 2005 ship-based sea ice-type observational data.

Comparison of sea ice classification results based on the HT method, SM method and SC method using ASCAT, OSCAT and AMSR-2 data with 2013 ship-based sea ice-type observational data.

Discussion
During the growth season of sea ice in the Weddell Sea, there is usually an evident peak–valley structure for the ice classification discriminating threshold from the QuikSCAT scatterometer histogram, but the threshold is not obvious during the sea ice-melting season, which is consistent with the conclusion that Kwok (Reference Kwok2004) drew from the scatterometer histogram of Arctic sea ice. The presence of the peak–valley structure in the histogram during the sea ice growth season (Fig. 4) indicates that there are two major types of sea ice, allowing us to obtain a threshold for discriminating MY ice and FY ice from the scatterometer data, not only for the Arctic sea ice classification, but also for the Antarctic MY ice and FY ice discrimination. The FY sea ice usually has lower backscatter because of its relatively high salinity, which can cause surface backscatter to be the dominant component of the radar return rather than volume backscatter (Kwok et al. Reference Kwok, Cunningham and Yueh1999). The scattering from the inhomogeneity of the low-salinity MY sea ice volume, hummocks and ridges within the scatterometer resolution element presents a characteristic of high backscatter. However, the backscatter signatures of FY sea ice and MY sea ice as measured by scatterometer will be mixed due to the melting of sea ice during summer (Haarpaintner et al. Reference Haarpaintner, Tonboe, Long and Van Woert2004).
The backscatter coefficient of sea ice is affected by the formation of superimposed ice and flooding. Antarctic sea ice tends to be covered by thicker snow, which may accumulate to the point that the weight of snow pushes the ice below sea level, causing the snow to become flooded by salty ocean waters. When flooding occurs, subsequent freezing of the mixture of snow and seawater leads to the formation of snow ice (Jeffries et al. Reference Jeffries, Krouse, Hurstcushing and Maksym2001). In austral summer, the positive surface energy balance of the Weddell Sea leads to the formation of superimposed ice. Superimposed ice contains air bubbles that are several millimetres in diameter with almost zero salinity. The properties of superimposed ice significantly enhance the microwave volume scattering and surface scattering of sea ice, resulting in an increase in the backscatter value (Haas Reference Haas2001). In austral autumn, when the superimposed ice formation ceases due to surface cooling, gradual surface flooding with seawater becomes the dominant process. Submergence of floe ices due to the mass of overlying snow leads to flooding, resulting in a decrease in backscattering coefficients (Haas Reference Haas2001). The superimposed ice formation could lead to greater MY ice detection, while the flooding could lead to less MY ice detection. The effect of superimposed ice formation and flooding on the backscatter coefficient may make the backscatter unstable, which could introduce some uncertainty into the results of sea ice classification.
From the sea ice classification results (Fig. 8), it can be seen that most of the MY sea ice is located in the West Weddell Sea east of the Antarctic Peninsula for all three sea ice classification methods. In the Weddell Sea, the ocean structure limits ice melting because the oceanic heat flux is only a few watts per square metre, and wind change prevents the large-scale northward movement of the pack ice, even in summer (Hunke & Ackley Reference Hunke and Ackley2001). During a field experiment in the West Weddell Sea, Hellmer et al. (Reference Hellmer, Christian, Dieckmann and Michael2006) describes the MY ice distribution, which is mainly along the Antarctic Peninsula from the Envisat SAR images.
The HT and SM sea ice classification methods based on the scatterometer data show nearly the same extent of MY ice. The round-robin exercise (Table I) further reflects the fact that the HT method and SM method have more similar classification results than the SC method. This may be due to the fact that the two methods used the same data source for scatterometer measurements. In terms of ice classification validation, the comparison with ASPeCt observed MY and FY sea ice shows that satellite Ku-band backscatter has been found to produce more stable results than the microwave Tb, which is similar to the results of Ezraty & Cavanié (Reference Ezraty and Cavanié1999).
It should be noted that the ASPeCt data contain some uncertainty, and validation data are sparse in the Weddell Sea. However, the ASPeCt data are still a valuable dataset for the validation of large-scale sea ice classification in the Weddell Sea. The ASPeCt data originate from individual observations from different people with different levels of experience, which introduces some uncertainty into the data. Furthermore, polar research vessels generally tend to sail in areas with thinner sea ice due to their limited ice-breaking ability in order to avoid becoming stuck in thick ice. In general, MY ice is thicker than FY ice, so the sea ice-type information collected according to the ASPeCt protocol along the research vessel route is likely to tend towards FY ice, which also introduces uncertainty into the validation data. The limitations of the ASPeCt data may lead to an underestimation of the MY ice. Due to the lack of validations of sea ice classification in the Weddell Sea, the ASPeCt ship-based observation data may still be valuable data for validation.
The erroneous classification results using ASCAT scatterometer data in Fig. 9 were caused by high backscatter values reflected from the marginal ice zone (MIZ). The longer wavelength of the ASCAT C-band sensors compared to the OSCAT K-band results in less sensitivity to volume scattering from porous MY ice, but more sensitivity to the MIZ, causing increased backscatter from FY ice (Rivas et al. Reference Rivas, Verspeek, Verhoef and Stoffelen2012). The area of FY ice typically exhibits lower backscatter values relative to MY ice, in part because of a higher brine content, which increases electromagnetic absorption and reduces backscatter (Shokr Reference Shokr1998). However, sea ice in the MIZ area becomes rough or fragmented due to the incursion of ocean waves, so the FY ice in the MIZ area could exhibits high backscatter signals in the C-band scatterometer data, and this could lead to erroneous MY ice classification in the MIZ area when using the HT and SC methods.
Conclusions
Sea ice type (MY ice and FY ice) is an important parameter of sea ice, and it provides crucial information for climate change modelling. In this paper, sea ice in the Weddell Sea was classified by the HT method, SM method and SC method from satellite scatterometer and radiometer data, and the classification results were evaluated against ASPeCt ship-based observational data. It is concluded that using Ku-band scatterometer data is better than using passive microwave data for sea ice classification in the Weddell Sea. C-band ASCAT scatterometer data are not available for sea ice classification when using the HT method and SM method compared with Ku-band scatterometer data. From the comparison with ship-based observations, the SM method is shown to be more accurate than the HT method, and hence it is more suitable for classifying sea ice type from scatterometer data. This comparison of sea ice classification methods may provide a reference for obtaining long time series sea ice-type information for the whole Antarctic.
Acknowledgements
The authors would like to thank the BYU, the National Snow and Ice Data Center, the Japan Aerospace Exploration Agency, PANGAEA and the Australian Antarctic Data Centre and for providing QuikSCAT, ASCAT, OSCAT, AMSR-E, AMSR2 and ASPeCt sea ice conditions data. The authors acknowledge the support from the National Natural Science Foundation of China (41606215, 41576188), the National Key Research and Development Program of China (2017YFA0603104), the Fundamental Research Funds for the Central Universities (2042016kf0038) and the Chinese Postdoctoral Science Foundation Funded Project (2016M602342). The authors would also like to thank the two anonymous reviewers for their constructive and helpful comments and suggestions.
Author contributions
Q. Ji and X. Pang conceived of the idea and designed the experiments. X. Gao collected the experimental data and analysed the results under the supervision of X. Pang. All of the authors contributed to the discussion and writing of the manuscript.
Details of data deposit
The data used in this paper can be downloaded from the following websites: www.scp.byu.edu/data/SigBrw/SigBrw.html (QuikSCAT scatterometer data), www.scp.byu.edu/data/Ascat/SIR/Ascat_sir.html (ASCAT scatterometer data), www.scp.byu.edu/data/OSCAT/SIR/OSCAT_sir.html (OSCAT scatterometer data), http://nsidc.org/data/AE_SI12/versions/3 (AMSR-E passive microwave radiometer data), https://gportal.jaxa.jp/gpr (AMSR2 passive microwave radiometer data), http://aspect.antarctica.gov.au/data (ASPeCt data) and https://doi.pangaea.de/10.1594/PANGAEA.819540 (ship-based sea ice observations from PANGAEA).