Implications
This study shows that it is possible to establish simple routine methods for measuring the quality of pig fat, as well as using preparation methods and instruments that are safe, user and environmentally friendly and do not require chemical solvents. The results reveal that several parameters for fat quality can be predicted by near-infrared spectroscopy (NIRS) technology, and a continuation of this study documents the use of NIRS predicted values in the estimation of genetic parameters for breeding purposes. The high heritability obtained in the follow-up study clearly shows the power of NIRS and the high prediction ability of the calibrations developed in this study.
Introduction
Information in relation to fat moisture content and fatty acid composition in pig fat is important when evaluating fat quality in view of the technological quality and fatty acid profile with regard to human health. Water (moisture) is expected to yield several peaks in the near-infrared (NIR) band width, and the water content can be predicted using NIR spectroscopy (NIRS; Isaksson et al., Reference Isaksson, Miller and Naes1992; Buning-Pfaue, Reference Buning-Pfaue2003; Anderson, Reference Anderson2007). Fatty acid composition is usually analysed with labour-intensive methods such as gas chromatography (GC), which are expensive when large sample sets are to be analysed. For that reason, using methods without any harmful effects on the environment for rapid determination of the composition of pig fat is of great interest. Fat quality predicted by NIRS shows spectral information related to fatty acids (Schwörer et al., Reference Schwörer, Lorenz and Rebsamen1999; Garrido-Varo et al., Reference Garrido-Varo, Perez-Marin, Bautista-Cruz and Guerrero-Ginel2008). For instance, NIRS absorption bands at approximately 1600 to 1800 nm and 2100 to 2200 nm are due to the straight carbon chain and cis double bonds, respectively (Sato et al., Reference Sato, Kawano and Iwamoto1991). NIRS has many advantages, and using NIRS methods and their known performance enables non-professional personnel to conduct routine analyses of large sample series at a relatively low cost. Several studies have reported that NIRS technology permits prediction of the composition of palmitic, C16:0; steric, C18:0; oleic, C18:1n-9 and linoleic, C18:2n-6 acids of subcutaneous fat from the Iberian pig breed (de Pedro et al., Reference de Pedro, Garrido, Bares, Casillas and Murray1992; Garcia-Olmo et al., Reference Garcia-Olmo, Garrido-Varo and de Pedro2001; Fernandez et al., Reference Fernandez, de Pedro, Nunez, Silio, Garcia-Casco and Rodriguez2003). However, Garrido-Varo et al. (Reference Garrido-Varo, García-Olmo and Perez-Marin2004) on a review of the NIRS analysis of fats and oils concluded that although it is possible, from a methodological standpoint, to minimize the sources of variation affecting NIR analysis of fats and oils, there are still some unresolved ‘routine’ issues (Perez-Marin et al., Reference Perez-Marin, Garrido-Varo, de Pedro and Guerrero-Ginel2007). The Iberian breed is very different from Norwegian commercial breeds (Landrace and Duroc). The Norwegian breeds are leaner, more feed efficient and faster growing, and there are also large differences in fatty acid composition. This study was a calibration study using cross-validation (CV) and test set validation in order to investigate the possibilities of NIRS technology in predicting the moisture content and fatty acid composition of subcutaneous fat from fast-growing, lean slaughter pig samples, for its routine use in the prediction of moisture content and fatty acid composition of animal carcasses involved in breeding schemes.
Material and methods
Animals
Fat samples were collected between 2005 and 2007 from Norwegian Landrace and Duroc pigs, which were included in the national breeding scheme. The carcass records made available for these analyses came from half-sib tested females and castrated males from two different test stations. The pigs were fed conventional concentrates ad libitum during the test period (30 to 113 kg live weight), and more detailed information about the test and slaughtering is described by Gjerlaug-Enger et al. (Reference Gjerlaug-Enger, Aass, Ødegård and Vangen2010).
The fat samples
The determination of fat moisture content, fatty acid groups, several fatty acids and iodine value were carried out on samples of subcutaneous fat collected from the area between the loin and ham in the coxal region of the carcasses. The fat samples obtained from these carcasses included the hide/skin, as well as the fat between the hide and the lean and some lean. The samples were randomly chosen from both breeds and both stations from all seasons of the year in order to cover the variation within this population (test station with purebred pigs).
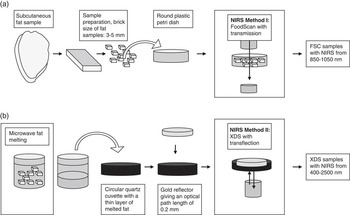
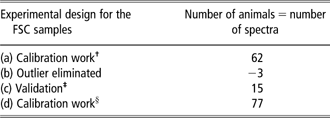
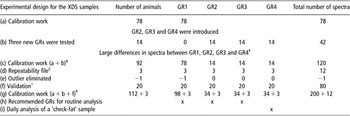
Two NIRS methods, using different instruments and sample preparations, were used in this study. Figure 1a and 1b show the working routine for the two NIRS methods: (i) moisture content in subcutaneous fat and (ii) fatty acids of subcutaneous fat. There was no overlap between the methods, and thus none of the animals (or samples) had both NIRS analyses for fat moisture content and fatty acid composition. All of the samples analysed were from different pigs, although some samples were analysed in duplicate, thereby yielding more than one spectrum per sample. See the experimental design for the two methods used in Table 1a and 1b.
Sample preparation of subcutaneous pig fat for near-infrared spectroscopy (NIRS) prediction of (a) fat moisture content in FoodScan (FSC) samples and (b) fatty acid composition in XDS samples.

The experimental design for the FSC samples
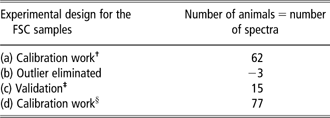
†See Table 3.
‡See Table 5a and Figure 7.
§See Gjerlaug-Enger et al. (Reference Gjerlaug-Enger, Aass, Ødegård, Kongsro and Vangen2011).
a: Best calibration, models with inverse multiplicative scatter correction (MSC) and mathematical pre-processing: 0,0,1,1.
b: Three outliers were eliminated from the model. A relatively conservative criterion based on a T-value of 3.0 was used.
c: Validation with 15 spectra from FSC samples in test set. The 15 spectra are 15 new pigs in a validation set to test the calibration (validation presented in Table 5a).
d: Last calibration set (sum of the calibrations and validation set) with inverse MSC and mathematical pre-processing: 0,0,1,1. This calibration is not presented in this study, but the result was similar, with only a slight improvement. This model is used for the prediction of fatty acids for 5278 pigs in a subsequent study by Gjerlaug-Enger et al. (Reference Gjerlaug-Enger, Aass, Ødegård, Kongsro and Vangen2011).
The experimental design for the XDS samples with an overview of the samples analysed with the different GRs

GRs = gold reflectors.
†See Figures 4 and 5.
‡See Table 3.
§See Figure 4.
∥See Table 5b and Figure 8a and 8b.
¶See Gjerlaug-Enger et al. (Reference Gjerlaug-Enger, Aass, Ødegård, Kongsro and Vangen2011).
a: First calibration work with only GR1 (not presented), analysed in the period from 10 to 27 July 2006.
b: Calibrations with GR1 were tested on 14 new samples analysed with three new GRs (these calibrations are not presented). Large global H values reveal large differences between GRs, ranging from 5.6 to 35.7 for the three new GRs in models with standard multiplicative scatter correction (MSC) and mathematical pre-processing: 2,4,4,1 (Figure 5). Analysed in the period from 22 January to 5 February 2007.
c: Best calibrations were calculated (presented in Table 3), and a repeatability file was used in this calibration work. The best models for all fatty acids were standard MSC and mathematical pre-processing: 2,4,4,1.
d: The repeatability file contains three samples analysed with all four GRs (shown in Figure 4), yielding a total of 12 spectra. Analysed in the period from 22 January to 5 February 2007.
e: One outlier from GR1 was eliminated for all models (Table 3); this sample had T-values >5 for four fatty acids. No further limit based on T-values was used.
f: Validation with 80 spectra in the test set (Table 5b). The 80 spectra are 20 new XDS samples analysed with four GRs on 4 May 2007.
g: The last calibration set (sum of the calibrations and validation set) with standard MSC and mathematical pre-processing: 2,4,4,1. These calibrations are not presented in this study, but the results were similar, with only a slight improvement. The models are used for the prediction of fatty acids for 5006 pigs in a subsequent study by Gjerlaug-Enger et al. (Reference Gjerlaug-Enger, Aass, Ødegård, Kongsro and Vangen2011).
h: After successful implementation of the repeatability file, all GRs are usable for routine analysis.
i: For routine calibrations, a ‘check-fat’ sample is recommended for daily analysis; GR4 was used for that purpose.
NIRS method I: moisture content in subcutaneous fat
Sample preparation
Seventy-seven samples FoodScan (FSC, Figure 1a and Table 1a) were prepared for NIRS analysis. The sample containing all the fat layers was cut into small pieces (brick size: 3 to 5 mm), with no further homogenisation performed. Approximately 12 g of this tissue was placed in a 50-mm round plastic Petri dish and the dish was placed in the NIR instrument. The sample preparation took approximately 1 min.
The NIRS analysis
Transmission spectra from the FoodScan NIR spectrophotometer (FOSS NIRSystems, Hillerød, Denmark) were used to develop calibrations for the prediction of the fat moisture content in the FSC samples. This instrument uses NIRS transmission with a moving grating monochromator, scanning the region from 850 to 1050 nm with data collection every 2 nm, taking a total of 16 scans in 1 min from each sample tested and recorded as the logarithm of the inverse of the reflectance (log(1/R)).
Reference values
The moisture content (%) was measured by drying 6 g tissue samples mixed with sand at 105°C until a constant weight was obtained (Anonymous, 1974).
NIRS method II: fatty acids of subcutaneous fat
Sample preparation
A microwave fat melting technique (de Pedro et al., Reference de Pedro, Casillas and Miranda1997) was used to prepare the samples to obtain the total lipid content from 112 subcutaneous fat samples (XDS; Figure 1b and Table 1b). The samples were cut into pieces in the same way as the analysis of the fat moisture content, although none of the samples were analysed for both fat moisture and fatty acids. In the microwave fat melting technique, 6 to 8 g of fat was placed in a glass vial, which was then placed in a microwave oven with a rotating turntable to ensure a homogeneous sample heating. To obtain melted fat, the oven was set at 160 W for 4 min, simultaneously placing four vials of the sample inside it. The resulting samples were added to 1.5 ml Eppendorf conical polypropylene tubes (TAMRO Medlab AS, Lørenskog, Norway), using snap caps with a pipette. These were then centrifuged for 1 min in an Eppendorf centrifuge, and the moisture in the bottom of the tubes was removed using a 200-μl pipette. The extracted fat samples were stored in Eppendorf tubes under refrigeration at −20°C. Two parallel tubes were made from each melted fat sample, with one used for the reference values of fatty acid composition in the fat and the other for an NIRS analysis. Approximately three were taken for sample preparation on each sample.
Reference values
Laboratory values for the fatty acid composition were determined by GC.
Principal component analysis (PCA) of fatty acid composition
Fatty acid profiles from the reference data were examined by PCA using the Unscrambler version 8.0 (Camo ASA, Olso, Norway). The principal components (PCs) are uncorrelated (orthogonal) and express much of the total variability in the data set through comparison of only a few PCs. In this study, a score plot shows how the different samples relate to each other with respect to the PCs, and the correlation-loading plot depicts the identification of the various fatty acids. The fat moisture was not included in the PCA because none of the animals had both their fat moisture content and fatty acid composition analysed.
The NIRS analysis
Transflectance spectra (n = 200 spectra, some of the 112 samples were analysed with different gold reflectors (GRs), yielding a total of 200 spectra; for details see Table 1b) of the total lipids from the subcutaneous fat samples were obtained using an XDS NIR rapid content analyser (FOSS NIRSystems). Spectra were collected in the visible and NIR range from 400 to 2500 nm, with data collection every 2 nm. Each sample was scanned once using a circular quartz cuvette and a gold-plated reflector that provides optical path lengths of 0.2 mm. This combination of transmission and reflection is known as transflectance, which can greatly enhance the sensitivity of thin samples. In all, 30 μl of the fat, thermostated at 45°C, was added to the cuvettes with a pipette, and the GR was placed without any air bubbles in the thin measurement layer. The GRs and cuvettes were washed in warm water with an ordinary household detergent and dried with paper tissue. Afterwards, they were heated at 45°C, together with the fat samples. Approximately 10 cuvettes were used, leaving some clean, warm cuvettes in the incubator at all times. The spectrum of each sample was an average of 25 sub-scans and was recorded as the log(1/R). The NIRS scanning process took 1 min, and the total amount of time used for each sample was 2 to 3 min for the NIRS analysis.
Repeatability file algorithm for minimising the effects of different GRs
For efficient routine laboratory work, it was important that more than one GR could be used for routine analyses. Different spectra shapes with different GRs made it necessary to include a repeatability file with different GRs in the models. A repeatability file serves to minimise the influence of such unwanted effects on the results of NIRS calibrations (Tillmann and Paul, Reference Tillmann and Paul1998) and that is specially important when working with liquid fat samples (Perez-Marin et al., Reference Perez-Marin, Garrido-Varo, de Pedro and Guerrero-Ginel2007; Perez-Marin et al., Reference Perez-Marin, Sanz, Guerrero-Ginel and Garrido-Varo2009). The repeatability file in this study contains only spectra of three samples measured repeatedly with four different GRs. The variation in the spectra of any of the respective single samples is related to the different GRs used. The four GRs were rotated to reduce the confounding factor of GRs and temperature in the repeatability file. During the development of calibration, this repeatability file was added to the calculations. The goal of the repeatability file is to make the calibrations insensitive to the change in GRs, without reducing the accuracy of the calibration.
Spectra pre-processing for both NIRS methods
WinISI software (version 1.61, FOSS NIRSystems/Tecator Infrasoft International, LLC, Silver Spring, MD, USA) was used for the spectra collection and chemometric analysis of NIRS data. For the FSC samples (method I), the entire wavelength range from 850 to 1050 nm was used. The XDS samples (method II) were scanned in the Vis and NIR regions (400 to 2500 nm), whereas the best calibration models were found when the wavelength range was limited to the NIR region (1100 to 2500 nm).
The scatter correction
Scatter is a non-linear function that can distort the relationship between the NIR spectrum and the reference value. Only inverse multiplicative scatter correction (MSC) or no scatter correction was tested for the FSC samples, as recommended by the WinISI III Manual (2005).
For the XDS samples, five scatter corrections were tested to improve calibration accuracy: standard normal variate (SNV), detrend (DT), SNV and DT combined, standard MSC and weighted MSC (WinISI III Manual, 2005). SNV scales each spectrum to have an s.d. of 1.0. DT removes the linear and quadratic curvature of each spectrum. The standard MSC is the normal MSC using the mean of the file. The weighted MSC corrects for the mean and standard deviation at each wavelength.
The mathematical pre-processing
The FSC samples were tested with 0,0,1,1 and 1,1,1,1, in which the first digit is the number of the derivative, the second is the gap over which the derivative is calculated, the third is the number of data points in a running average or smoothing and the fourth is the second smoothing (Shenk and Westerhaus, Reference Shenk and Westerhaus1995). In the study conducted to optimise the calibration accuracy, several other combinations of mathematical treatments were tested. For the XDS samples, several more complex pre-treatments with derivatives were tested: 1,4,4,1; 2,4,4,1; 2,8,4,1; 2,8,6,1; 3,10,10,1 and 4,10,10,1, according to the instructions in the WinISI III manual (2005).
Extended calibration set on the basis of the global H (GH) levels
In seeking to create a robust calibration, the data set used in the calibration was extended to better predict future samples with similar spectrum. The Mahalanobis distance (H statistic) was calculated from the PCA scores of the spectra (X data). This H value indicates how different a sample spectrum is from a mean sample set. Some samples with high GH values (>3) were sent to a laboratory in order to obtain reference data, and the samples were then added to the calibration set to make the calibration a better fit with the population (WinISI III manual, 2005). We ended up with the number of samples that are outlined in the experimental design in Table 1a and 1b,.
Multivariate calibration with CV for both NIRS methods
In the calibration sets, each sample consists of both reference values (Y) and NIRS spectra (X). The FSC spectra were related to fat moisture content, and the XDS spectra were connected to the fatty acid profiles. The regression methods were performed by partial least squares (PLS) and modified PLS (MPLS) to develop the best calibration equations (Martens and Naes, Reference Martens and Naes1989) for FSC and XDS, respectively. The MPLS method is similar to PLS regression, which uses both the X and Y values to form the factors useful to make the fitting. In MPLS, the residuals at each wavelength, obtained after each factor is calculated, are standardised before calculating the next factor (Garrido-Varo et al., Reference Garrido-Varo, Perez-Marin, Bautista-Cruz and Guerrero-Ginel2008).
The cross-validation
A k-fold CV was performed on the calibration set, which was divided into six and five groups (k = 6 or k = 5) for the FSC and XDS samples, respectively. This was the default number from the WinISI software and is dependent on the amount of samples in the calibration. A smaller data set needs a larger k. Each group is validated using a calibration developed from the other samples, with the validation errors then combined in a root mean square of CV (RMSECV). This procedure was performed until all the samples were used for both model development and prediction.
The optimal number of PLS factors
The number of PCs in the PLS/MPLS models (PLS factors) yielding a significant change in RMSECV, and not the lowest RMSECV, determined the optimal number of PLS factors to be used for the calibration. With this procedure, an overfitting due to too many PLS factors, thereby reducing the validation performance, was avoided (Esbensen, Reference Esbensen2000). The accuracy of the calibration models was assessed on the basis of RMSECV and R 2cv.
Validation test
A validation with new pigs was carried out to check the performance of the models. The validation test of the FSC samples followed the recommendations of Esbensen (Reference Esbensen2000), and the prediction accuracy was evaluated by a validation test set of 15 FSC samples (Table 1a). A more complex validation test was performed for the XDS samples. In terms of the XDS samples, the aim of this validation was to check the prediction ability and robustness of the models in handling various GRs. The validation test set consisted of 20 × 4 XDS samples (Table 1b). The same cuvettes were used for all four GRs on each fat sample. Owing to the time needed to run all GRs, the use of GRs was rotated, thus eliminating the systematic effect between GRs and temperature.
The statistics used for this evaluation were: the R 2 of the reference data with the predicted data in the test set (R 2val). The slope of the regression line related the NIRS predicted values to the reference values. The bias calculated as the simple difference between the average of the reference values and the predicted values: the root mean square error of prediction (RMSEP), calculated by taking the square root of the average squared prediction error. The standard error of prediction (SEP) expresses the accuracy of NIR results corrected for the bias. The RMSEP value includes the SEP and bias, and the relationship between them is given by RMSEP2 ≈ SEP2 + bias2, and thus when the bias is small the RMSEP tends towards the SEP (Esbensen, Reference Esbensen2000).
Repeatability and reproducibility of predicted data
The model repeatability and reproducibility were tested on different test sets. In both cases, calculations were made by taking the covariance between the repeated samples over the variance of all samples. For the FSC samples, analysing the same samples in rapid succession, with two analyses of each sample, tested the instrument's repeatability. The repeatability is the ability of an instrument to yield consistent measurement readings on multiple runs of the same sample.
For the XDS samples, a reproducibility model was preformed to investigate the accuracy of the models with the different GRs, and the data set was the same as for the validation test set. The reproducibility is the ability of the same instrument to yield consistent measurement readings regardless of who performs the measurements, for measurements analysed with different instruments, or in this case the repeated analysis with different GRs. Therefore, the evaluation of the XDS instrument's reproducibility requires a measurement of the same XDS sample by different GRs under the same conditions. The reproducibility (reprod) was calculated between each combination of GR 1 to 4 (reprod1–2, reprod1–3, reprod1–4, reprod2–3, reprod2–4 and reprod3–4) and for each fatty acid, fatty acid group and iodine number.
Results
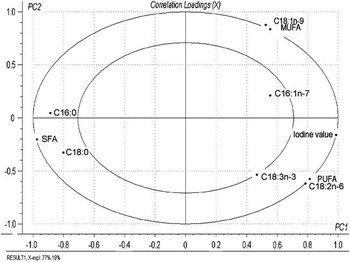
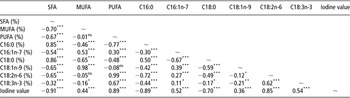
The PCA analysis of fatty acids, fatty acids groups and iodine value showed a high degree of correlation between the variables, and 96% of the variation could be explained with two PCs only. The correlation loadings (Figure 2) give the correlations between each fatty acid and the selected PCs, with concentric circles of radii corresponding to 50% and 100% of the explained variance. The squared distance between the point of a fatty acid and its origin equals the fraction of the variance of the total variable explained by the two PCs in the plot. The correlation-loading plot for the 10 fatty acid variables reveals high loadings of the iodine value and saturated fatty acids (SFA) in PC1 located along the horizontal axis with negative correlations to each other, while the vertical axis (PC2) in the plot represents more of the monounsaturated fatty acids (MUFA) and polyunsaturated fatty acids (PUFA) groups with negative correlations to each other. In addition, this plot shows the high influence of C18:1n-9 to the MUFA, as well as C18:2n-6 being the main fatty acid for the PUFA. The Pearson correlation coefficients between the same parameters for the same samples (Table 2) reveal the same picture as the correlation loadings, with correlations close to 1 between C18:1n-9 and MUFA, and between C18:2n-6 and PUFA for the subcutaneous fat in these pigs. The correlation loadings are standardised, and this plot shows that a relatively high degree of the variation of the minor fatty acids, such as C18:3n-3 and C16:1n-7, is explained by these two PCs.
Correlation loading plot of PC1 and PC2 for main fatty acids in subcutaneous fat (PC = principal component).

Pearson correlation coefficients for samples with reference values from GC in the calibration set

GC = gas chromatography; SFA = saturated fatty acids; MUFA = monounsaturated fatty acids; PUFA = polyunsaturated fatty acids; PC = principal component; ns = non-significant (P > 0.05).
Same data set is used for the correlation-loading plot of PC1 and PC2 in Figure 2.
*P < 0.05, **P < 0.01, *** = P < 0.001.
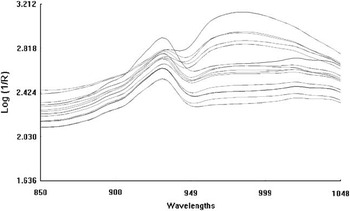
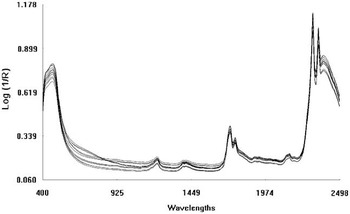
For the FSC samples used in the prediction of fat moisture content, there was only one broad absorption band in the corrected spectra at the wavelength area of 930 nm, as shown in Figure 3. The shapes of the XDS samples used for the prediction of fatty acids show different peaks for wavelengths in the region of 1208 to 1210, 1390 to 1394, 1414 to 1416, 1720 to 1726, 1758 to 1762, 1758 to 1762, 1900, 1926 to 1928, 2142 to 2146, 2306 to 2310, 2348 and 2384 nm, as shown in Figure 4.
Near-infrared (NIR) spectrum from FoodScan NIR spectrophotometer (FOSS). The figure shows the test set for repeatability, and the two replicates are so similar that it is hard to see that each line is two different spectra. Repeatability for this analysis was 0.99, and these FSC samples are used for the prediction of fat moisture composition.

Near-infrared (NIR) spectrum from XDS NIR rapid content analyser (FOSS). The 12 samples comprise the repeatability file used in calibration. The various shapes show the differences between the four different gold reflectors. The XDS analysis was used for the prediction of fatty acid composition in the XDS samples.

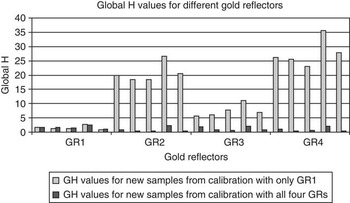
The NIR spectra from the XDS samples (Figure 4) come from the validation set with 20 samples analysed using four different GRs, and the various shapes exhibit large differences between the GRs, which is also shown in Figure 5 with the differences in GH values. The average GH value of spectra from GR2, GR3 and GR4 was 18.6 before these GRs were implemented in the calibration, and the average GH value was 1.0 for the same spectra in the final calibration.
Global H (GH) values for XDS samples before and after, including all gold reflectors (GRs) in the calibration (Table 1b). The first data series (light grey dot/axes) shows the GH values for new samples analysed with all four GRs with an equation containing only samples from GR1, whereas the other data series (dark grey dots/axes) shows GH values for new samples analysed with a model that contains all four GRs.

The inverse MSC method was the best scatter correction of the FSC samples, whereas the standard MSC method was the best scatter correction of the XDS samples (Isaksson and Naes, Reference Isaksson and Naes1988). The best mathematical pre-processing were 0,0,1,1 and 2,4,4,1 treatments for FSC and XDS samples, respectively. The MPLS equation was slightly better than the PLS equation for the XDS models, whereas the PLS equation was recommended for the FSC samples (J. Jøns, personal communication).
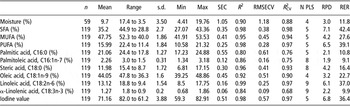
The statistics of the regression and CV results for the NIRS prediction of fat moisture content, fatty acid groups, several fatty acids and iodine value in subcutaneous fat are presented in Table 3. The R 2 of the reference data compared with the equation-predicted data varied from 0.99 for C18:2n-6 to 0.80 for C16:0, and the R 2 from CV varied from 0.98 to 0.68 for SFA and C18:3n-3, with the fat moisture content of R 2 being between the latter two R 2. The SEP for the calibration (SEC) and for CV (RMSECV) were 1.05% and 1.18% for fat moisture content, respectively, and varied from 0.06% and 0.09% for C18:3n-3 to 0.55% and 0.61% for C16:0. The relationship between the standard deviation of the reference data and the standard error of CV (RPD) ranged from 7.1 to 1.9 for SFA and C16:1n-7, respectively, whereas the relationship between the range of the reference data and the standard error of CV (RER) were 42.4 and 9.1 for the same two fat parameters.
Calibration statistics for the NIRS equations and cross-validation for moisture content and main fatty acids in subcutaneous fat

N = the number of samples used for regression development; Mean = the average of the reference data; Range = the range of reference data; s.d. = the standard deviation of reference data; Min = the minimum value of predicted data; Max = the maximum value of predicted data; SEC = the standard error of the calibration (the average difference between reference values and the equation predicted values in the calibration data set); R 2 = the R 2 of the data with the predicted data; RMSECV = the root mean squared error of cross-validation, which is calculated by taking the square root of the average squared prediction error; R 2CV = the R 2 of the data with the cross-validation results; N PLS = the number of principal components in the partial least square/modified partial least square models; RPD = the relationship between the standard deviation of the reference data and the standard error of cross-validation; RER = the relationship between the range of the reference data and the standard error of cross-validation; SFA = saturated fatty acids; MUFA = monounsaturated fatty acids; PUFA = polyunsaturated fatty acids; NRS = near-infrared spectroscopy.
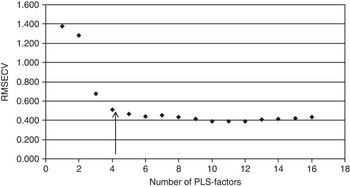
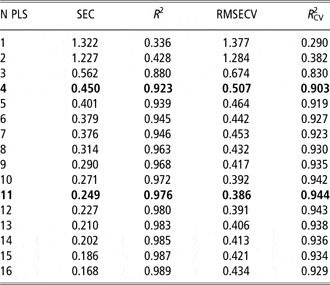
The number of PLS factors used for several of the fat parameters was approximately half the number of PLS factors giving the minimum RMSECV, as an increased number of PLS factors resulted in little improvement in the RMSECV and R 2cv (Figure 6 and Table 4). Nevertheless, a relatively high number of PLS factors were needed to make the distinction between the C18:2n-6 and C18:3n-3 fatty acids (Figure 2 and Table 2). With five PLS factors, the correlation between C18:2n-6 and C18:3n-3 was 0.89, whereas with nine PLS factors the correlation was 0.74, which was similar to the correlations between C18:2n-6 and C18:3n-3 for the reference values in the calibration set. These correlations were from an extended data set not included in this calibration set (Gjerlaug-Enger et al., Reference Gjerlaug-Enger, Aass, Ødegård, Kongsro and Vangen2011).
Standard error of cross-validation (RMSECV) as a function of the number of partial least squares (PLS) factors from the calibration model for C18:1n-9 on the basis of a standard multiplicative scatter correction method and a mathematical pre-processing of: 2,4,4,1. The arrow indicates the number of PLS factors used in the final calibration results presented in Table 4.

Regression results of NIRS equations for C18:1n-9 from subcutaneous fat

NIRS = near-infrared spectroscopy; N PLS = the number of principal components in the partial least square/modified partial least square models; SEC = the standard error of the calibration (the average difference between reference values and the equation predicted values in the calibration data set); R 2 = the R 2 of the data with the predicted data; RMSECV = the root mean squared error of cross-validation, which is calculated by taking the square root of the average squared prediction error; R 2CV = the R 2 of the data with the cross-validation results.
The number of principal components (N PLS) and RMSECV are plotted in Figure 6.
Bold values shows the N PLS used in NIRS equation: N PLS = 4 and the lowest RMSECV : N PLS = 11.
For the FSC samples used to predict fat moisture content, three outliers were eliminated. A relatively conservative criterion based on a T-value (residual/RMSECV) of 3.0 was used for the FSC samples. No outlier elimination passes were conducted for the XDS samples, although one sample was removed for all fatty acids parameters. This sample had a T-value >5 for several of the fatty acids, as well as some strange reference values for fatty acids composition, which indicated that something was wrong with the GC analysis. T outliers are characterised by a large difference between reference and predicted values, and a T >2.5 is often used for the removal of outliers (Shenk and Westerhaus, Reference Shenk and Westerhaus1995). In our calibrations, a few samples had T-values between 2.5 and 5, but they were not removed.
GH outliers are samples whose spectra differ notably from the mean sample spectrum, with a GH > 3 often being used for the removal of outliers (Shenk and Westerhaus, Reference Shenk and Westerhaus1995; WinISI III Manual 2005). The maximum GH values for the FSC and XDS samples were 5.10 and 6.44, respectively, and it was generally small problems with the variation of the spectra used in the final models.
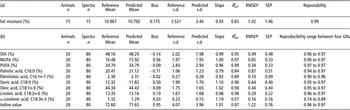
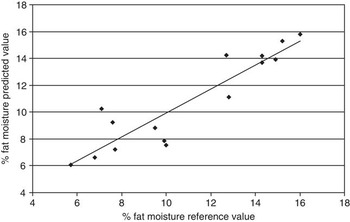
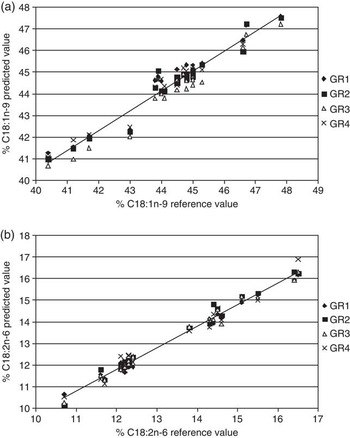
Validation results for fat moisture (Table 5a) and fatty acids (Table 5b) show the NIRS's prediction ability for new samples. Figures 7, 8a and 8b, show the NIRS values v. reference values for the fat moisture content, C18:1n-9 and C18:2n-6, respectively, from validation. No large outliers were detected, and the plots show good prediction ability for the calibrations. The three selected fat parameters are presented here because of the importance of these characteristics in determining porcine fat quality and human nutrition.
Validation results for (a) fat moisture and (b) fatty acids

Bias = the simple difference between the average of the reference values and the predicted values in the test set; Slope = the slope of the regression line relating the NIRS predicted values to the reference values should be close to 1; R 2val = the R 2 of the reference data with the predicted data in the test validation set; RMSEP = the root mean square error of prediction, which is calculated by taking the square root of the average squared prediction error; SEP = the standard error of prediction, which expresses the accuracy of NIR results corrected for the bias; Repeatability = the covariance between the repeated samples over the variance of all samples; Reproducibility = the covariance between the repeated samples analysed with different GRs over the variance of all samples; SFA = saturated fatty acids; MUFA = monounsaturated fatty acids; PUFA = polyunsaturated fatty acids; GRs = gold reflectors.
Near-infrared spectroscopy predicted values v. reference values for fat moisture content from the validation of 15 samples.

Near-infrared spectroscopy predicted values v. reference values for C18:1n-9 (a) and C18:2n-6 (b) from validation of 20 samples measured with four different gold reflectors (GRs).

The repeatability of predicted fat moisture (Table 5a) was 0.99 for the FSC samples analysed in replicate, and the reproducibility for fatty acid groups, fatty acids and iodine value (Table 5b) analysed with various GRs ranged from 0.95 to 0.97 for SFA, MUFA, PUFA, C18:0, C18:1n-9, C18:2n-6 and iodine value, whereas C16:0, C16:1n-7 ranged from 0.90 to 0.97 and C18:3n-3 ranged from 0.74 to 0.89.
Discussion
The two NIRS methods used in this study are different from each other with regard to wavelength range and scanning method, that is, transmission v. transflection. The different wavelength ranges are chosen because of the expectations of different absorption features for the subcutaneous fat components of moisture and fatty acids composition. It is well known, and previous experiment has shown (Gjerlaug-Enger et al., Reference Gjerlaug-Enger, Aass, Ødegård and Vangen2010), that homogenisation improves the accuracy with NIRS technology. The best results with the XDS instrument can be achieved with transflection through a thin homogeneous layer, although other methods (i.e. fibre optics) are also available on the market. An analysis using fibre optics and a probe requires simple sample preparation. For example, a reflectance probe placed directly on the raw material could also yield fat moisture with the XDS instrument. Several absorption bands of OH groups in water are in the range of the XDS instrument. Rossel and McBratney (Reference Rossel and McBratney1998) found strong absorption bands of OH groups in soil water at approximately 1450, 1950 and 2500 nm. Unfortunately, a probe analysis would go only a few millimetres into the tissue, thus making it much more sensitive to the nature of a food sample. The advantage with the FoodScan is the multi-point scan through the entire fat layer. This instrument is specially developed to predict fat, moisture and protein in meat (Anderson, Reference Anderson2007); for that reason, it was expected to be suitable for the prediction of moisture in fat samples as well.
The use of the NIRS methods (I and II) in this study required different sample preparations. The preparation of the XDS samples with the melting technique was necessary to acquire the thin fat layer (thickness: 0.2 mm) needed for the transflection method used for the detection of fatty acids. As a consequence of this, the preparation of the XDS samples with the melting technique yielded a separation of moisture and fat, although the fat moisture content could not be predicted from this method. In contrast, the FSC samples were intact raw samples with regard to their subcutaneous fat composition. The low NIR wavelengths (850 to 1050 nm) can penetrate through the fat pieces (thickness: 8 mm), whereas the wavelengths with smaller waves (1100 to 2500 nm) in the XDS instrument is not able to penetrate this thickness.
Fat is difficult to homogenise with a mixer as the composition changes. In addition, tissue components sticking to the equipment creates errors. The preparation of the FSC samples for the fat moisture analysis in method I (Figure 1a) was therefore simple: the fat pieces were intact and had a low degree of homogeneity. With this method, different levels of fat in the Petri dishes may create errors if these factors are not controlled for. The result may be a spectral outlier for the fat moisture analysis in the FoodScan instrument. No studies using a similar method were found in the literature. Method II required homogeneous fat to optimise accuracy, and our study used a microwave melting method to obtain the total lipids. Studies comparing fat extraction with solvents and microwave melting revealed similar results for fatty acids with both methods, although the melting method is much simpler to perform, requires less time and avoids the use of solvents that are difficult to manage and handle (Garcia-Olmo et al., Reference Garcia-Olmo, de Pedro, Garrido, Paredes, Sanabria, Santolalla, Salas, Garcia-Hierro, Gonzalez, Garcia-Cachan and Guirao2002; Gonzalez-Martin et al., Reference Gonzalez-Martin, Gonzalez-Perez, Hernandez-Mendez, Alvarez-Garcia and Lazaro2002).
The amount of time used for the XDS analysis was reduced by 50% when two GRs were used for a routine analysis. It was possible for one person to run 26 NIRS analyses in 1 h; this was the maximum found under normal working conditions when we checked the time recorded for the analyses. Hence, a calibration that was robust for several GRs was performed. This was a challenging task, and our study shows a large sensitivity towards the use of different GRs (Figures 4 and 5). The surface of the GRs probably exerted an influence on the spectra for the transflection method used for the XDS samples. To the best of our knowledge, the problem with the GRs was not documented in the literature and was therefore quite surprising. The experimental design for the XDS samples is complicated because of the change in GRs used during the study (Table 1b). The first GR (GR1) we started to use was the one that had the largest degree of difference from the other GRs. In Figure 5, we can see some examples of GH values (first data series, average GH values of 18.6) for new samples analysed with a calibration (standard MSC and mathematical pre-processing: 2,4,4,1) consisting only of GR1. The repeatability file used in the final calibration increased the value of the first 78 samples analysed with GR1, but a repeatability file does not exert a direct influence on the GH values for new samples. The acceptable level of the GH values (second data series, average GH values of 1.0) for GR2, GR3 and GR4 in Figure 5 was an effect of the 14 samples analysed with GR2, GR3 and GR4 (point b, Table 1b) that were included in the calibration. With regard to the validation test, the repeatability file had a larger effect than these 14 × 3 samples in the prediction ability of calibration (not presented in any tables). This experiment was a success for this type of calibration study, which aimed to make robust calibrations that were suitable for all GRs. The successful use of the repeatability file algorithm in NIRS calibrations to correct for various error sources, for example, NIR instrument differences, transfer purposes, residual moisture and temperature variation in other studies and day-to-day variation in their own study, is thoroughly described by Perez-Marin et al. (Reference Perez-Marin, Garrido-Varo, de Pedro and Guerrero-Ginel2007).
The monitoring of a ‘check-fat’ sample is recommended for method II in order to ensure a reliable application of the equations, and GR4 was used for this purpose for routine analysis (Table 1b). In general, for both this ‘check-fat’ sample and other fat samples analysed with the XDS instrument, we see a change in the spectra with increased GH values over time. We also saw a tendency for the GH values to drift. When carrying out our study, this problem disappeared when we cut out the spectral range from 400 to 1100 nm. In a follow-up study using these calibrations on 5006 new samples, there were no major problems with high GH values or prediction ability (Gjerlaug-Enger et al., Reference Gjerlaug-Enger, Aass, Ødegård, Kongsro and Vangen2011). Perez-Marin et al. (Reference Perez-Marin, Garrido-Varo, de Pedro and Guerrero-Ginel2007) have reported similar problems. NIR calibrations on fats and oils can have a high precision. However, despite the high degree of accuracy afforded by the equations obtained, considerable deviations from expected values were detected when these equations were applied to new samples (Perez-Marin et al., Reference Perez-Marin, Garrido-Varo, de Pedro and Guerrero-Ginel2007). This particularly occurred when spectra were recorded at a later period than those from the calibration samples, which may prove to be a challenge when using NIRS for the routine analysis of fats (Perez-Marin et al., Reference Perez-Marin, Garrido-Varo, de Pedro and Guerrero-Ginel2007). Our calibration for the melted fat has been performed with samples collected over a long period of time and the validation set was done on samples taken 3 to 9 months after the calibration samples were analysed (Table 1b). Taken together, the long sampling time, the GC analysis of new samples with high GH values (GH outliers) and the use of the repeatability file could be the reason why the calibrations were relatively robust in the prediction of new samples.
The correlation of the loading plots from PCA analysis exhibited a high degree of correlation between the fatty acids. This relationship is a result of some of the fatty acids being converted to other fatty acids and in vivo uptake mechanisms. It is important to be aware of the nature of the reference data (Y) when analysing the parameters with NIRS. A large absorption of wavelengths for molecules in large quantities makes NIRS the method best suited for the prediction of fatty acids with a large content. Consequently, the correlations between the fatty acids make this method less robust for predictions with respect to a low composition of fatty acids, thus causing fatty acids with <1% to be left out of this study.
The NIR spectra of subcutaneous fat (FSC samples) for the calibration of fat moisture content (method I) are shown in Figure 3. Similar studies are not found in the literature, but moisture is expected to yield an absorption line at 930 nm (Duarte, Reference Duarte1995). This is in agreement with our results, which also find the highest absorbance values, with a large variation in the area around 930 nm. In FSC spectra with one fat (CH) and one moisture (OH) absorption band, this information is already the largest spectral variation. A model with no derivation (inverse MSC and 0,0,1,1) gave the best calibration. A complicated scatter correction and mathematical pre-processing may amplify noise rather than reinforce the signal for the NIRS method I. The biggest variation between the spectra from the FSC samples in Figure 3 was caused by different samples, although the largest diversity of XDS samples in Figure 4 was due to the four GRs.
The spectra from the XDS samples with sharp, well-defined peaks (Figure 4) are similar to the spectra in the review by Garrido-Varo et al. (Reference Garrido-Varo, García-Olmo and Perez-Marin2004), which also shows the transflectance spectra of fat and oils with absorptions from 1100 to 2500 nm. The various peaks are associated with cis double bounds, CH bond vibration and a number of bonds giving the chain lengths. The mathematical pre-processing with second-derivative spectra used in our study is also commonly used in other studies, and the advantage was a better discrimination between peaks that overlap in the original spectra. The mathematical pre-processing (standard MSC and 2,4,4,2) highlights the spectral information that distinguishes the different fatty acids in the NIRS method II.
A relatively low number of PLS factors in the PLS/MPLS models were used to make a more robust and global calibration, thereby avoiding an overfitting owing to too many factors. This strategy worked well for large fatty acids groups (SFA, MUFA and PUFA), for C18:1n-9, for iodine value and for fat moisture content, although the other fatty acids required an increased number of PLS factors. Some evidence for this was the unfavourable increase in correlation between C18:2n-6 and C18:3n-3, with too low numbers for PLS factors. The acids C18:2n-6 and C18:3n-3 were similar in chemical structure and also showed a high correlation in the fat from pigs (Figure 2 and Table 2), although a too low number of PLS factors did not make a distinction between the fatty acids. Nevertheless, the number of PLS factors in the calibrations (Table 3) was below the number of PLS factors, yielding the lowest RMSECV. On average, the R 2val was two percentage points higher for the minimum RMSECV. In Figure 6, the minimum RMSECV for C18:1n-9 was at 11 PLS factors (four PLS factors were used), and more PLS factors increased the RMSECV again because of overfitting.
There are repeated measurements with different GRs for 14 samples (14 animals) in the calibration (Table 1b). The variation between GRs was greater than the variation between the XDS samples for the raw spectra (Figure 4). However, the repeatability file, scatter correction and mathematical pre-processing will reduce these differences, and therefore the CV results are slightly overestimated for R 2val and RMSECV.
The R 2 and R 2cv could similarly be improved if an increased number of outliers were removed, as the largest effect had the removal of outliers on fatty acids with a low content and low variation. Our choice of removing few outliers was made in order to make the calibration more global and the prediction ability better. The outliers can often contain important information if they do not significantly affect the RMSECV. Nevertheless, the removal of outliers may increase the risk of overfitting data to the limited data set, which will not increase the reliability of the prediction.
The calibrations were made for pigs tested in two test stations with almost identical diets. Despite this, a relatively large variation was obtained. It is important that this variation covers the population in which the calibrations will be used for later predictions. A larger variation in fatty acids could be obtained if pigs were picked randomly from different herds, although the calibrations in our work were designed for the prediction of values in terms of breeding value estimations on purebred animals (Landrace and Duroc pigs) tested for carcass and meat quality parameters in a breeding programme. Even so, the variation of fatty acids for pigs in this study were similar to those used to make calibrations for fatty acids in other studies (Fernandez et al., Reference Fernandez, de Pedro, Nunez, Silio, Garcia-Casco and Rodriguez2003; Garcia-Olmo et al., Reference Garcia-Olmo, Garrido-Varo and de Pedro2005; Perez-Marin et al., Reference Perez-Marin, Sanz, Guerrero-Ginel and Garrido-Varo2009). These studies were conducted on Iberian pigs in Spain fed several diets on the basis of extensive feeding programmes that were different from standard Norwegian feeding strategies. The Spanish feed is generally high in C18:1n-9 and low in C18:2n-6 and these pigs, which are used for dry ham production (Fernandez et al., Reference Fernandez, de Pedro, Nunez, Silio, Garcia-Casco and Rodriguez2003), have a lower LMP and higher age than the Norwegian pigs in our study. The SEP and R 2 for the calibration and CV were of the same magnitude in both our study and the Spanish studies (Fernandez et al., Reference Fernandez, de Pedro, Nunez, Silio, Garcia-Casco and Rodriguez2003; Garcia-Olmo et al., Reference Garcia-Olmo, Garrido-Varo and de Pedro2005; Perez-Marin et al., Reference Perez-Marin, Sanz, Guerrero-Ginel and Garrido-Varo2009).
Minimum values of 3 and 10 for RPD and RER, respectively, are recommended by Williams and Sobering (Reference Williams and Sobering1996), and the results of our study showed a limited predictive ability for fatty acids with low concentrations (C16:1n-7 and C18:3n-3) in addition to some problems with C16:0 (Table 3). NIRS has the best predictive ability for organic components with large volumes, and the C16:1n-7 and C18:3n-3 fatty acids are often left out of similar publications (Fernandez et al., Reference Fernandez, de Pedro, Nunez, Silio, Garcia-Casco and Rodriguez2003; Perez-Marin et al., Reference Perez-Marin, Sanz, Guerrero-Ginel and Garrido-Varo2009) or have an R 2 similar to our study for a study that also uses a microwave melting technique (Gonzalez-Martin et al., Reference Gonzalez-Martin, Gonzalez-Perez, Hernandez-Mendez, Alvarez-Garcia and Lazaro2002). Shenk and Westerhaus (Reference Shenk and Westerhaus1996) indicated that NIRS equations with R 2 values >0.9 may have an excellent precision, whereas those with R 2 values between 0.5 and 0.9 have values with good precision, meaning that all of our equations from both NIRS methods have good future potentials.
The test set validation was performed to check the quality of the calibrations for fat moisture and fatty acids on the basis of the FSC and XDS spectra, respectively. Shenk et al. (Reference Shenk, Workman, Westerhaus, Burns and Ciurczak2001) assume the following control limits for this test: the SEP should not exceed 1.30 times the SEC. Our validation of fat moisture, C18:3n-3 and iodine value does not meet this requirement, but the other parameters were above this limit. The predicted values for fat moisture are plotted against the reference values in Figure 7. The SEP values are slightly too large, although the bias and slope are satisfactory, resulting in a reliable R 2val at 0.83. For the fat moisture, we see a larger SEP than RMSEP, which is probably caused by the limited amount of samples and the small SEP in comparison to the size of the bias (Table 5a).
The predicted values for C18:1n-9 and C18:2n-6 are plotted against the reference values in Figure 8a and 8b, respectively, and the validation was good for these two fatty acids. For all fatty acid parameters in general (Table 5b), the bias was too large for MUFA, C16:0, C18:0 and the iodine value, whereas the slope was acceptable for all parameters, except for C16:0 and C18:3n-3. The R 2val was >0.90 for all parameters despite C16:0, C16:1n-7 and C18:3n-3. The RMSEP2 ≈ SEP2 + bias2 works for all equations made for the XDS samples. The prediction ability of the models adjusted for bias (i.e. SEP) shows excellent results for all parameters from method II, except for C18:3n-3 and C16:0.
The repeatability of predicted fat moisture (Table 5a) and the reproducibility for fatty acid parameters (Table 5b) show a small error variance of these NIRS methods. The transmission and transflection, with multiple scans through the sample, make the prediction similar for repeated analyses. For the FSC samples, we see repeatability close to one and a coincidentally high SEP value. This allows for a legitimate question to be asked as to whether the NIRS method is more accurate than the reference method. In a similar study on meat quality, the FoodScan instrument gave a better estimated heritability than the reference method (Büchi Caviezel) in determining the fat percentage of meat (Gjerlaug-Enger et al., Reference Gjerlaug-Enger, Aass, Ødegård and Vangen2010). The heritability is as much of a corresponding parameter as the repeatability; the difference is that a permanent environment is left out of the model, and therefore only a genetic covariance between animals remains.
The reproducibility for the fatty acid parameters (Table 5b) documents the robustness of the models in handling four GRs. With the predicted values for C18:1n-9 and C18:2n-6 in Figure 8a and 8b, we see a repeated analysis with different GRs. The large similarity in predicted values for each sample yielding a good reproducibility was significantly improved when the repeatability file was implemented in the calibration. Problems with the use of multiple GR were not discussed in previous studies, and therefore it was important to emphasise the issue in this study.
The calibrations presented here are intended for the Norwegian breeding programme for pigs, with the aim being to breed a better fat quality. Approximately 2000 animals are tested annually for several meat quality parameters for breeding purposes, and in our opinion the methods presented here are rapid enough to be used for this number of animals. A total of 5278 and 5006 pigs have already been tested with the NIRS methods I and II, respectively, presented here, and they exhibited high accuracy in a study on genetic parameters (Gjerlaug-Enger et al., Reference Gjerlaug-Enger, Aass, Ødegård, Kongsro and Vangen2011).
Conclusions
This study has shown that it is possible to use NIRS technology for the prediction of fat moisture content and several fatty acid composition of large number of samples coming from Norwegian pigs breeding programme.
Acknowledgements
This project was funded by the Foundation for Research Levy on Agricultural Products, the Research Council of Norway and Norsvin (Norwegian Pig Breeders Association). Animalia (the Norwegian Meat and Poultry Research Centre) and Biobank AS are gratefully acknowledged for their goodwill and help with the introduction of novel fat quality equipment and recordings. We thank Jakob Jøns, FOSS, for his help with the NIRS methods and WinSIS software, and to Daniel Schwörer for receiving and showing us Suisag's meat research laboratory.