INTRODUCTION
Chickpea (Cicer arietinum L.) is an important food legume of rainfed farming systems, providing high quality protein for human diets. It is also used as feed for livestock and has a significant role in agricultural systems, contributing to the sustainability of production and reducing the need for N fertilization through fixing atmospheric nitrogen (Singh Reference Singh1997). Several studies conducted in different parts of the world have shown that autumn sowing of chickpea produces a significant increase in seed yield (SY) over that sown in spring or late winter: 60% in Italy (Sarno et al. Reference Sarno, Stringi, Amato, Crivello and Crino1987), 70% in Syria (Singh et al. Reference Singh, Malhotra, Saxema and Bejiga1997), 50–80% in Spain (López-Bellido et al. Reference López-Bellido, López-Bellido, Khalil and López-Bellido2008) and 23–188% in Greece (Iliadis Reference Iliadis2001). However, in cooler Mediterranean areas, such as those of Northern Greece, winter sowing has usually resulted in crop failure, due to freezing temperatures during the winter period (Koutroubas et al. Reference Koutroubas, Papageorgiou and Fotiadis2008). In these areas, frost risk can be avoided by shifting the sowing to the spring.
Nitrogen partitioning in grain legumes is important in determining grain quality, due to its effect on protein content in the plant and the ability of the plant to produce high yield (Douglas & Weaver Reference Douglas and Weaver1986). Considerable amounts of nitrogenous compounds accumulate in the vegetative organs of grain legumes before the seed-filling period. By this time, the N assimilatory processes have progressively decreased and fail to meet the N requirement of the seeds. Therefore, N must be redistributed from the vegetative tissues to the seeds to meet the deficits (Sinclair & DeWit Reference Sinclair and DeWit1975; Evans Reference Evans1982). Redistributed N accounts for a significant proportion of the N in the seed at maturity. In chickpea, Kurdali (Reference Kurdali1996) showed that N remobilization accounted for 0·81 of N in pods at maturity. Davies et al. (Reference Davies, Turner, Palta, Siddique and Plummer2000), using pot experiments, reported that 0·62–0·85 of seed N is derived from vegetative tissues. Soltani et al. (Reference Soltani, Robertson and Manshadi2006b) reported that 0·37–0·72 of leaf N and 0·12–0·56 of stem N was remobilized to the seeds, depending on the growth conditions. The extent of N redistribution is very important, especially in Mediterranean climates, because seed filling of grain legumes takes place in hot and dry weather conditions that restrict N2 fixation and soil N uptake (Sarker & Erskine Reference Sarker and Erskine2006).
Genotypic variation for nitrogen uptake and nitrogen utilization efficiency (NUE) has been reported for many small grain crops (May et al. Reference May, Van Sanford, MacKown and Cornelius1991; Kelly et al. Reference Kelly, Bacon and Wells1995; Le Gouis et al. Reference Le Gouis, Delebarre, Beghin, Heumez and Pluchard1999; Koutroubas & Ntanos Reference Koutroubas and Ntanos2003) and the possibility of improving NUE through plant breeding has been investigated (Van Ginkel et al. Reference Van Ginkel, Ortiz-Monasterio, Trethowan and Hernandez2001; Ju et al. Reference Ju, Yamamoto, Wang, Shan, Dong, Yoshida and Miyazaki2006). Such information is limited for chickpea. The identification of the factors affecting nitrogen utilization of chickpea is important for the successful introduction of the crop to a given cropping system. This information could be exploited by growers for adopting the appropriate cultural practices and also by breeders for choosing the most efficient selection criteria in order to improve nitrogen exploitation.
Most research on chickpea has been conducted at the Experimental Centres of the International Center for Agricultural Research in the Dry Areas (ICARDA) (Oweis et al. Reference Oweis, Hachum and Pala2004). In contrast, little work has been done in other chickpea-producing regions, such as the European countries bordering the Mediterranean (López-Bellido et al. Reference López-Bellido, López-Bellido, Khalil and López-Bellido2008). The purpose of the present study was to compare and analyse the relative importance of factors causing variation in growth, seed yield, nitrogen accumulation and NUE among spring chickpea varieties grown in a Mediterranean climate.
MATERIALS AND METHODS
Site and cropping history
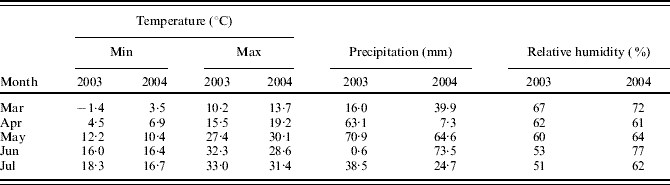
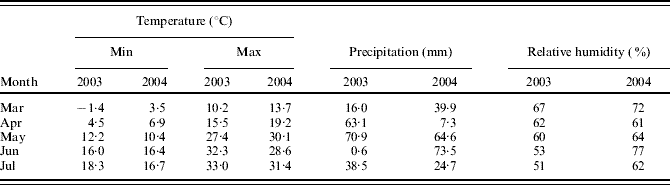
Field experiments were conducted at the farm of Democritus University of Thrace in Orestiada (41°33′N latitude, 26°31′E, 33 m asl), Greece in 2 years (2003 and 2004). The soil is silty clay and its main characteristics are given in Table 1. A different experimental location was used each year, but durum wheat (Triticum turgidum L. subsp. durum (Desf.) Husn.) was always the preceding crop. The weather data for each growing season were collected from a meteorological station of the Hellenic Sugar industry located 1·5 km away from the experimental site (Table 2).
Characteristics of the 0–300 mm soil layer of the experimental site of the Democritus University Farm in Orestiada, Greece

Monthly temperature, precipitation and relative humidity in Orestiada, Greece during the growing season in 2003 and 2004
Treatments, experimental design and crop management
Five chickpea varieties released by the National Agricultural Research Foundation-Fodder Crops and Pasture Institute were used in the experiments: Amorgos, Serifos, Andros, Kassos and Thiva. These varieties were chosen to represent a wide range of genetic variation in agronomic traits and different resistance to diseases. Serifos, Andros and Kassos are small seeded, Amorgos is medium-seeded and Thiva is large-seeded. Andros and Thiva are early flowering, Amorgos is early-middle flowering, and Serifos and Kassos are late flowering after spring sowing. All varieties are resistant to Ascochyta blight and Sclerotinia diseases, except for Thiva, which is susceptible to both diseases. These varieties were arranged in the field using a randomized complete block design with six replications. Plots were 4 m long and consisted of 10 rows, 0·25 m apart.
The experimental area was uniformly fertilized with 22 kg P/ha in the form of superphosphate, broadcast by hand just before planting and incorporated in the soil. Seeds were hand-planted on 12 March 2003 and 17 March 2004 at within-row spacing of 80 mm to attain a plant density goal of 50 plants/m2. The plants relied on rainfall throughout the growing season. The crop was kept free of weeds by hand hoeing when necessary.
Measurements
Phenological development was recorded twice weekly using the following scale (Fehr et al. Reference Fehr, Caviness, Burmood and Pennington1971; Soltani et al. Reference Soltani, Hammer, Torabi, Robertson and Zeinali2006a): emergence (0·50 of plants with some parts at soil surface), full flowering (0·50 of plants with one flower at one of the two uppermost nodes of the main stem with a completely expanded leaf, growth stage (GS) R2), beginning of seed growth (0·50 of plants with seeds beginning to develop, GS R5) and full maturity (0·95 of pods have obtained their natural colour, GS R8). The total number of nodes (TNN) at GS R2 and GS R5, the number of nodes to first flower (NFF) at GS R2 and the number of nodes below the first pod (NFP) at GS R5, were counted on the main stems of 10 adjacent plants selected at random from each plot.
At GS R2 the root system of 10 successive plants from one of the inner rows was dug and the soil was gently removed by washing. The dry weight of nodules per plant was determined after drying at 70°C until constant weight.
Plant samples from a 1 m length of row in each plot were taken at GS R2, GS R5 and GS R8. The plants were cut at the ground level and the number of plants in the sample was counted. At the final sampling, plants were separated into leaf+stem, pod walls and seeds. All plant samples were oven-dried at 80°C to constant weight, weighed and ground in a Wiley Mill to pass through a 0·5 mm screen. SY was determined by harvesting the six central rows from each plot at GS R8. Nitrogen concentration in plant samples was determined by the standard macro-kjeldahl procedure (Bremner Reference Bremner, Black, Evans, Ensuinger, White and Clark1965).
Nitrogen translocation (g/m2) was calculated as the difference between total plant N content at GS R5 and total N content of vegetative plant parts (leaf+stem+pod wall) at GS R8. Nitrogen translocation efficiency was calculated as the ratio of nitrogen translocation to the total N content at GS R5 (Koutroubas et al. Reference Koutroubas, Papakosta and Gagianas1998). Harvest index (HI) and nitrogen harvest index (NHI) were calculated as the ratios of seed dry weight to the total above-ground dry weight and seed N content to the total above-ground N content at GS R8, respectively. NUE for biomass production at a given GS (NUEb-Rx) was calculated as the ratio of the above-ground dry biomass to the total above-ground N content at this stage (B w-Rx/N Rx) and NUE for SY production (NUEs) as the ratio of seed weight to the total above-ground N content at maturity (S w/N t).
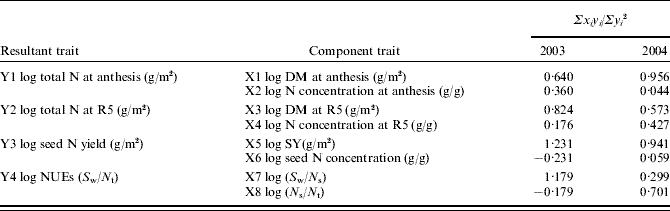
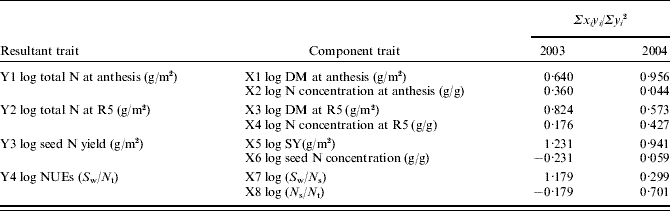
Various expressions were constructed and analysed according to the method suggested by Moll et al. (Reference Moll, Kamprath and Jackson1982). This analysis involves linearizing the multiplicative relationships by taking logs and then determining the contribution of each component trait to the sum of squares of the resultant trait. The sum of cross products of each component trait by the resultant trait (Σxiyi) divided by the sum of squares of the resultant trait (Σyi2) gives the relative contribution of each component variable to resultant variable. This analysis describes the net contribution of each component variable both directly and indirectly through the other variables (Moll et al. Reference Moll, Kamprath and Jackson1982). The following expressions were analysed:
1. Seed N yield (g/m2)=SY (g/m2)×seed N concentration (g/g);
2. Total N content (g/m2)=DM (g/m2)×N concentration (g/g); and
3. NUEs (S w/N t)=(S w/N s)×(N s/N t),
where N s is the total seed N content.
Statistical analysis
A statistical analysis was performed using methods described in Steel & Torrie (Reference Steel and Torrie1980). The homogeneity of variances was checked and all measured and derived data were subjected to an analysis of variance (ANOVA) combined over years. Standard statistical procedures were used for calculating simple correlation coefficients and linear regression equations.
RESULTS
Crop phenology
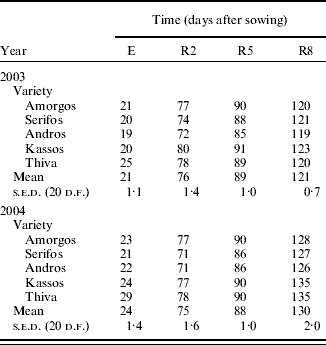
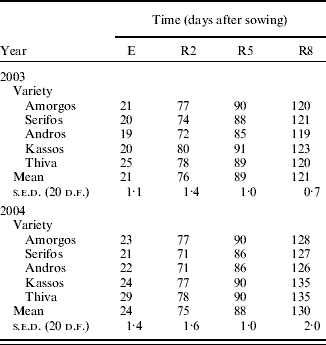
Average crop duration was 121 days in 2003 and 130 days in 2004 (Table 3). Small differences in cropping cycle duration among varieties were observed. The time to reach GS R2 varied from 72 (Andros) to 80 (Kassos) days in 2003 and from 71 (Serifos, Andros) to 78 (Thiva) days in 2004. Grain filling took place mainly in June and coincided with dry and warm weather conditions in both years (Table 2).
Time required for emergence (E), anthesis (R2), beginning of seed growth (R5) and maturity (R8) of five chickpea varieties in 2003 and 2004
Nodulation and node appearance on the main stem
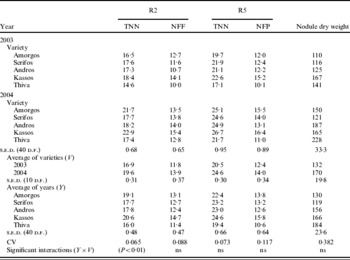
Nodules formed in the root system of all varieties in both years. There were no marked differences in nodulation pattern between varieties. Most of the nodules were distributed on the primary root and the initial portion of the secondary roots. The nodule dry weight was not affected by variety or year (Table 4). The mean nodule dry weight over the 2 years ranged from 119 mg/plant (Serifos) to 184 mg/plant (Thiva).
Total number of nodes (TNN) at R2 and R5, number of nodes to first flower (NFF) at R2, number of nodes to first pod (NFP) at R5 and nodule dry weight (mg/plant) of five chickpea varieties in 2003 and 2004

The TNN at GS R2 and GS R5 was significantly affected by year and variety. The TNN averaged over varieties at both sampling stages was significantly higher in 2004 compared to that in 2003 (Table 4). However, the increase in TNN at GS R2 observed in 2004 was significant for the varieties Amorgos, Kassos and Thiva, whereas the corresponding increase in TNN at GS R5 was significant for all the varieties. At GS R5, the TNN averaged over the 2 years was highest in Kassos (24·6) and lowest in Thiva (19·4). The responses of NFF and NFP generally followed the pattern of TNN.
Dry matter (DM) accumulation and partitioning, and seed yield
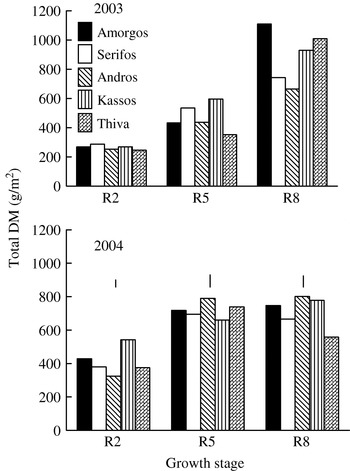
The total above-ground DM accumulation of the five chickpea varieties at GS R2, GS R5 and GS R8 is shown in Fig. 1. In 2003, all varieties accumulated similar amounts of DM until GS R2. In contrast, there were significant differences between varieties for DM at GS R5, with Kassos having the highest value (597 g/m2) and Thiva the lowest (352 g/m2). In 2004, significant DM accumulation differences were observed between the varieties at both GS R2 and GS R5 and these differences were not consistent between the sampling stages. A significant year×variety (Y×V) interaction was observed for DM at GS R2 and GS R5 with different ranking of the varieties in each year. The overall varieties mean DM at GS R2 and GS R5 was significantly higher in 2004 compared to 2003. DM accumulation at GS R2 and GS R5 was significantly correlated with TNN at GS R2 (r=0·86, P<0·01) and TNN at GS R5 (r=0·82, P<0·01), respectively.
Total above-ground DM accumulation of five chickpea varieties at anthesis (R2), beginning of seed growth (R5) and maturity (R8) in 2003 and 2004. Vertical lines indicate s.e.d. (d.f.=40) for each growth stage.

The total above-ground DM increased between GS R5 and GS R8 in all varieties in 2003 and in Amorgos, Andros and Kassos in 2004. In contrast, a decrease in DM between GS R5 and GS R8 was observed in Serifos and Thiva (Fig. 1). At GS R8, total DM was the highest in Amorgos (1110 g/m2) in 2003 and in Andros (801 g/m2) in 2004. The total DM at GS R8 between years was higher in Amorgos and Thiva and lower in Andros and Kassos in 2003 than in 2004, whereas in Serifos total DM was similar across years. Total DM at GS R8 was not significantly correlated with SY (r=0·43, P>0·05).
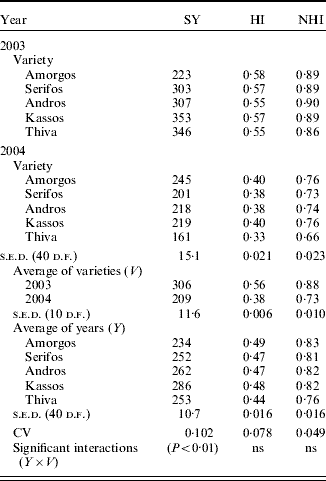
The varieties differed significantly in SY, but their ranking was not consistent between years (Table 5). In 2003, SY of Kassos (353 g/m2) was significantly higher than all varieties except Thiva (346 g/m2), while in 2004 Amorgos gave the highest SY (245 g/m2), followed by Kassos (219 g/m2) and Andros (218 g/m2). All varieties gave significantly higher SY in 2003 than in 2004 except Amorgos, which had similar SY in the 2 years.
Seed yield (SY) (g/m2), harvest index (HI) and nitrogen harvest index (NHI) of five chickpea varieties in 2003 and 2004
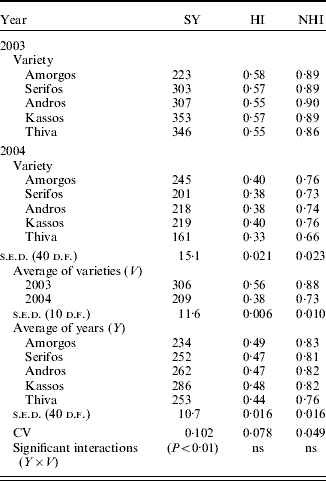
The HI was significantly affected by the year and variety, while there was no significant Y×V interaction (Table 5). None of the HI values obtained in 2004 was higher than those in 2003. This resulted in a significantly higher mean HI in 2003 (0·56) compared to 2004 (0·38). Averaged across years, the mean HI was the highest in Amorgos (0·49) and lowest in Thiva (0·44).
Nitrogen concentration
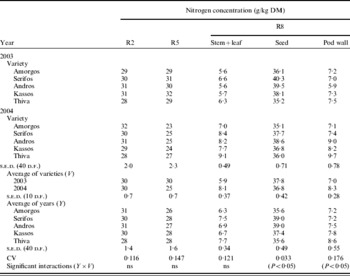
The N concentration at GS R2 ranged from 28·1 to 32·2 g/kg DM and there were no differences between varieties and between years (Table 6). Between GS R2 and GS R5, the N concentration remained constant in 2003, whereas in 2004 it decreased. This resulted in a significantly higher mean N concentration at GS R5 in 2003 compared to that in 2004 (29·9 v. 24·8 g/kg). Varieties had similar N concentrations at GS R5. SY was significantly correlated with plant N concentration at GS R5 (r=0·678, P<0·05).
Plant nitrogen concentration at R2 and R5, and N concentration of (stem+leaf), seed and pod wall at R8 of five chickpea varieties in 2003 and 2004

At GS R8, N concentration in seed was much higher than that of (stem+leaf) and pod wall in all varieties. There were significant differences in seed N concentration between the varieties and their ranking was not similar in the 2 years. In 2003, seed N concentration was highest in Serifos (40·3 g/kg) and lowest in Thiva (35·2 g/kg). In 2004, Andros had the highest N concentration (38·6 g/kg) and Amorgos the lowest (35·1 g/kg). Seed N concentration was negatively correlated with 100-seed weight (r=−0·82, P<0·01). The mean seed N concentration across varieties was significantly higher in 2003 than in 2004. In contrast, the mean N concentration in both (stem+leaf) and pod wall was significantly higher in 2004 compared to 2003. N concentration at GS R8 ranged from 5·6 to 9·1 g/kg in (leaf+stem) and from 5·9 to 9·7 g/kg in pod wall.
Nitrogen content and partitioning
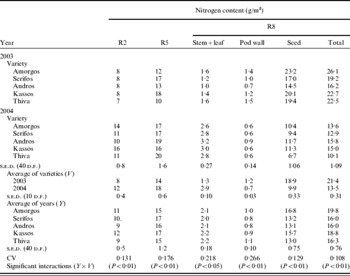
The total above-ground N content at all samplings was significantly affected by main factors, year and variety, as well as by their interaction (Table 7). At both GS R2 and GS R5, the mean N content over varieties was significantly higher in 2004 than in 2003. The differences between varieties for the total N content at GS R2 and GS R5 generally followed the corresponding differences in DM accumulation. At least 0·64 and 0·57 of the variation among the varieties in N content at GS R2 and GS R5, respectively, was due to the variation in DM accumulation (Table 8).
Total plant nitrogen content at R2 and R5 and N content of (stem+leaf), seed and pod wall at R8 of five chickpea varieties in 2003 and 2004

Contribution of the component trait to the resultant trait of five chickpea varieties in 2003 and 2004
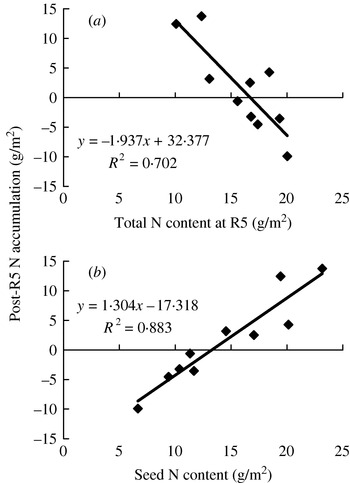
Between GS R5 and GS R8, the total N content increased in 2003, whereas in 2004 it decreased. Post-GS R5 N accumulation was negatively correlated with total N content at GS R5 and positively with seed N content at GS R8 (Fig. 2). The mean total N content over varieties at GS R8 was significantly higher in 2003 than in 2004 (21·4 v. 13·5 g/m2). Both seed and pod wall N content contributed to these differences, whereas stem N content showed a reverse trend between the years. The seed N content ranged from 14·5 g/m2 (Andros) to 23·2 g/m2 (Amorgos) in 2003 and from 6·7 g/m2 (Thiva) to 11·7 g/m2 (Andros) in 2004. Total N content at GS R8 was significantly correlated with total DM accumulation (r=0·92, P<0·01). More than 0·94 of the variation among the varieties in seed N content was due to the corresponding variation in seed DM.
Relationship between (a) total N content at the beginning of seed growth (R5) and post R5 N accumulation, and (b) seed N content and post-R5 N accumulation. Each relationship was based on means derived by five chickpea cultivars and 2 years (n=10).

The NHI was significantly affected by year and variety, while the Y×V interaction was not significant (Table 5). Averaged across years, the variety Thiva had lower mean NHI compared to other varieties, in which NHI was similar. The mean NHI over varieties was significantly higher in 2003 (0·88) compared to that in 2004 (0·73). The NHI was significantly correlated with SY (r=0·82, P<0·01), total N content at GS R8 (r=0·83, P<0·01) and HI (r=0·98, P<0·01).
Nitrogen translocation
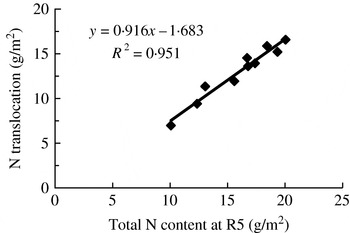
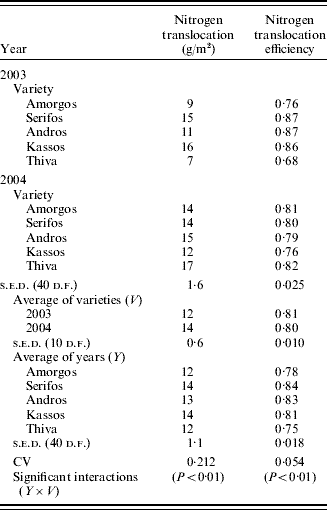
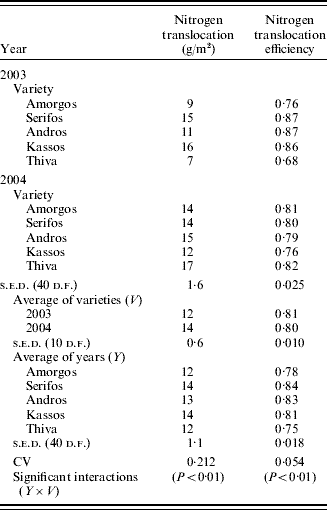
The values of N translocation from the vegetative parts to seeds during the seed-filling period ranged from 7 g/m2 (Thiva) to 15·9 g/m2 (Kassos) in 2003 and from 11·9 g/m2 (Kassos) to 16·6 g/m2 (Thiva) in 2004 (Table 9). There was a positive relationship between N translocation and total N content at GS R5 (Fig. 3). The N translocation efficiency ranged from 0·682 (Thiva) to 0·868 (Serifos) in 2003 and from 0·757 (Kassos) to 0·821 (Thiva) in 2004. The N translocation efficiency between years was higher for Serifos and Andros and lower for the other varieties in 2003 than in 2004. This resulted in similar mean N translocation efficiency over varieties in the 2 years. The N translocation efficiency was significantly correlated with the seed N concentration at maturity (r=0·69, P<0·05).
Relationship between total N content at the beginning of seed growth (R5) and N translocation from vegetative tissues to the seed during the seed-filling period. Each relationship was based on means derived by five chickpea cultivars and 2 years (n=10).

Nitrogen translocation and N translocation efficiency of five chickpea varieties in 2003 and 2004
NUE
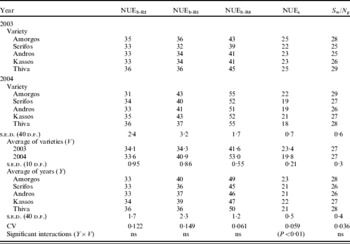
The values of the NUE parameters calculated in the present study are given in Table 10. The NUEb-R8 was higher than NUEb-R5 in both years. The NUEb was significantly higher in 2004 than in 2003 at both GS R5 and GS R8, whereas at GS R2 the NUEb was similar between the 2 years. The varieties showed similar NUEb at both GS R2 and GS R5. In contrast, the NUEb-R8 differed significantly among varieties and was on average highest in Thiva (50 g DM/g N) and lowest in Serifos (45·2 g DM/g N).
Nitrogen utilization efficiency for biomass production (NUEb) at R2, R5 and R8, NUE for SY(NUEs) (g DM/g N) and SY per unit seed N (Sw/Ng) of five chickpea varieties in 2003 and 2004

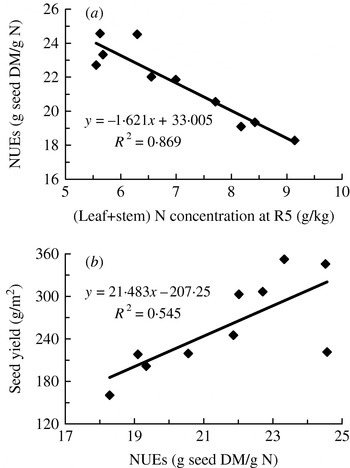
The NUE was significantly affected by the variety, while the effect of year and the Y×V interaction were not significant. The mean NUEs over years was significantly higher in Amorgos and Thiva and lower in Serifos and Andros. The NUE of Kassos was intermediate. Most of the variation among the varieties in NUEs was due to the corresponding variation in S w/N s in 2003 and in NHI in 2004 (Table 8). There was a negative relationship between NUEs and (leaf+stem) N concentration at maturity, and a positive relationship between NUEs and SY (Fig. 4). Moreover, NUEs was significantly correlated with total DM at maturity (r=0·79, P<0·01), total N at maturity (r=0·87, P<0·01), NHI (r=0·89, P<0·01) and HI (r=0·89, P<0·01).
Relationships between NUE for seed production (NUEs) and (a) (leaf+stem) n concentration at maturity and (b) seed yield. Each relationship was based on means derived by five chickpea cultivars and 2 years (n=10).

DISCUSSION
Environmental effects on crop growth and productivity
The yearly differences observed in plant growth and productivity in the present study could be explained by taking into account the corresponding differences in the weather parameters. The early plant growth was more vigorous in 2004 and was accompanied by more DM accumulation and higher TNN on the main stem compared to 2003. This was the result of a higher early crop growth rate in 2004, because growth duration was similar in both years. Crop growth rate is a function of canopy gross photosynthesis and crop respiration (Evans Reference Evans1993), processes that are strongly influenced by the environmental conditions (Loomis & Connor Reference Loomis and Connor1992). The higher temperatures and initial water availability recorded in the spring of 2004 probably led to higher early crop growth rate and resulted in more DM production compared to 2003. Several studies have shown that SY is correlated with early DM production for a wide range of pulses (Thomson & Siddique Reference Thomson and Siddique1997; Thomson et al. Reference Thomson, Siddique, Barr and Wilson1997; Leport et al. Reference Leport, Turner, French, Tennant, Thomson and Siddique1998). In the present study, the high early DM accumulation obtained in 2004 was not accompanied by high SY. On the contrary, SY obtained in 2004 was, on average, 32% lower than that of 2003. This was due to the high temperature stress (>30°C for several days) observed during flowering in 2004, which resulted in a decreased number of pods and seeds per plant compared to 2003 (data not shown). Thus the lower yields observed in 2004 could be attributed to a reduction in sink size. Similarly, Wang et al. (Reference Wang, Gan, Clarke and McDonald2006) reported that both high (35/16°C) and moderate (28/16°C) temperatures imposed during reproductive development significantly decreased the number of pods and seeds per plant in chickpea compared to the control that remained at 20/16°C. The high temperature stress in 2004 also decreased the total DM at maturity compared to 2003, but the effect on SY was more pronounced than the effect on DM. This was reflected by the decreased HI obtained in 2004 compared to that in 2003. The lack of significant correlation between total DM at maturity and SY suggested that DM accumulation was not a good indicator for SY, and therefore, DM evaluation could not be used as an indirect selection criterion for improving SY in chickpea. Similar results have been reported for peanut by Phakamas et al. (Reference Phakamas, Patanothai, Pannangpetch, Jogloy and Hoogenboom2008).
Varietal differences in the response to temperature stress were observed. The yield reduction observed in 2004 was much higher (53%) in the large-sized variety Thiva compared to the other varieties. In contrast, Wang et al. (Reference Wang, Gan, Clarke and McDonald2006) reported no differences in productivity between chickpea cultivars in response to temperature stress.
The results reported in the present paper demonstrated the crucial role of the variation in the weather parameters between growing seasons as one of the main causes of seasonal variation in rainfed chickpea growth and productivity under Mediterranean conditions. Similar findings have been reported by López-Bellido et al. (Reference López-Bellido, López-Bellido, Khalil and López-Bellido2008).
Nitrogen accumulation and translocation
Chickpea can obtain a significant portion of its N requirement through symbiotic N2 fixation when grown in association with effective, compatible Rhizobium strains: this is dependent on location, season and cultural practices (Malhotra et al. Reference Malhotra, Blake, Abd El-Moneim, Erskine, Sarker, Saxena, Thomas, Afandi and Serraj2004). The similarity in nodulation pattern and nodule dry weight across varieties and years found in the present study may give an indirect indication that N2 fixation was not the main factor causing variation in N accumulation among varieties. Kyei-Boahen et al. (Reference Kyei-Boahen, Slinkard and Walley2002) reported that N2 fixed by chickpea was strongly correlated with dry weight of lateral-root nodules, while much lower or no correlation existed between N2 fixed and dry weight of the crown root nodules. Nitrogen accumulation is a function of DM production and N concentration. Most of the variation in plant N content among varieties could be explained by the corresponding variation in DM accumulation. Additionally, the higher total N accumulated by plants up to GS R5 in 2004 was due to their increased DM accumulation, because N concentration was similar or lower compared to 2003. Similarly, Soltani et al. (Reference Soltani, Robertson and Manshadi2006b) reported a close link between total N and total biomass throughout the growth period until maturity.
The N content of vegetative tissues decreased between GS R5 and GS R8 in both years. Thus, it can be assumed that some of the N stored in vegetative tissues up to the beginning of seed growth was translocated and used for seed filling. Since the percentage was not measured in the present study, it was assumed that all N lost from vegetative parts between GS R5 and GS R8 was translocated to the seed. Therefore, the values for N translocation parameters reported in the present study represent the maximum possible translocation.
Differences in N translocation were detected between varieties. These differences were found to be associated with the amount of N that was available for translocation at GS R5. Varieties with high N content at GS R5 showed high N translocation during the seed-filling period, as indicated by the positive relationship found between the two parameters (Fig. 3). As indicated by the coefficient of determination (R 2) for the linear equation in Fig. 3, 0·96 of the variation among varieties in N translocation could be accounted for by the differences in total N content at GS R5. Additionally, the N translocation was found to be increased in varieties with low post-GS R5 N accumulation, meaning that N translocation was related with genotypic differences in nitrogen accumulation during the later stages of growth. Similar results have been reported for lentil (Kurdali et al. Reference Kurdali, Kalifa and Al-Shamma1997). Egli et al. (Reference Egli, Meckel, Phillips, Radcliffe and Leggett1983) reported that the contribution of remobilized N to the seed appears to be more dependent on the amount of N available for remobilization at the onset of seed-filling than on the availability of soil N or its fixation during seed filling.
The values of N translocation efficiency calculated in the present study ranged from 0·682 to 0·868. Soltani et al. (Reference Soltani, Robertson and Manshadi2006b) reported values of N translocation efficiency between 0·363 and 0·549 depending on the time of sowing, with values increasing as sowing shifted from autumn or early winter to the spring. In the present study, higher N translocation efficiency resulted in higher seed N concentrations at maturity, as indicated by the positive correlation found between the two parameters. The negative correlation detected between seed N concentration and 100-seed weight is in agreement with the previous studies (Beech & Leach Reference Beech and Leach1988; Soltani et al. Reference Soltani, Robertson and Manshadi2006b). This is because the ratio of embryo, which has high N concentration, to seed is lower in cultivars with small grains.
Assessment of N losses
Comparing the total N content between GS R5 and GS R8, both gains and losses were observed (Table 7). The pattern of N accumulation during the seed-filling period was not similar across the varieties and years. N losses were observed only in 2004 and ranged from 0·61 to 9·92 g N/m2. Stutte et al. (Reference Stutte, Weilans and Blem1979) reported that at least 4·5 g N/m2 were lost from soybean foliage under field conditions and these losses were positively correlated with the temperature and transpiration rate. Nitrogen loss from plants has been suggested to arise for several reasons (Stutte et al. Reference Stutte, Weilans and Blem1979). Natural abscission of plant organs would seem to be the primary mechanism of N loss, while volatilization of ammonia associated with senescence of photosynthetic tissues and leaching of soluble organic nitrogen may significantly contribute (Harper et al. Reference Harper, Sharpe, Langdale and Giddens1987; Parton et al. Reference Parton, Morgan, Altenhofen and Harper1988; Peeters & van Laere Reference Peeters and van Laere1992).
The N balance between GS R5 and GS R8 appeared to be dependent on both sink demands for N, which in turn was closely related to sink size and total N accumulated up to the beginning of seed growth (Fig. 2). Based on the linear equations relating these parameters, it can be estimated that seed N content lower than 13·32 g/m2 and N content at GS R5 higher than 16·7 g/m2 resulted in N losses from the plant. Previous studies under Mediterranean conditions have shown that N content at anthesis over 20 g/m2 in wheat (Papakosta & Gagianas Reference Papakosta and Gagianas1991), 15 g/m2 in barley (Przulj & Momcilovic Reference Przulj and Momcilovic2001) and 12·7 g/m2 in safflower (Koutroubas et al. Reference Koutroubas, Papakosta and Doitsinis2004) caused N losses from the plant foliage.
The NUEb-R8 was higher than NUEb-R5, meaning that the NUE during the seed-filling period was higher compared to that during the vegetative period. The NUEs ranged from 18·3 to 24·5 g DM/g N. These values are considerably lower compared to those reported for cereals grown under Mediterranean conditions, e.g. 22–45 g DM/g N in wheat (Papakosta Reference Papakosta1994) and 62–91 g DM/g N in rice (Koutroubas & Ntanos Reference Koutroubas and Ntanos2003). The lower values of NUEs for chickpea were expected due to the higher seed N concentration compared to cereals. The NUEs could be expressed as a function of SY per unit seed N (S w/N s) and NHI (N s/N t). The higher mean NUEs observed in 2003 was the result of the higher NHI, because the S w/N s was similar in the 2 years (Table 10). The relative contribution of NHI to the variation in NUEs among varieties was not similar across years. It seemed that when the environmental conditions favoured high total N accumulation during the early stages of growth (e.g. in 2004), the differences among varieties in NUEs were mainly due to the differences in N partitioning at maturity, e.g. the NHI (Table 8).
The positive correlation found between NUEs and SY (Fig. 4) suggested that high SY was probably associated with more efficient exploitation of N, and therefore, selection for high SY could be accompanied by an improvement in NUEs. Omoigui et al. (Reference Omoigui, Alabi and Kamara2007) also reported that N utilization efficiency in maize could be improved indirectly when selecting for grain yield in areas of low-N availability. From the present study, it appears that an indication of high NUEs could be the low (leaf+stem) N concentration at maturity as suggested by the negative relationship found between the two parameters (Fig. 4). As shown by the coefficient of determination (R 2), 0·87 of the variation in NUEs among varieties could be explained by the variation in (leaf+stem) N concentration at maturity.
NHI was significantly correlated with HI and both were significantly correlated with SY. Thus, breeding for HI is expected to be accompanied by higher NHI and SY. Crop yield improvement has been largely attributed to improvement in HI in many plant species. For example, the higher yield of modern wheat cultivars is related to higher HI (Austin et al. Reference Austin, Bingham, Blackwell, Evans, Ford, Morgan and Taylor1980; Siddique et al. Reference Siddique, Beldford, Perry and Tennant1989).
The present results contribute to a better understanding of growth and N dynamics of rainfed chickpea grown as a spring crop under Mediterranean conditions. It was confirmed that plant growth and productivity are subject to seasonal variations, caused mainly by the variation in weather parameters. Nitrogen translocation from vegetative parts to the seed during the filling period was found to be increased when the amount of N that was available for translocation at GS R5 was high and the post-GS R5 N accumulation was low. Genotypic differences in SY and NUE were detected. Results indicated that a simultaneous improvement of both traits could be achieved. After the harvest of chickpeas the amount of N in residues that remained on the field was on average 3·05 g/m2. Thus, apart from the other rotational effects of chickpea on the cereal-based production systems, a small amount of N is left in the field for the next crop.
We thank Dr K. Iliadis, NAGREF – Fodder Crops and Pasture Institute, Larissa, Greece for providing chickpea seeds used in this study.