Implication
Dairy production systems based on grazed pasture are recognized as being economically efficient. Grazing efficiency can be improved if the consequences of farmer decisions and practices on herbage intake and nutrients supply to grazing dairy cows can be predicted. For this, an accurate method for estimating herbage intake is necessary. Most of the existing methods have been validated with animals fed on pasture alone. The purpose of this experiment was to determine the best method to be used in grazing experiments to accurately estimate herbage intake by grazing dairy cows supplemented with a high level of maize silage.
Introduction
Estimating nutrient intake variations in grazing dairy cows according to management practices enables us to anticipate cow performance responses and thus to improve grazing management. For this, reliable methods are necessary for determining daily pasture intake in highly contrasting situations, either in terms of grazing management or supplementation strategy. Internal or external markers allowing individual measurement of pasture intake of grazing ruminants have long been studied and used (Raymond and Minson, Reference Raymond and Minson1955). One of the oldest methods is to estimate the daily intake from the ratio of daily faecal output (FO) and the indigestible fraction of the pasture (indigestibility). When total faecal collection is not possible, FO can be estimated from the dilution of an inert external marker, usually chromium (Cr) and also titanium (Ti) or ytterbium (Yb; Penning, Reference Penning2004). Although used and known for a long time, chromic oxide (Cr2O3) could not be recommended due to the toxic and carcinogenic properties of its hexavalent form during laboratory analysis (Costa, Reference Costa1997). Ti is widely used and relevant for indoor studies, including ruminant, monogastric and fish studies. Its use in grazing studies could, however, be arguable as Ti is normally present in soil and can be used to estimate soil intake in grazing animals (Fries et al., Reference Fries, Marrow and Snow1982). Recently, ytterbium oxide (Yb2O3) has been found to be as accurate as Cr2O3 for estimating short-term and long-term variations of FO in dairy cows fed at different feeding levels (Delagarde et al., Reference Delagarde, Pérez-Ramírez and Peyraud2010). Pasture digestibility is conventionally determined using an in vitro technique or from faecal composition, mainly nitrogen concentration (see the reviews of Gordon, Reference Gordon1995; Peyraud, Reference Peyraud1997; Penning, Reference Penning2004).
The n-alkane technique has been used increasingly following the original work by Mayes et al. (Reference Mayes, Lamb and Colgrove1986). This technique is conceptually similar to an FO/indigestibility technique, but enables direct estimation of herbage intake despite incomplete alkane faecal recovery. It combines the use of an internal marker (odd-chain alkane present in the cuticle of plants) and an external marker administered to the animals (even-chain alkane), provided their faecal recoveries are close. One of the main interests is to allow intake estimation with only one chemical laboratory analysis, enabling less sensitivity to the faecal recovery of each marker, intake being mainly determined from the ratio of internal and external markers faecal concentrations.
Each technique has already been the subject of numerous methodological studies, including determination of the best conditions for oral administration of markers and representative faecal collection. The precision of the FO/indigestibility method, although dependent on faecal marker recovery, appears to be particularly sensitive to a good estimation of the indigestible fraction of pasture. The latter appears to be difficult to estimate particularly when ruminants receive large amounts of supplement due to possible digestive interactions and the need to estimate faecal components attributable to supplements (Peyraud, Reference Peyraud1997; Penning, Reference Penning2004). The n-alkanes technique could be better suited to the high supplementation level studies, particularly when supplements and pasture possess different n-alkane profiles (Mayes et al., Reference Mayes, Lamb and Colgrove1986; Elwert et al., Reference Elwert, Kluth and Rodehutscord2004).
Most methodological studies have been conducted with a single marker, and a few comparisons of methods with animals fed indoors have been conducted: Piasentier et al. (Reference Piasentier, Bovolenta, Malossini and Susmel1995) on sheep, Moshtaghi Nia and Wittenberg (Reference Moshtaghi Nia and Wittenberg2002) on steers and Ferreira et al. (Reference Ferreira, Oliván, Rodrigues, Osoro, Dove and Dias-da-Silva2004) on dry cows. This is, however, the only means of determining the accuracy of a method because of the precise measurement of actual intake, a good estimation of the composition of the selected food and the possible total faecal collection enabling the determination of faecal marker recovery. Although marker comparisons have already been conducted on dairy cows at pasture (Malossini et al., Reference Malossini, Bovolenta, Piasentier, Piras and Martillotti1996; Morenz et al., Reference Morenz, da Silva, Aroeira, Deresz, Vasquez, Paciullo, Lopes, Elyas and Detmann2006), no comparative studies on dairy cows have been conducted indoors. The ability of the n-alkanes technique, alone or combined with the 13C technique, to estimate pasture and maize silage proportions when maize silage intake is unknown has been tested by García et al. (Reference García, Holmes, Hodgson and MacDonald2000). However, the ability of the n-alkanes and Yb/faecal index techniques to accurately estimate pasture intake in dairy cows when maize silage supplementation is known has not been studied. The aim of this study was to compare the ability of the n-alkanes and the Yb/faecal index techniques to accurately estimate the pasture intake of dairy cows fed indoors, actual pasture intake being altered by varying the maize silage supplementation level and feeding level.
Material and methods
The two methods compared to estimate herbage intake
For the n-alkanes technique, herbage intake was estimated from dotriacontane (C32) used as an external marker and from tritriacontane (C33) or hentriacontane (C31) used as internal markers, as described by Mayes et al. (Reference Mayes, Lamb and Colgrove1986). For the FO/indigestibility method, FO was estimated from Yb2O3 (Delagarde et al., Reference Delagarde, Pérez-Ramírez and Peyraud2010). Indigestibility was estimated from faecal nitrogen and ADF concentrations used as faecal indices to estimate organic matter (OM) digestibility by multiple regression (Peyraud, Reference Peyraud1997; Ribeiro Filho et al., Reference Ribeiro Filho, Delagarde and Peyraud2005). Also, two methods for estimating FO were compared. The first method is the total faecal collection, used as the reference method. The second one is a partial faecal collection during morning and evening milking times to mimic rectal sampling conventionally used in grazing experiments (Ribeiro Filho et al., Reference Ribeiro Filho, Delagarde and Peyraud2005).
Treatments, experimental design and animals
The herbage intake estimation methods were compared under four feeding regimes considered as treatments. The feeding regimes differed by the proportion of herbage in the diet (25%, 50% or 75% on a dry matter (DM) basis) and by the feeding level (100% or 70% of ad libitum total DM intake), according to the following combinations:
(i) H75: herbage : supplement ratio of 75 : 25, fed at 100% of ad libitum DM intake.
(ii) H50: herbage : supplement ratio of 50 : 50, fed at 100% of ad libitum DM intake.
(iii) H25: herbage : supplement ratio of 25 : 75, fed at 100% of ad libitum DM intake.
(iv) H5070: herbage : supplement ratio of 50 : 50, fed at 70% of ad libitum DM intake.
The two feeding levels were selected to mimic the possible range of herbage intake between lax and very severe grazing conditions. Herbage was vegetative perennial ryegrass. The supplement, balanced for net energy and protein as recommended by Institut National de la Recherche Agronomique (INRA; 2007), was based on 0.873 of maize silage and on 0.127 of soyabean meal on a DM basis. The experiment was carried out according to a 4 × 4 Latin square design balanced for residual effects, with four consecutive 14-day periods, comprising 8 days of adaptation to treatments and 6 days of measurements.
The experiment was conducted at the INRA experimental farm of Méjusseaume (longitude −1.71°, latitude +48.11; Brittany, France) from 30 April to 25 June 2005. A total of six multiparous Holstein dairy cows in mid-lactation were each assigned to a treatment sequence, two treatment sequences being repeated. During two pre-experimental weeks, cows were individually fed to determine their voluntary DM intake under similar conditions as the experiment. From morning to evening milking, they received ad libitum freshly cut herbage, refusals being removed and weighed at the evening milking. After evening milking, they were offered individually 10 kg DM of a total mixed ration based on 0.87 of maize silage and 0.13 of soyabean meal, on a DM basis. Any refusal was removed and weighed at the morning milking. Individual voluntary total DM intake was calculated during the second week of the pre-experimental period. The pre-experimental characteristics of the cows, measured from 17 April to 26 April 2005, were: days in milk 131 ± 30 days, milk production 34.0 ± 4.9 kg/day, milk fat concentration 37.4 ± 2.6 g/kg, milk protein concentration 30.2 ± 2.2 g/kg, body weight 642 ± 61 kg and total voluntary DM intake 19.0 ± 0.8 kg DM/day.
Feeding and milking management
Throughout the experiment, the amounts of fresh herbage and supplement to be offered individually were fixed according to treatment and to the voluntary DM intake determined during the pre-experimental period. Fresh herbage was fed twice daily, at 0830 and 1130 h. Maize silage and soyabean meal were fed as a total mixed ration at 1700 h. Fresh herbage was cut once daily at 0700 h in perennial ryegrass swards (Lolium perenne L. cultivar Ohio), after approximately 30 days of re-growth and a nitrogen application of 60 kg/ha immediately after the previous cut. Milking took place twice daily at 0630 and 1630 h.
Measurements
Intake and milk production and composition
Offered and refused amounts of herbage, maize silage and soyabean meal were weighed daily for each cow. Herbage refusals were removed and weighed at 1630 h. Maize silage and soyabean meal refusals, considered as proportional to that offered, were removed and weighed at 0800 h. Herbage and maize silage DM concentration were determined once daily and the soyabean meal DM concentration was determined once weekly. The DM concentration of refusals was determined on each cow from days 9 to 13. The chemical composition of all offered feeds, with the exception of the n-alkane concentration, was determined on oven-dried samples from days 9 to 13. The chemical composition of refused herbage was determined on oven-dried samples from days 10 to 14. The chemical composition of the refused maize silage/soyabean meal mixture was not determined and considered to be similar to that offered because refusals were insignificant.
The n-alkane concentrations of offered herbage and maize silage were determined by collecting representative samples from days 9 to 13, then frozen at −20°C and composited per period before freeze-drying. The n-alkane concentration of refused herbage was determined from individual representative samples from days 10 to 14, then frozen at −20°C and composited per cow and per period before freeze-drying. The n-alkane concentration of herbage selected was calculated for each cow at each period from the amount of herbage offered and refused and their respective n-alkane concentration.
Milk production was measured individually at each milking. Milk fat and protein concentrations were determined using near-infrared spectrophotometry (Milkoscan, Foss Electric, Hillerød, Denmark) from days 10 to 14.
Marker distribution and faecal sampling
Throughout the experiment, the two external markers (C32 and Yb2O3) were assayed twice daily through the ruminal fistula at 0830 and 1700 h. Yb2O3 was incorporated into a pelleted concentrate comprising 0.33 maize, 0.26 wheat, 0.26 barley, 0.115 soyabean meal, 0.03 rapeseed oil and 0.005 Yb2O3, on a fresh matter basis. This pelleted concentrate was fed 200 ± 0.5 g at each time (i.e. 400 g/day). The C32, after dissolving in hot heptane, was incorporated into a cellulose stopper (Carl Roth, Karlsruhe, Germany) containing 392 ± 11 mg of C32 each.
The actual daily FO and faecal excretion of markers were measured from days 10 to 14, cows being equipped with harnesses and a urine collection system from day 9 to ensure a 24-h period of adaptation to harnesses before measurements. For the total faecal collection method, the total amount of faeces was weighed at 0900 h. An initial representative subsample (1% of fresh weight) was oven-dried to determine the Yb concentration. A second representative subsample (0.5% of fresh weight) was frozen at −20°C before freeze-drying to determine the n-alkane concentration. For the milking collection method, the first dung produced by each cow from 0800 h (representative of morning rectal sampling) and from 1530 h (representative of evening rectal sampling) was sampled. An initial 200-g subsample was oven-dried for Yb determination and a second 200-g subsample was frozen at −20°C before freeze-drying for n-alkane determination. All chemical analyses were performed on faecal samples composited per cow and per period.
Principles and calculations of herbage intake from marker techniques
N-alkanes method
Herbage intake was estimated either from C33 or C31 according to equation 1 adapted to the formula proposed for supplemented ruminants by Mayes et al. (Reference Mayes, Lamb and Colgrove1986).
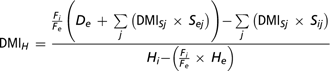
where DMIH represents the daily herbage DM intake (kg), Hi, Sij and Fi represent the herbage, supplement j and faecal concentrations (mg/kg DM) of the internal marker (C31 or C33), respectively; He, Sej and Fe represent the herbage, supplement j and faecal concentrations (mg/kg DM) of the external marker (C32), respectively; DMISj represents the daily intake (kg DM) of each supplement j; and De represents daily dose of the external marker (C32, mg/day).
Yb/faecal index method
For calculation, two methods were used: (a) an indirect two-step calculation, the total intake being calculated first from the total FO and diet digestibility, and herbage intake calculated second by subtracting known supplement intake from the total intake (equations 2 and 4); or (b) a direct calculation from FO due to herbage and digestibility of selected herbage (equations 3 and 4).

where DMIH represents the daily herbage DM intake (kg); OMH represents the herbage OM concentration (g/kg DM); Dyb represents the daily dose of Yb (mg Yb/day); Fyb represents the faecal Yb concentration (mg/kg OM); OMDD represents OM digestibility of the diet as calculated using equation 4 (JL Peyraud et al., unpublished; Ribeiro Filho et al., Reference Ribeiro Filho, Delagarde and Peyraud2005); and OMISj represents the daily intake (kg OM) of each supplement j.
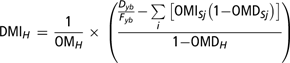
where OMDSj represents OM digestibility of each supplement j; OMDH represents herbage OM digestibility as calculated using equation 4. The OM digestibility of concentrates was calculated from the proportion and OM digestibility of each feed component given in Feed Tables (INRA, 2007). Maize silage OM digestibility was determined from pepsin-cellulase digestibility and crude protein (CP) concentration (INRA, 2007).
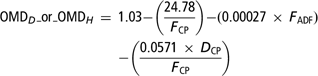
(n = 31, R 2 = 0.92, s.d. = 0.0094), where F CP (g/kg OM) represents the faecal CP concentration (for OMDD calculation) or the CP concentration in the faecal fraction ascribable to herbage (for OMDH calculation); F ADF (g/kg OM) represents the faecal ADF concentration (for OMDD calculation) or the ADF concentration in the faecal fraction ascribable to herbage (for OMDH calculation); D CP (g/kg OM) represents the diet CP concentration (for OMDD calculation) or the herbage CP concentration (for OMDH calculation). The D CP for OMDD calculation was estimated from the CP concentration of the different feeds and from their theoretical proportion in the diet defined in the experimental treatments. For OMDH calculation, CP or ADF concentrations in the faecal fraction ascribable to herbage were estimated as described for supplemented grazing dairy cows by Delagarde et al. (Reference Delagarde, Peyraud and Delaby1999).
Faecal recovery of each marker was calculated by dividing the amount of marker recovered in faeces by the amount of dosed marker. The amount of marker recovered in faeces was calculated by multiplying the actual FO by the marker faecal concentration, determined either by total faecal collection or by faecal collection at milking, enabling two estimates of marker faecal recovery.
Chemical analyses
Oven-dried and freeze-dried samples were ground through a 0.8-mm screen before chemical analyses. The DM concentration was determined in an oven at 80°C during 48 h for feeds and 72 h for faeces. Ash was determined by calcination at 550°C during 5 h in a muffle furnace (Association Française de Normalisation, 1997). The nitrogen concentration was determined using the Dumas method (Association Française de Normalisation, 1997) on a Leco instrument (Leco, St. Joseph, MI, USA). The concentration of ADF (following NDF) was determined according to van Soest et al. (Reference van Soest, Roberson and Lewis1991) on a Fibersac extraction unit (Ankom Technology, Fairport, NY, USA). Yb was determined using atomic absorption spectrophotometry with a nitrous oxide/acetylene flame (Varian spectraa-20, Varian France SA, Les Ulis, France) after calcination and digestion in nitric acid (94.5 g/l) as described by Siddons et al. (Reference Siddons, Paradine, Beever and Cornell1985). N-alkane concentrations in the feed and faeces were determined using gas chromatography according to Mayes et al. (Reference Mayes, Lamb and Colgrove1986) after direct saponification (Vulich et al., Reference Vulich, O'Riordan and Hanrahan1991).
Statistical analyses
Animal data were analysed according to a 4 × 4 Latin square design using the GLM procedure of Statistical Analysis System Institute Inc. (1987) with the following model:

where μ, Ci, Pj, Tk and εijk represent the mean, cow effect, period effect, treatment effect and residual term, respectively. For each variable, statistical analyses were conducted on data averaged per cow and per period. Only milk production and composition from days 8 to 14 were used for statistical analyses. A total of three orthogonal contrasts were used to determine: (i) the mean effect of feeding level (treatment H50 v. H5070); (ii) the linear effect of herbage proportion in the diet; and (iii) the quadratic effect of herbage proportion in the diet.
The ability of the different methods to accurately estimate actual herbage DM intake was tested through the calculation of the mean-squared prediction error (MSPE), considered as the sum of three components, namely mean bias, line bias and random variation (Bibby and Toutenburg, Reference Bibby and Toutenburg1977). The mean relative prediction error (MPE), indicating the average precision of the prediction, was calculated by dividing the square root of MSPE by the mean actual herbage DM intake.
Results
Actual intake, FO and in vivo diet digestibility
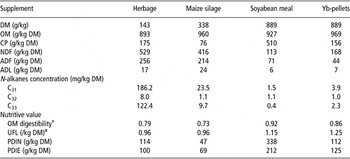
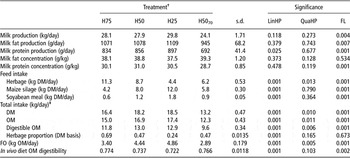
The chemical composition and nutritive value of the feeds are given in Table 1. The amount of intake of each feed was very close to the amount offered (no refusals), except in H75, where the cows refused on average 2 kg DM/day of herbage. Herbage DM intake, total DM intake and herbage proportion in the diet were lower than expected in H75, explaining the quadratic effect of herbage proportion in the diet on these variables (Table 2). The reduction in the total DM intake between 100% and 70% of ad libitum was of 5.0 kg/day, that is, on average a 27% reduction of feeding level. Diet composition was not affected by feeding level.
Chemical composition and nutritive value of the feeds

Yb = ytterbium; DM = dry matter; OM = organic matter; UFL = Unité Fourragère Lait; PDIN = Protein truly Digested in the Intestine when Nitrogen is limiting for microbial synthesis in the rumen; PDIE = Protein truly Digested in the Intestine when Energy is limiting for microbial synthesis in the rumen.
†Calculated from pepsin-cellulase digestibility (Aufrère and Michalet-Doreau, Reference Aufrère and Michalet-Doreau1988) for forages and from chemical composition (Institut National de la Recherche Agronomique (INRA), 2007) for concentrates.
‡1 UFL = 7.115 MJ net energy for lactation.
Effects of herbage proportion in the diet and FL on milk production, milk composition, feed intake, FO and in vivo diet OM digestibility in dairy cows

FL = feeding level; FO = faecal output; OM = organic matter; LinHP = linear effect of herbage proportion; QuaHP = quadratic effect of herbage proportion.
†Treatment definitions: H75: herbage : supplement ratio of 75 : 25, fed at 100% of ad libitum DM intake.
H50: herbage : supplement ratio of 50 : 50, fed at 100% of ad libitum DM intake.
H25: herbage : supplement ratio of 25 : 75, fed at 100% of ad libitum DM intake.
H5070: herbage : supplement ratio of 50 : 50, fed at 70% of ad libitum DM intake.
‡Including Ytterbium pellets (0.36 kg DM/day).
Faecal OM output increased with decreasing herbage proportion in the diet. This increase was greater between H75 and H50 than between H50 and H25 (quadratic effect: P < 0.01; Table 2). Faecal OM output decreased by 1.55 kg/day (−35%, P < 0.001) with decreasing feeding level. In vivo diet OM digestibility decreased linearly with decreasing herbage proportion in the diet (−0.052 between H75 and H25, P < 0.001) and increased by 0.029 (P < 0.002) with decreasing feeding level.
Milk production and composition
Milk production and fat production did not vary with herbage proportion in the diet (Table 2). Protein production increased linearly with decreasing herbage proportion in the diet (P < 0.025). When the feeding level was reduced from 100% to 70% of ad libitum intake level, milk production (−3.8 kg/day, P < 0.004), fat production (−133 g/day, P < 0.007) and protein production (−164 g/day, P < 0.001) were reduced. Milk fat concentration was unaffected by the treatments. Milk protein concentration decreased by 2.3 g/kg with decreasing feeding level (P < 0.001).
Selection of methods for estimating herbage DM intake
For the n-alkanes method, herbage DM intakes estimated either from C31 or C33 were highly correlated, both with total faecal collection (R 2 = 0.99) and with faecal collection at milking (R 2 = 0.99) (Figure 1). Consequently, only herbage DM intake estimated from C33 will be presented and discussed hereafter.
Relationship between herbage dry matter (DM) intake estimated from alkane C31v. C33 in dairy cows fed different proportions of herbage in the diet and at two feeding levels (● = 75%; ○ = 50%; ▴ = 25% of herbage proportion fed at 100% ad libitum intake level; and ▵ = 50% of herbage proportion fed at 70% of ad libitum intake level).

For the Yb/faecal index method, a high correlation between indirect (a) and direct (b) methods was also observed, both with total faecal collection (R 2 = 0.98) and with faecal collection at milking (R 2 = 0.97) (Figure 2). The indirect method (a) has the advantage of being independent of the digestibility estimates of the different supplement components (OM, CP, ADF), values always difficult to determine even in Feed Tables. Consequently, only herbage DM intake estimated from the indirect method will be presented and discussed hereafter.
Relationship between herbage dry matter (DM) intake estimated from ytterbium (Yb) either by the direct method or by the indirect method in dairy cows fed different proportions of herbage in the diet and at two feeding levels (● = 75%; ○ = 50%; ▴ = 25% of herbage proportion fed at 100% of ad libitum intake level; and ▵ = 50% of herbage proportion fed at 70% of ad libitum intake level). In the direct method, herbage intake is estimated from faecal output attributable to herbage and from digestibility of selected herbage. In the indirect method, herbage intake is estimated by the difference between the total intake (total faecal output and digestibility of the diet) and the known intake of supplements (see text for more details).

Herbage DM intake estimated from n-alkanes method
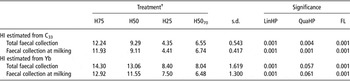
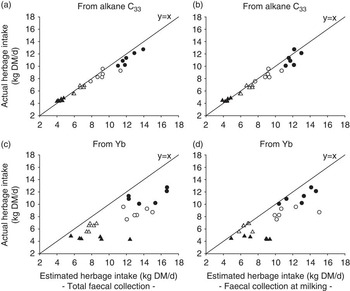
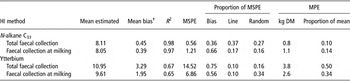
On average, herbage DM intake estimated from C33 was 8.1 kg/day for both faecal collection methods (Table 3), that is, a mean 5% overestimation of the actual herbage DM intake (7.7 kg/day). This bias increased with increasing herbage proportion in the diet, reaching a maximum bias of 1 kg DM/day in H75. The effect of feeding level on herbage DM intake was well predicted by the n-alkanes method. The difference in herbage DM intake between the two feeding levels was estimated at 2.7 and 2.4 kg/day with total faecal collection and the faecal collection at milking, respectively (Table 3), compared with an actual difference of 2.4 kg/day. Considering all individual data, the actual herbage DM intake was highly correlated with herbage DM intake estimated from C33, for total faecal collection (R 2 = 0.98) and for faecal collection at milking (R 2 = 0.97) (Figure 3). The MPE of herbage DM intake estimated from C33 was 0.8 and 1.1 kg/day for total faecal collection and faecal collection at milking, respectively, that is, a relative MPE of 0.10 and 0.14, respectively (Table 4).
Effects of herbage proportion in the diet and FL on HI estimated either from C33 or Yb according to the faecal collection method

FL = feeding level; HI = herbage intake; Yb = ytterbium; LinHP = linear effect of herbage proportion; QuaHP = quadratic effect of herbage proportion.
†See Table 2 for treatment definitions.
Relationship between actual herbage dry matter (DM) intake and herbage DM intake estimated from n-alkane C33 or from ytterbium (Yb) in dairy cows fed different proportions of herbage in the diet and at two feeding levels (● = 75%; ○ = 50%; ▴ = 25% of herbage proportion fed at 100% of ad libitum intake level; and ▵ = 50% of herbage proportion fed at 70% of ad libitum intake level).

Statistical evaluation of the accuracy of different methods (two markers × faecal collection method) to estimate the actual HI in dairy cows fed on diet varying in the proportion of herbage and in FL

HI = herbage intake; FL = feeding level; MSPE = mean square prediction error; MPE = mean prediction error.
†Estimated minus actual.
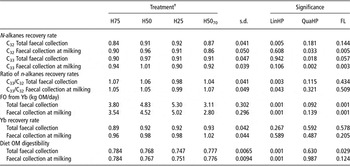
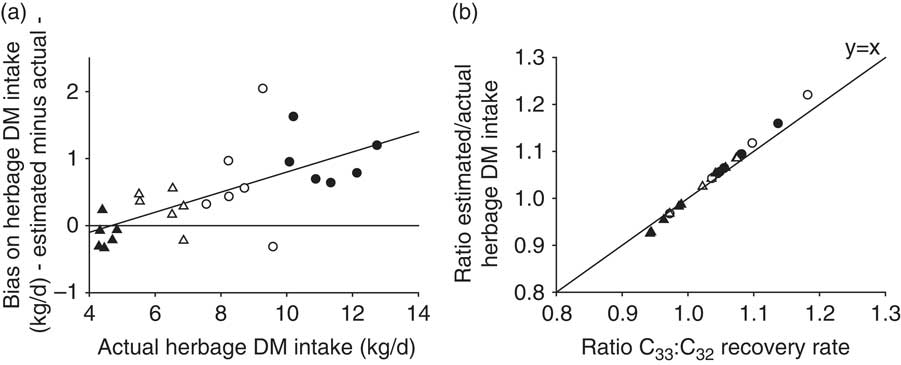
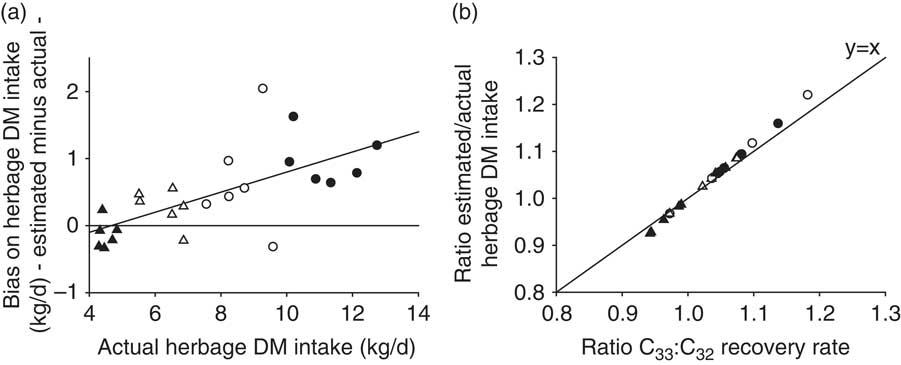
Faecal recoveries of C32 and C33 were on average 0.89 and 0.92 with total faecal collection and 0.91 and 0.94 with faecal collection at milking, respectively. Faecal recovery of C32 and C33 was on average greater on H50 than on H25 and H75, explaining their quadratic evolution with the herbage proportion in the diet (Table 5). Faecal recovery of C32 and C33 calculated from milking faecal sampling decreased with decreasing feeding level (P < 0.01). The ratio of faecal recovery C33 : C32, which determines intake estimation precision, decreased linearly with decreasing herbage proportion in the diet with total faecal collection and faecal collection at milking (P < 0.01 and P < 0.05, respectively). This ratio ranged from 0.98 to 1.07 according to the treatment and faecal collection method, the ratio being close to 1.0 only in H25 (Table 5). The ratio of faecal recovery C33 : C32 was unaffected by feeding level for both faecal collection methods. The n-alkanes method thus slightly biased the estimation of the effect of herbage proportion in the diet, but not the effect of feeding level on herbage DM intake. Considering all data, a very close relationship was found between the ratio of faecal recovery C33 : C32 and the estimated : actual herbage DM intake ratio (Figure 4). This clearly indicates that any bias in the estimation of herbage DM intake originates from a ratio of faecal recovery C33 : C32 different from unity.
Effects of herbage proportion in the diet and FL on markers’ recovery rate, FO estimated from Yb and diet OM digestibility estimated from faecal index in dairy cows according to the faecal collection method

FL = feeding level; FO = faecal output; Yb = ytterbium; OM = organic matter; LinHP = linear effect of herbage proportion; QuaHP = quadratic effect of herbage proportion.
†See Table 2 for treatment definitions.
Relationship between (a) actual herbage dry matter (DM) intake and the bias on herbage DM intake when estimated from C33 with a total faecal collection; and (b) ratio of C33 : C32 recovery rates measured with a total faecal collection and the ratio of estimated/actual herbage DM when estimated from C33 with a total faecal collection in dairy cows fed different proportions of herbage in the diet and at two feeding levels (● = 75%; ○ = 50%; ▴ = 25% of herbage proportion fed at 100% of ad libitum intake level; and ▵ = 50% of herbage proportion fed at 70% of ad libitum intake level).
Herbage DM intake estimated from the Yb/faecal index method
On average, herbage DM intake, estimated from Yb, was 10.9 and 9.6 kg/day for total faecal collection and faecal collection at milking, respectively (Table 3), that is, a mean 42% and 25% overestimation of the actual herbage DM intake (7.7 kg/day). The Yb/faecal index method yielded a poor estimate of the effect of herbage proportion in the diet on herbage DM intake. In fact, the bias, expressed as a proportion of actual intake, was much greater with the lowest herbage proportion in the diet. The Yb/faecal index method also did not properly estimate the effect of feeding level. The difference in herbage DM intake between the two feeding levels was estimated at 5.0 and 5.1 kg/day for total faecal collection and faecal collection at milking, respectively (Table 3), against an actual difference of 2.4 kg/day.
Considering all individual data, a low correlation was observed between actual herbage DM intake and herbage DM intake estimated from the Yb/faecal index, for total faecal collection (R 2 = 0.67) and for faecal collection at milking (R 2 = 0.65) (Figure 3). The MPE of herbage DM intake estimated from Yb was 3.8 and 2.6 kg/day for total faecal collection and faecal collection at milking, respectively, that is, a relative MPE of 0.50 and 0.34, respectively (Table 4). The main source of error was due to the mean bias, representing 0.75 and 0.56 of MSPE for total faecal collection and faecal collection at milking, respectively.
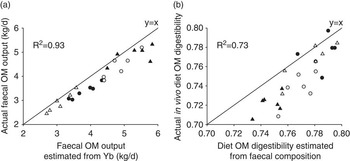
For the Yb/faecal index method, bias on herbage DM intake estimation can originate from bias on estimates of FO or diet digestibility. On average, faecal recovery of Yb was 0.92 and 0.98 for total faecal collection and faecal collection at milking, respectively, that is, an average overestimation of FO of 8% and 2%, respectively (Table 5). Faecal recovery of Yb was unaffected by herbage proportion in the diet and by feeding level, for both faecal collection methods. Finally, faecal OM output estimated from Yb with a total faecal collection correlated highly with the actual faecal OM output (R 2 = 0.93; Figure 5). Yb thus properly estimated the relative variations of FO due to treatments. For example, the relative increase in FO between H75 and H25 was estimated at 39% and 42% with total faecal collection and faecal collection at milking, respectively, compared with an actual value of 43%. The reduction of FO averaged 36% and 38% when the feeding level was reduced, estimated by total faecal collection and faecal collection at milking, against an actual value of 35%.
Relationship between (a) actual faecal organic matter (OM) output and faecal OM output estimated from ytterbium (Yb) with a total faecal collection; and (b) actual in vivo diet OM digestibility and diet OM digestibility estimated from faecal composition with a total faecal collection in dairy cows fed different proportions of herbage in the diet and at two feeding levels (● = 75%; ○ = 50%; ▴ = 25% of herbage proportion fed at 100% of ad libitum intake level; and ▵ = 50% of herbage proportion fed at 70% of ad libitum intake level).

On average, diet OM digestibility estimated from the faecal index was 0.769 and 0.770 for total faecal collection and faecal collection at milking, respectively, compared with 0.750 of the actual in vivo diet OM digestibility (Table 5). This 0.02 overestimation of diet OM digestibility represents an 8% underestimation of the indigestible fraction of the diet (0.02/(1−0.75)). On average, the variations in actual diet OM digestibility were not properly predicted by the faecal index. The decrease in diet OM digestibility between H75 and H25, estimated from the faecal index, was lower than the corresponding reduction measured in vivo (−0.035 v. −0.052). Similarly, the variation in diet OM digestibility between feeding levels, estimated from the faecal index, was three times lower than the variation measured in vivo (0.009 v. 0.028). Moreover, with the faecal collection at milking, estimated diet OM digestibility did not vary with the feeding level, contrary to the actual diet OM digestibility. Considering all data, the correlation between in vivo diet OM digestibility and diet OM digestibility estimated from the faecal index was high (R 2 = 0.73), but with an increasing bias with decreasing herbage proportion in the diet (Figure 5).
Discussion
Mean bias of herbage intake estimation according to the method
The main aim of this study was to determine the accuracy of two methods for estimating daily herbage intake when cows are supplemented with varying proportions of a maize silage-based supplement. The results of this study clearly showed the superiority of the n-alkanes method over the Yb/faecal index method, irrespective of the herbage proportion in the diet, feeding level or faecal collection method. In total collection, the mean bias for herbage intake estimation was 5% and 42%, and the MPE was 10% and 50% for the n-alkanes and the Yb/faecal index methods, respectively. The huge mean bias observed with the Yb/faecal index method results from three multiplicative error sources. First, total FO was overestimated by approximately 10% due to incomplete faecal recovery of Yb. Second, the indigestible fraction of the diet was underestimated by approximately 10% due to overestimation of diet digestibility, leading to an error equal to 20% of the mean for the ratio between FO and indigestibility. Finally, as supplement intake was known, the error was entirely attributed to the herbage portion of the diet, which represents an average of only 50% of the diet, thus doubling the MPE. These cumulative errors did not occur with the n-alkanes method because the calculations are based on an internal marker (C33) whose concentration was significantly different between herbage and supplement, and because the n-alkane concentrations of the selected feeds are accurately estimated in indoor feeding trials. The good accuracy of the n-alkanes technique to estimate pasture intake at a high maize supplementation level is possible because the amount of maize silage intake is known and considered in the calculations. When maize silage intake is unknown, the n-alkanes technique alone is not sufficient to estimate the total, pasture and maize silage intakes and proportions at high maize silage supplementation (García et al., Reference García, Holmes, Hodgson and MacDonald2000). In grazing situations, poor estimation of the n-alkane concentration of selected herbage can also be a significant additional source of bias, particularly with multi-species pastures (Dove and Mayes, Reference Dove and Mayes1996). In our experiment, the 5% mean bias observed with the n-alkanes method can be explained by a ratio of faecal C33 : C32 recoveries slightly different from unity (1.05), no bias arising from the estimation of n-alkane concentration in feeds.
There are few existing comparisons of different marker methods for estimating intake with stall-fed ruminants, although this is the only means of validating a method because the actual intake is precisely measured. The available studies do not suggest the superiority of one method over another. On dry cows fed daily 6 to 8 kg DM of hay, Ferreira et al. (Reference Ferreira, Oliván, Rodrigues, Osoro, Dove and Dias-da-Silva2004) found that the method based on Cr2O3 and acid-insoluble ash allowed intake to be correctly estimated, whereas the n-alkanes method overestimated the actual intake by 10% to 15%. The main source of error with the n-alkanes method was the release of n-alkanes from capsules smaller than those indicated by the manufacturer. Conversely, Decruyenaere et al. (Reference Decruyenaere, Peters, Stilmant, Lecomte and Dardenne2003) found that, in sheep, the n-alkanes method underestimated the actual intake by approximately 30%, because of the difficulty in obtaining a representative sample of selected herbage. Piasentier et al. (Reference Piasentier, Bovolenta, Malossini and Susmel1995) found that in stall-fed sheep the Cr2O3 method overestimated intake by 6% and that the n-alkanes method underestimated intake by only 3%, but with a low correlation between the two methods. Other comparisons of markers, mainly Cr v. n-alkanes, were performed at grazing, only allowing a relative comparison of different methods. In most of these grazing studies, as in our experiment, pasture intake was greater when estimated using Cr2O3 than using n-alkanes (+5% to 19%; Piasentier et al., Reference Piasentier, Bovolenta, Malossini and Susmel1995; Malossini et al., Reference Malossini, Bovolenta, Piasentier, Piras and Martillotti1996; Morenz et al., Reference Morenz, da Silva, Aroeira, Deresz, Vasquez, Paciullo, Lopes, Elyas and Detmann2006). However, the opposite result has also been observed (−12% for Cr2O3v. n-alkanes; Dove et al., Reference Dove, Freer and Foot2000). This variability in the results between studies could be explained by the variability in the techniques and methods used by the authors, for marker administration, faecal sampling or the method for estimating digestibility with the Cr2O3 method (Peyraud, Reference Peyraud1997; Penning, Reference Penning2004).
Marker behaviour with varying herbage proportions in the diet
With the n-alkanes method, the 6% overestimation of herbage intake at a high herbage proportion could be clearly related to the increasing ratio of C33 : C32 faecal recovery with increasing amount of herbage intake. Similar faecal recoveries of internal C33 and external C32 alkanes are the inherent assumption of the method for an unbiased estimation of intake (Mayes et al., Reference Mayes, Lamb and Colgrove1986; Dove and Mayes, Reference Dove and Mayes1996). Oliván et al. (Reference Oliván, Ferreira, Celaya and Osoro2007) also clearly showed a strong proportionality between herbage intake bias and the ratio of C33 : C32 faecal recovery. In our study, the faecal recovery of C33, compared with that of C32 increased with increasing herbage proportion in the diet. The first assumption is that the faecal recovery of n-alkanes increases with their level of intake, considering that the intake level of C33 (but not of C32) increases with herbage proportion in the diet due to the low C33 concentration in supplements. Ohajuruka and Palmquist (Reference Ohajuruka and Palmquist1991) already observed a strong positive correlation between the daily intake of C31 and its faecal recovery. However, such an assumption would mean that the estimation of the supplementation effect on forage intake (substitution) may be biased, which is not observed in most studies (Mayes et al., Reference Mayes, Lamb and Colgrove1986; Dove et al., Reference Dove, Mayes, Freer, Coombe and Foot1989; Piasentier et al., Reference Piasentier, Bovolenta, Malossini and Susmel1995). To our knowledge, no studies have proven that faecal n-alkane recovery is independent of the n-alkane intake level, particularly for C32. The second assumption is linked to the probable increase in the transit rate with increasing herbage proportion in the diet (Mambrini and Peyraud, Reference Mambrini and Peyraud1994). It can be hypothesised that, with a higher transit rate, digestion of C32 is more limited than that of C33 due to the slow release of C32 from the cellulose stopper. Several studies, however, have indicated similar or greater faecal C32 recovery than faecal C33 or C31 recovery (Piasentier et al., Reference Piasentier, Bovolenta, Malossini and Susmel1995; Moshtaghi Nia and Wittenberg, Reference Moshtaghi Nia and Wittenberg2002; Oliván et al., Reference Oliván, Ferreira, Celaya and Osoro2007). Among these authors, those observing a huge bias in intake estimation suggest that internal alkane would transit with the solid phase, whereas the C32 would transit more quickly with the liquid phase. In our study, the inclusion of C32 in a cellulose stopper probably limited quick transit with the liquid phase.
Yb2O3 seems to be a suitable external marker for estimating FO variations when comparing different diets, as faecal Yb recovery did not vary with herbage proportion in the diet. It can be hypothesised that Yb transit is insensitive to differences in sites of digestion and transit rate between diets, these two parameters differing widely between herbage-based and maize silage-based diets (Mambrini and Peyraud, Reference Mambrini and Peyraud1994). Mélix et al. (Reference Mélix, Peyraud and Vérité1987) also observed similar faecal Cr2O3 recovery between herbage-based and maize silage-based diets in dairy cows.
Marker behaviour with varying feeding levels
The fact that the n-alkanes method accurately estimated the effect of feeding level on herbage intake can be directly ascribed to the constancy of faecal C33 : C32 recovery with varying feeding levels. This result is consistent with previous studies (Unal et al., Reference Unal, Garnsworthy and Gorton1997; Elwert et al., Reference Elwert, Kluth and Rodehutscord2004; Oliván et al., Reference Oliván, Ferreira, Celaya and Osoro2007). However, similar to Oliván et al.'s study (Reference Oliván, Ferreira, Celaya and Osoro2007), faecal recovery of n-alkanes was lower at a low feeding level, especially when estimated from milking faecal sampling. This would mean that n-alkanes were better digested at a low feeding level, which is consistent with the increase in in vivo diet OM digestibility and the likely increase in digesta and n-alkane residence time in the rumen. Mayes et al. (Reference Mayes, Lamb and Colgrove1988) and Ohajuruka and Palmquist (Reference Ohajuruka and Palmquist1991) observed that a significant fraction of alkanes were degraded in the rumen, rendering them potentially sensitive to changes in ruminal residence time and thus feeding level. In our study, the fact that faecal C33 : C32 recovery was unaffected by feeding level suggests that the internal and external n-alkanes were similarly degraded in the digestive tract, irrespective of the feeding level. The administration of C32 through a cellulose stopper probably allows similar transit in the digestive tract between internal and external n-alkanes.
Yb2O3 was as accurate as n-alkanes in estimating changes in feeding level. Indeed, faecal Yb recovery did not vary with the feeding level, and the relative changes in FO were well estimated by Yb. This result has already been observed with Cr2O3 (Carruthers and Bryant, Reference Carruthers and Bryant1983; Delagarde et al., Reference Delagarde, Pérez-Ramírez and Peyraud2010) and with Yb2O3 (Delagarde et al., Reference Delagarde, Pérez-Ramírez and Peyraud2010). The latter group of authors observed that faecal Yb concentration, as well as Cr2O3, was highly correlated to the daily variation of FO during a non-steady-state transition period from 100% to 70% ad libitum feeding level. This alsosuggests that Yb behaves as digesta in the digestive tract. Consequently, if the Yb/faecal index method failed to correctly estimate the effect of feeding level, this was not due to Yb per se but rather due to an underestimation of the variation in OM digestibility between feeding levels. The average faecal Yb recovery (0.92) was similar to that found by Delagarde et al. (Reference Delagarde, Pérez-Ramírez and Peyraud2010) when provided as Yb2O3 in dairy cows fed on total mixed ration. This suggests that using a correction factor of 0.92 would improve FO estimation when using Yb2O3 as an external marker in grazing studies. Similar apparent incomplete faecal recovery has already been observed with other external markers such as Cr2O3, with a large range of faecal recovery between studies (Penning, Reference Penning2004).
Estimation of in vivo diet OM digestibility from the faecal index
Our study clearly shows the difficulty in estimating changes in diet OM digestibility from the chemical composition of faeces when modifying the herbage : maize silage ratio and feeding level. In addition to a 0.02 overestimation of diet OM digestibility, the predictive equation used (Ribeiro Filho et al., Reference Ribeiro Filho, Delagarde and Peyraud2005) allows the estimation of only 67% of the variation in digestibility due to herbage proportion in the diet (0.035 v. 0.052) and only 32% of the variation in digestibility due to feeding level (0.009 v. 0028). It is not surprising that such a predictive equation established on unsupplemented cows fed on fresh herbage failed to accurately estimate OM digestibility of mixed herbage/maize silage diets. It is possible that the good relationship established between faecal nitrogen concentration and OM digestibility between types of sward does not apply to changes in the intake level of maize silage or feeding level. In this experiment, the bias on diet OM digestibility estimation increased with increasing maize silage proportion in the diet, particularly because the relative variations of faecal nitrogen and ADF concentrations were low compared with the relative variation of diet OM digestibility when more maize silage was given. Several hypotheses may be mentioned. It is possible that any digestive interaction between feeds is poorly reflected in the principle of a faecal index equation. Chenost et al. (Reference Chenost, Grenet, Demarquilly and Béranger1985), however, observed, in sheep, a similar faecal nitrogen to OM digestibility relationship when comparing herbage-based diets containing 0% to 40% concentrates. Another hypothesis is that endogenous faecal nitrogen is higher in maize silage-based diets compared with herbage-based diets due to more extensive fermentation in the caecum as observed in high-concentrate diets (Ørskov et al., Reference Ørskov, Enoser, Mason and Mann1970). If the OMD/faecal nitrogen relationship differs between maize silage-based diets and herbage-based diets, it can be expected that our predictive equation does not properly predict the digestibility of diets containing more than 50% of maize silage.
The inability of the OMD equation to accurately predict OM digestibility changes with feeding level seems to confirm previous studies by Minson and Raymond (Reference Minson and Raymond1958) and Valderrabano (Reference Valderrabano1979), quoted by Penning (Reference Penning2004). These authors observed that faecal nitrogen, used as an index of digestibility, predicts only 47% and 23% of digestibility variations with changes in the feeding level.
This study also re-emphasizes the need to accurately predict changes in diet digestibility when herbage intake is estimated by using an external indigestible marker such as Cr or Yb (Peyraud, Reference Peyraud1997; Penning, Reference Penning2004). Hence, it seems more appropriate to estimate digestibility from a faecal index equation rather than a fixed in vitro OM digestibility estimate to take OM digestibility variations into account at least partially.
Representativeness of faecal collection at milking
An accurate estimation of herbage intake at pasture requires faecal sampling to be as representative as possible. In our study, using the n-alkanes method, herbage intake was similarly estimated from both faecal collection methods, despite large feeding pattern variations between treatments. This suggests a good degree of representativeness of the milking faecal sampling as already observed by Dove et al. (Reference Dove, Mayes, Freer, Coombe and Foot1989), Vulich and Hanrahan (Reference Vulich and Hanrahan1995) and Oliván et al. (Reference Oliván, Ferreira, Celaya and Osoro2007). This could be related to the relatively steady faecal excretion of n-alkanes throughout the day. The relative within-day variations of faecal C33 : C32 and C31 : C32 ratios were only 95% to 105% in cattle (Oliván et al., Reference Oliván, Ferreira, Celaya and Osoro2007) and 97% to 103% in sheep (Mayes et al., Reference Mayes, Lamb and Colgrove1986).
Conversely, for the Yb/faecal index method, the 12% gap observed between the two types of sampling suggests an unrepresentative milking faecal sampling and an irregular pattern of faecal Yb excretion. Delagarde et al. (Reference Delagarde, Pérez-Ramírez and Peyraud2010) reported, in dairy cows, within-day relative variations of faecal Yb concentration of approximately 85% to 115%, irrespective of the feeding level, similar to Cr2O3. Prigge et al. (Reference Prigge, Varga, Vicini and Reid1981) also reported, with one or two daily administrations of Yb and Cr, within-day relative variations of faecal Yb and Cr of 80% to 120%. Other authors also observed an 85% to 115% range in within-day relative variations of faecal Cr concentration (Bartiaux-Thill and François, Reference Bartiaux-Thill and François1980; Prigge et al., Reference Prigge, Varga, Vicini and Reid1981; Moran et al., Reference Moran, Lemerle and Trigg1987). No previous comparison of Yb and n-alkanes was made. By comparing Cr and n-alkanes on grazing dairy cows, Malossini et al. (Reference Malossini, Bovolenta, Piasentier, Piras and Martillotti1996) and Morenz et al. (Reference Morenz, da Silva, Aroeira, Deresz, Vasquez, Paciullo, Lopes, Elyas and Detmann2006) observed greater within-day and between-day variability in the faecal concentration of Cr than of n-alkanes. Ferreira et al. (Reference Ferreira, Oliván, Rodrigues, Osoro, Dove and Dias-da-Silva2004), however, found no effect of faecal sampling time on intake estimated from both n-alkanes and Cr.
The validity of indoor methodological studies for grazing studies has been frequently discussed and sometimes questioned, especially considering that feeding patterns differ between indoor and grazing studies. In our study, a highly irregular feeding pattern distribution was deliberately chosen between treatments, herbage being fed in the morning and silage in the evening, with a widely variable amount and thus morning : evening proportions. This feeding pattern is probably close to that of dairy cows grazing during the day and supplemented indoors at night (Pérez-Ramírez et al., Reference Pérez-Ramírez, Delagarde and Delaby2008). It is clear that the n-alkanes method is suitable for accurately estimating herbage intake by a twice-daily faecal sampling under very different feeding patterns, type of diet and feeding level.
Conclusion
The use of the n-alkanes method to estimate the daily herbage intake of grazing dairy cows supplemented with moderate to high levels of maize silage can be recommended. The n-alkanes method was clearly more accurate compared with the Yb/faecal index method for estimating herbage intake variations of dairy cows stall-fed with varying herbage proportions in the diet and feeding level. These results were observed with feeding and sampling conditions close to those observed in grazing experiments, that is, highly variable feeding patterns and twice-daily faecal sampling. For the n-alkanes method, however, a small bias in the estimation of herbage intake was found, the bias increasing with herbage proportion in the diet due to an increased ratio of the faecal recovery of internal/external alkane. For the Yb/faecal index method, an incomplete faecal recovery of Yb biased the estimation of FO and total intake but the relative variations of FO between treatments were accurately estimated by Yb. The main problem was the estimation of OM digestibility variations, the faecal index method only partially taking into account the relative changes in OM digestibility due to herbage proportion in the diet and feeding level. The low precision of the Yb/faecal index method was due to these multiplicative sources of error, a problem that did not occur with the n-alkanes method.
Acknowledgements
The CONACYT is gratefully acknowledged for financing the PhD studies of E. Pérez-Ramírez. The authors thank P. Lamberton, A. Cozien, D. Chevrel, M. Texier, J.L. Harel and B. Gréhal of the Méjusseaume experimental farm (INRA, UMR1080 Production du Lait, 35650 Le Rheu, France) for measurements, milking, feeding and care of the cows, and I. Jicquel, N. Huchet and T. Le Mouel (INRA, UMR1080 Production du Lait, 35590 Saint-Gilles, France) for laboratory chemical analyses.