I. INTRODUCTION
Bulk metallic glasses (BMGs) have attracted more attention due to their unique combination of properties such as high strength-to-weight ratio, high strength approaching the theoretical value, excellent wear- and corrosion resistance, good soft magnetic properties.Reference Wang, Dong and Shek1, Reference Chen2 Most of the BMG alloys are associated with multicomponent compositions. Diffraction probes like x-ray or neutron diffraction can provide only the average information on first-coordinate number and first-neighbor distance for these complex alloys, and their atomic scale structures are so far not known. It is generally agreed that metallic glasses show similar structure to its undercooled liquid form, as metallic glasses are mostly made by rapid cooling of molten liquid metals.Reference Duwez, Willens and Crewdson3, Reference Inoue, Zhang and Masumoto4 The early studies on structures of metallic glasses followed the investigations on local structure of simple liquids.Reference Sachdev and Nelson5 Some of the best known studies are the Frank’s hypothesis of 13 atoms local icosahedral clustersReference Frank6 and the dense random packing of hard sphere model proposed by Bernal.Reference Bernal7 Recent results of structural studies supported that Frank’s hypothesis still works in multicomponent BMG-forming liquids.Reference Kelton, Lee, Gangopadhyay, Hyers and Rathz8, Reference Kelton9 To explain the strong preference of icosahedral short-range order (ISRO) in BMGs, effective atomic packing including preferential ISRO is required based on the statistical information given by diffraction. Following the principle of efficient spatial filling, Miracle proposed an efficient cluster-packing model, in which close packing I-clusters or cubic-like solute-centered clusters are retained in BMGs as local representative structural elements.Reference Miracle10, Reference Miracle11 The idea of glue or bridge atoms linking the icosahedral unit clusters was also proposed by Dong et al.Reference Dong, Wang, Qiang, Wang, Jiang, Han, Li, Wu and Xia12
Quasicrystal (QC) is another kind of alloys, which do not have any long-range periodic translational order. Extensive studies on BMGs over the past decade revealed that metastable QCs could grow out from undercooled zirconium (Zr)-based BMG-forming liquids.Reference Zhu, Zhang, Xie and Inoue13 All these QC phases known are icosahedral QC (I-phase). The similarity of structural unit between the I-phase and BMG would offer a chance to understand the structure and formation of BMG alloys. For instance the electron-concentration (e/a-electrons per atom) rule, which was originally developed for QCs, was extended to rationalize BMG-forming compositions.Reference Shek, Wang and Dong14
Arising out of such attempts to explore the structural similarity between the I-phase of QC alloys and the as-yet complex structure of BMG alloy composites including extension of the electron concentration rule originally developed for the QC alloys now hypothesized to be applicable to BMGs, this work proceeds on the premise of similar local structure unit of Zr-based BMG alloys and their I-phase counterparts and the existence of glue structure in the former. As it is difficult to observe directly the cluster structure of BMG alloys because of the multiple constituent elements with different atomic sizes, a comparative study between BMGs and their QC counterparts might provide useful experimental evidence for understanding the structure–property relationship of BMG alloys. Recently, a new in situ Zr-Cu-Al-Ni-Nb (Zr65Cu15Al10Ni10)90Nb10 QC-glass composite produced by suction method was reported.Reference Sun, Shek, Wei, Li and Wang15–Reference Wang17 However, there are substantial differences in the volume fractions of I-phase in these alloys.Reference Qiang, Zhang, Xie, Kimura, Dong and Inoue16, Reference Wang17 In this study, the BMG and I-phase formation alloy are reinvestigated to reveal the effect of casting conditions on its microstructure and mechanical properties.
II. EXPERIMENTS
(Zr65Cu15Al10Ni10)90Nb10 alloy buttons were first prepared by arc-melting the mixtures of pure constituent elements under argon atmosphere. The purities of the metals were 99.9 wt% for Zr, 99.99 wt% for Cu, 99.99 wt% for Ni, 99.99 wt% for Al, and 99.95 wt% for Nb. The alloy ingots were remelted four times to improve compositional homogeneity. Rod samples were made by water-chilled copper mold suction casting. For introducing different oxygen contents into the alloys, the vacuum before arc melting and suction casting were chosen to be 5 × 10⁻² and 5 × 10⁻⁵ mbar, respectively. A titanium (Ti) gas getter was also used in the case of high vacuum. X-ray diffraction (XRD) for phase identification was done with a SIEMENS diffractometer (Cu Kα, λ = 0.15406 nm; SIEMENS, Munich, Germany). Thermal analyses were conducted on a differential scanning calorimeter (DSC; model No. PE DSC7, PerkinElmer Inc., Waltham, MA, and a SETARAM Setsys Evo 16, SETARAM Instrumentation, Caluire, France) at a heating rate of 20 K/min. Cylindrical specimens 2.0 ± 0.03 mm in diameter and 4.0 ± 0.05 mm in length were made for room temperature uniaxial compression test. Quasistatic loadings were carried out at a strain rate of 1 × 10⁻⁴/s using an Instron testing machine. The fractured samples were observed using a scanning electron microscope (SEM; model No. JEOL JSM 820, JEOL Ltd., Tokyo, Japan). Microstructure observations were done with a high-resolution transmission electron microscope (HRTEM; model No. TECNAI 20 G2, FEI Company, Hillsboro, OR) operated at 200 kV. Composition analysis was conducted using an energy-dispersive x-ray analysis (EDX; Oxford Instruments, Abingdon, UK) system attached to the TEM. Specimens cut from rods of 2-mm diameter for microstructure observations were ground to less than 50 μm in thickness, and were further thinned by twin-jet electropolishing using a HClO4-C2H6O solution (volume ratio 1:8) at ∼ −30 °C. These specimens were finally cleaned by low-angle ion milling for no more than 5 min for TEM observation. Measurements of electronic structure were performed using x-ray photoelectron spectroscopy with a monochromatized Al Kα radiation (1486.6 eV) in (XPS; model No. ULVAC-PHI 5802 system Kanagawa, Japan).
III. RESULTS
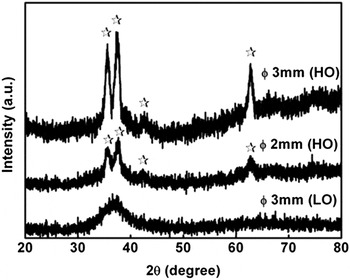
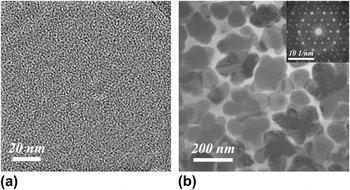
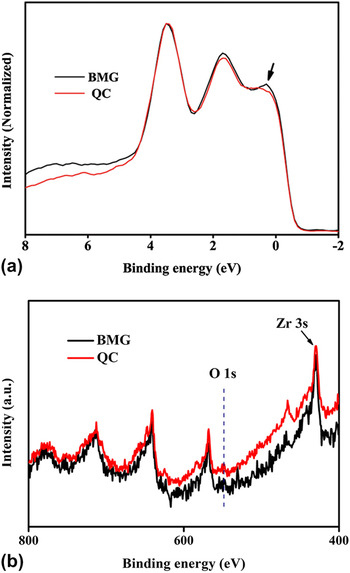
The XRD patterns obtained from the cross-sections of the as-cast alloy rods are shown in Fig. 1. The absence of any sharp diffraction peaks in the XRD pattern of the low oxygen content (LO, 5 × 10⁻⁵ mbar vacuum level) samples indicates that the 3-mm diameter alloy rods are amorphous. The diffraction pattern of the high oxygen level (HO) samples show clearly I-phase peaks as marked by asterisks. Bright-field TEM image of the LO alloy in Fig. 2(a) indicates that no long-range ordered nanodomains or crystallites are present in the alloy. This further confirms its amorphous nature. The bright-field image taken from the HO alloys in Fig. 2(b) shows the coexistence of two phases, namely, the I-phase matrix with grain size ∼250 nm and a glassy phase network. The selected area electron diffraction (SAED) pattern with 5-fold symmetry in the inset of Fig. 2(b) confirms the icosahedral symmetries of the QC phase, and the weak halo in the SAED pattern reveals the existence of glassy phase. EDX measurements were made on six large I-phase grains, which give an average composition of Zr47.3Al7.9Ni12.5Cu19.3Nb13. The composition of the glassy phase was measured to be about Zr67.2Al8.5Ni7.4Cu11.4Nb5.5. No significant microstructural difference was observed between the 2- and 3-mm diameter HO alloys. Taking the morphology and composition results into consideration, the interface-controlled polymorphic phase transformation can be ruled out for the I-phase formation from its undercooled liquid. Phase separation of the undercooled liquid state is likely to occur before the nucleation of I-phase, which would account for the large composition separation of I-phase from the alloy liquid composition. Comparison of the normalized XPS spectra in Fig. 3(a) reveals a reduced electron density of states (eDOS) at the Fermi level in the QC alloy.
XRD patterns of (Zr65Cu15Al10Ni10)90Nb10 rod alloys fabricated in different conditions.

Bright-field images of (Zr65Cu15Al10Ni10)90Nb10 rod alloys: (a) BMG rods of 3-mm diameter; and (b) QC composite rods of 2–mm diameter. The inset is corresponding SAED pattern.

XPS spectra of (Zr65Cu15Al10Ni10)90Nb10 rod alloys: (a) around Fermi level; (b) around O 1s. The arrow in (a) marks the peak around Fermi level and the arrowed Zr 3s peak is a reference for the O 1s line as dotted.

Figure 3(b) shows the XPS patterns for detection of oxygen content in both the BMG and QC alloys. However, no oxygen was found within the limit of detectability (<0.1 at.%). The dotted line marks the position of 1s core electrons of oxygen. Although noise-like peaks are visible at this bonding energy, the calculated oxygen content difference is negligibly small in both alloys by taking the marked Zr 3s states as reference. It is worth noting that the I-phase of the same composition was prepared in a high-level vacuum by other groups,Reference Sun, Shek, Wei, Li and Wang15–Reference Wang17 however, the volume fractions and morphologies of I-phase in the samples are different from the present result. Similar effect was also observed in Ga-alloying Zr-Cu-Al-Ni metallic glass, in which the contents of Ga significantly affected the fraction and morphologies of I-phases.Reference Singh, Yadav, Mandal, Tiwari and Srivastava18, Reference Singh, Mandal, Tiwari and Srivastava19
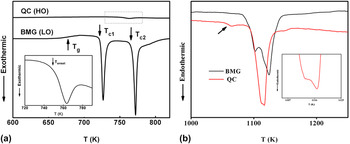
Phase transformations of the glassy and QC alloys upon heating are studied by DSC, and the DSC curves are shown in Fig. 4. The BMG sample exhibits a distinguished glass transition with Tg ∼ 678 K, followed by two sharp crystallization peaks with onset temperatures Tc1 ∼ 723 K and Tc2 ∼ 756 K, respectively. The two peaks imply a possible two-stage crystallization process: glass ➔ metastable phases ➔ stable phases. No visible glass transition was seen in the DSC traces of QC alloys, but there appeared a shallow exothermic peak with onset of ∼749 K, signaling the crystallization of the remaining glassy phase. Changes in enthalpy for the first and second exothermic reactions of the BMG alloy are ∼24.7 J/g, and ∼26.5 J/g, respectively, whereas that for the QC alloys is only ∼0.8 J/g. The small enthalpy change in QC alloys is consistent with the small amount of remaining glassy phase in the sample [Fig. 2(b)]. The change of crystallization temperature in QC alloys indicated that a certain high level of oxygen content resulted not only structural but also compositional changes. The melting process of the BMG alloy [Fig. 4(b)] exhibits two overlapping peaks, whereas an extra small peak with onset of ∼1055 K appears in the QC alloy. The enlarged view of the main melting peak of the QC alloy in Fig. 4(b) shows that there actually exist two peaks. Shift of the first peak toward higher temperature shortened the melting process with an onset of ∼1094 K and an end of ∼1132 K, in comparison with the melting temperature span of ∼1085–1142 K of the BMG alloy.
DSC traces of (Zr65Cu15Al10Ni10)90Nb10 rod alloys: (a) glass transition and crystallization process; and (b) melting process. The inset in (a) is the enlarged view of the dotted frame and the inset in (b) is the magnification of primary melting peaks of the QC composite. The arrowed melting peak in (b) likely caused by the crystalline counterpart of the remanent glassy phase in the QC composite.

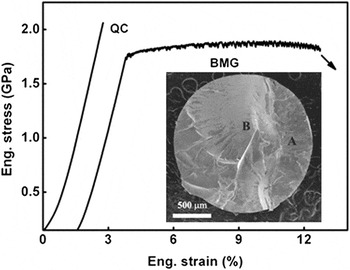
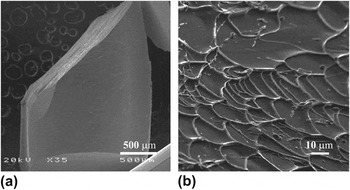
Room temperature compressive engineering stress-strain curves of both QC and BMG samples are presented in Fig. 5. The BMG and the QC alloys exhibit nearly the same Young’s modulus value, say ∼110 GPa. The BMG shows a large apparent compressive plasticity with distinct three-stage characteristics: yielding, jerk flows and steady flows.Reference Pampillo and Chen20 The QC alloy, on the other hand shows hardly any plastic strain, whereas its yield strength and fracture strength are larger than those of the BMG alloy. Shear bands and vein patters are clearly seen in the surfaces of fractured BMG samples (Fig. 6). Unlike the BMG alloy, no serration was detected in the stress-strain curves of QC samples, which implies that shear banding does not occur during the compressive deformation process. Cracks, instead of shear bands, were observed in the lateral surface of the fractured QC sample.
Engineering stress-strain curves for compression of (Zr65Cu15Al10Ni10)90Nb10 BMG and QC composite: the artificial off-set strain in the curve of BMG is for a clear view. The fracture morphology of QC composite was shown in the inset.

SEM observations on fractured BMGs: (a) profuse shear bands on low magnified lateral surface and (b) vein patterns on the fracture surface.

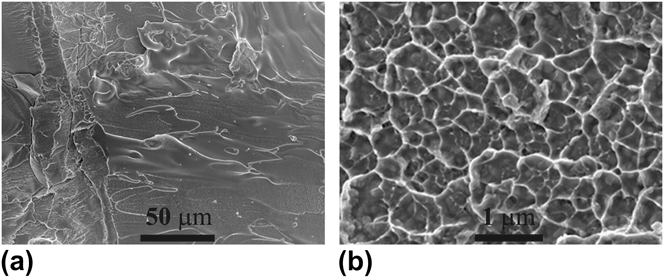
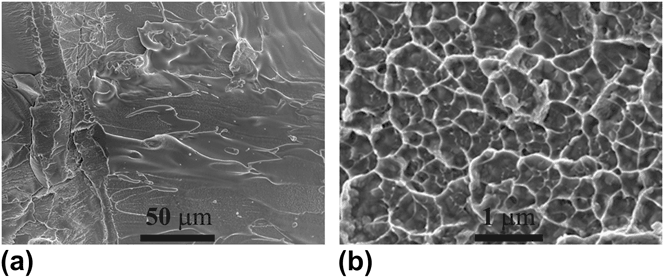
The overview fracture surface of the QC alloy is given in the inset of Fig. 5. Two distinct morphologies are clearly seen, and marked by “A” and “B,” respectively. The high magnification images are shown in Figs. 7(a) and 7(b). The sliding and liquid-like features in region A indicates that failure in this region has occurred by shearing. Such liquid-like features are commonly observed in the fracture surfaces of a wide variety of BMG alloys.Reference Nagendra, Ramamurty, Goh and Li21 The liquid-like feature is localized at regions close to the outer surface of the rod sample. Cleavage-like surface regions are also seen, which are separated by the liquid-like parts [Fig. 6(a)]. Dimples are observed in the magnified view of region “B” [Fig. 7(b)], which suggests a failure caused by local tension.
Magnified views of different regions on the fracture surface shown in the inset of Fig. 5: (a) region “A” and (b) region “B.”
IV. DISCUSSION
As demonstrated by the present study, the (Zr65Cu15Al10Ni10)90Nb10 alloy melt could transform into metallic glass, or alternatively, I-phase. It should be mentioned that the XRD peaks of the I-phase have finite widths with the full width at half maximum (FWHM) much larger than the instrumental resolution. The structural imperfection cannot be annealed out before the I-phase decomposes on annealing.Reference Chidambaram, Sanyal, Nambissan and Sen22 It was questionable that the I-phase structure was strictly long-range icosahedral ordered. The icosahedral glass model, which emphasizes randomly aggregated icosahedral atomic clusters within certain rules, would be useful to describe the I-phase structure.Reference Stephens and Goldman23 Notice that the I-phase can form when annealing the present BMG within the undercooled liquid temperature span,Reference Wang17 the formation of I-phase is not necessarily to be correlated with a certain high oxygen level in the alloy. We suggest that the small amount of oxygen in the alloy may alter significantly the liquid undercooling level as well as the critical cooling rate for glass formation. As the I-phase is metastable, liquid undercooling is a precondition for its formation; and as BMG formation requires much larger liquid undercooling to reach Tg, it is most likely that the oxygen impurity reduces significantly the undercooling level of the alloy melt and, hence the long-range icosahedral order is easily trapped during liquid cooling, instead.
Azad et al.Reference Azad, Mandal and Mandal24 noticed the structural similarities between the dominant clusters in BMGs with those present in I-phases, and proposed a Venn diagram to depict the various parameters of BMGs. The parameters for the present alloy were also calculated using the elemental data proposed in Ref. Reference Azad, Mandal and Mandal24: e/a ∼ 1.74, the radius ratio of the largest atom to smallest atoms ∼1.29, and the ratio of volume per atom of the alloy with volume of the largest atom ∼0.85. The present composition falls into the intersection region of the three spheres of the Venn diagram. Based on the structure formation consideration, BMGs and their I-phase counterparts should exhibit similar mechanical behaviors associated with the dominant cluster structure (shear modulus), but different behaviors associated with the different long-distance spatial array of these cluster structures (strength and plasticity). This is in agreement with the mechanical testing results given in Fig. 5. The BMG shows a low compressive strength but a large macroscopic plasticity, whereas the I-phase is stronger and brittle. The macroscopic plasticity of the BMG sample may be attributed to the weak interactions between the dominant clusters, which are mediated by glue structures. These are further discussed below.
As the shear modulus is related mainly to the bond stretch and distortion, the similar dominant ISRO cluster structures of the BMG and I-phase would deliver a comparable shear modulus. This prediction finds support from the compressive deformation data. Although the I-phase shares the dominant clusters with its BMG, their compositions are different. Their melting points must be different and this is verified by the differential thermal analysis evidence. The I-phase has a higher melting onset temperature than the BMG. The melting point of a metal can be considered as a rough measure of the average strength of metallic bonding.Reference Callister25 Therefore, the bonding states of valence electrons in the I-phase and the BMG structure would play a crucial role for their mechanical strength behavior. Though at the present stage the high resolution valence band spectrum are not available and the detailed band structure information are not known for the two structures, the valence band spectrum in Fig. 3 already shows an evidently reduced eDOS at the Fermi level. This indicates, in a qualitative manner, that the valence electrons in the I-phase are put into higher bonding energy states than those in the BMG structure. As a consequence, the kinetic energy of the valence electrons will be reduced, thus leading to a lowered total energy of the electronic structure. A higher mechanical strength is therefore expected to be observed in the I-phase.
From an atomic structure perspective, the metastable I-phase structure can be viewed as randomly arranged ISRO clusters having long-range bond orientational order. It should be noted that the structure disorder of the Zr-based I-phase is so significant that long wave length phason-strain and/or defects as proposed for stable I-phases hardly seems applicable for the highly defective metastable I-phase. The structure picture suggests that in the HO sample the flow stress of the I-phase would have to do with the breaking of the interconnected ISRO cluster network. In the BMG structure, glue structure is assumed to exist around the dominant ISRO clusters and interact rather weakly with these the clusters. In comparison with the deformation of a rigid I-phase structure, the weak structure regime in the BMG structure would render the initiation of a relatively low stress process possible. The ISRO clusters and the associated glue structure would form the well-recognized shear transformation zone, in which viscous flow can occur. This may qualitatively explain the lower flow stress of the BMG structure in comparison with that of the HO alloy.
The compressive fracture surface of the BMG sample consists of vein patterns and liquid-droplet features. However, these are not observed in the fracture surface of the QC alloy. The fractured QC sample shows some isolated liquid-like bridge characteristic in the region close to the outer surface of the sample. This may in part be attributable to the thermal history of mold-casting rod samples. Actually, the liquid cooling rate is larger at the outer surface region of alloy rod, hence the portion of glassy phase is greater in this region. As the glassy phase has a lower flow stress limit than the I-phase, it deforms first. The estimated height of large veins on the fracture surface [Fig. 6(b)] is ∼4 μm, which is several hundred times as large as the thickness of a shear band (typically ∼10 nm). The result indicates that some kind of superplastic deformation must have occurred within the main shear band, and this, in turn, support that local temperature rise is very significant.Reference Lewandowski and Greer26 The deformed regions are in a supercooled liquid state, and the viscoplastic flow in these regions finally produced the liquid-like bridge feature.
V. CONCLUSIONS
(Zr65Cu15Al10Ni10)90Nb10 BMG was made by copper mold casting under the vacuum level of 5 × 10⁻⁵ mbar, whereas a QC composite was obtained at this composition under a rotation pump vacuum level. Based on the experimental evidence obtained from the microstructure, electronic structure, and mechanical properties studies, some correlations between structure and properties in these alloys were identified: Oxygen impurity favors the formation of I-phase in the (Zr65Cu15Al10Ni10)90Nb10 alloy. It is suggested that the presence of a certain oxygen impurity in the alloy can reduce the undercooling level of the alloy melt and the long-range icosahedral order is easily trapped during liquid cooling. The BMG alloy exhibits a lower room-temperature compressive strength but a large macroscopic plasticity, whereas the I-phase is stronger and brittle. In comparison with the BMG structure, the binding energy states of valence electrons and the rigid atomic cluster structure of the I-phase may account for its high strength. The plastic flow and the fracture surface characteristics of the BMG alloy are explained by assuming existence of glue structures around the ISRO clusters in the BMG structure.
ACKNOWLEDGMENT
The work in this manuscript was support financially by a Strategic Research Grant (Project No. 7002554) from City University of Hong Kong, Hong Kong.