


1 Introduction
Turbulent flows overlying permeable walls are encountered in both natural and engineering systems across a broad range of length scales. Examples include biological interfaces (e.g. arterial walls; Khakpour & Vafai (Reference Khakpour and Vafai2008)), and geophysical systems (e.g. vegetation canopies, river beds; Best (Reference Best2005), Blois et al. (Reference Blois, Smith, Best, Hardy and Lead2012b) and Nepf (Reference Nepf2012)) as well as chemical and nuclear reactors (Hassan & Dominguez-Ontiveros Reference Hassan and Dominguez-Ontiveros2008). Such flows are typically characterized by two primary regions: the flow overlying the permeable interface (termed the surface, or free, flow region) and the flow within the porous bed (termed the subsurface, or pore, flow region). The physics of the former are similar to that of a canonical boundary layer when the interfacial porosity is low, but can be substantially altered with increasing porosity. When the surface flow is turbulent, a transitional layer forms as a buffer between the turbulent surface and laminar subsurface flows (Breugem, Boersma & Uittenbogaard Reference Breugem, Boersma and Uittenbogaard2006; Manes et al. Reference Manes, Pokrajac, McEwan and Nikora2009; Voermans, Ghisalberti & Ivey Reference Voermans, Ghisalberti and Ivey2017). This transition region is marked by nonlinear flow interactions that drive significant exchange of mass, momentum and energy across the permeable interface.
Recent work indicates that the flow structure in the transitional layer is characterized by a broad spectrum of length scales (Poggi et al. Reference Poggi, Porporato, Ridolfi, Albertson and Katul2004; Manes et al. Reference Manes, Pokrajac, McEwan and Nikora2009) and flow interactions in this layer involve a strong coupling between the surface flow and subsurface flow (Breugem et al. Reference Breugem, Boersma and Uittenbogaard2006; Manes et al. Reference Manes, Pokrajac, McEwan and Nikora2009; Kuwata & Suga Reference Kuwata and Suga2016; Kim et al. Reference Kim, Blois, Best and Christensen2018). Using measurements inside a bed of cubically packed spheres, Manes et al. (Reference Manes, Pokrajac, McEwan and Nikora2009) uncovered a uniform and periodic large-scale motion beneath the permeable interface with a wavelength ten times the eddy turnover time (the typical size of the largest eddies generated in the surface-flow region). They speculated that this large-scale motion is induced remotely by the surface flow and imposed onto the flow in the subsurface. Manes et al. (Reference Manes, Pokrajac, McEwan and Nikora2009) also observed an imprint of small-scale turbulent events in the transitional layer, which may be associated with pore-scale vortices generated locally within the porous medium. Kuwata & Suga (Reference Kuwata and Suga2016) leveraged proper orthogonal decomposition (POD) to extract the large-scale pressure perturbations across a permeable interface, and identified spanwise-alternating transverse rolls of pressure over a porous bed formed from interconnected, staggered cubes. This structural coherence was absent in flow over an impermeable bed with identical surface topography, indicating that its origin was directly linked to wall permeability. A recent large-eddy simulation (LES) study (Motlagh & Taghizadeh Reference Motlagh and Taghizadeh2016), considering fully developed turbulent channel flow over a packed bed, used POD to examine the influence of wall permeability on the dynamical features of flow across the permeable interface. Visualization of the first three eigenmodes of pressure fluctuations revealed coherent roller structures that extended in the spanwise direction in the transitional layer for the highest porosity case ( $\unicode[STIX]{x1D6F7}=0.95$, where
 $\unicode[STIX]{x1D6F7}$ is the porosity of the permeable wall), with these motions losing their large-scale coherence with decreasing porosity. Similarly, POD of the wall-normal velocity fluctuations at
 $\unicode[STIX]{x1D6F7}=0.95$ revealed the occurrence of periodic, large-scale, upwelling and downwelling motions across the permeable interface. The numerical work of Breugem et al. (Reference Breugem, Boersma and Uittenbogaard2006) first reported the relationship between the sign of the wall-normal flow transporting fluid across the permeable interface and the sign of the fluctuating streamwise velocity in the surface flow: downwelling flow (
 $v<0$, where
 $v$ is the wall-normal velocity fluctuation), which transports fluid from the surface to the subsurface flow across the permeable interface, is statistically correlated with the simultaneous occurrence of large-scale regions of
 $u>0$ (where
 $u$ is the streamwise velocity fluctuation) in the surface flow, and vice versa. Recent experiments reported by Kim et al. (Reference Kim, Blois, Best and Christensen2018) substantiated this surface–subsurface flow linkage for a permeable bed formed from cubically packed uniform spheres. While this relationship is consistent with that commonly known in wall turbulence (Wallace, Eckelmann & Brodkey Reference Wallace, Eckelmann and Brodkey1972; Lu & Willmarth Reference Lu and Willmarth1973) (whereby streamwise and wall-normal velocity fluctuations tend to be negatively correlated and lead to strong ejection (
 $u<0$,
 $v>0$) and sweep (
 $u>0$,
 $v<0$) events that yield
 $\overline{uv}<0$), the no-penetration condition in classical wall turbulence controls where such events are dominant. In particular, sweeps tend to occur more frequently (and with higher intensity) closer to the wall as they originate away from the wall and impinge toward it. In contrast, ejection events tend to occur more frequently (and with a higher intensity) away from the wall as wall blockage effects impede strong positive wall-normal velocity fluctuations in the near-wall region. In contrast, non-zero wall penetration in permeable-wall turbulence relaxes these constraints on the intensity of such Reynolds-shear-stress producing events and where they can physically occur in the flow. This allows both upwelling and downwelling events of comparable intensity and frequency of occurrence at the wall that are strongly correlated to the passage of low/high streamwise momentum events in the overlying flow.
In addition to the aforementioned structural relationship across the transitional layer, recent work has further explored inner–outer interactions in permeable-wall turbulence (Efstathiou & Luhar Reference Efstathiou and Luhar2018). Such interactions were originally identified in a zero-pressure-gradient, smooth-wall turbulent boundary layer (TBL) by Bandyopadhyay & Hussain (Reference Bandyopadhyay and Hussain1984) who observed a strong coupling between the small (inner) and large (outer) scales. More recently, Hutchins & Marusic (Reference Hutchins and Marusic2007a) revealed the existence of streamwise-elongated coherent motions ( ${>}20\unicode[STIX]{x1D6FF}$) that meander in the spanwise direction in the log region of a smooth-wall TBL from Taylor’s hypothesis reconstructions of pointwise time series of streamwise velocity. Hutchins & Marusic (Reference Hutchins and Marusic2007b) found that these large-scale motions in the outer layer of the flow modulate the small-scale turbulence in the near-wall region. This modulating effect was further quantified by Mathis, Hutchins & Marusic (Reference Mathis, Hutchins and Marusic2009) using a metric based on correlations of the near-wall (small-scale) and outer (large-scale) streamwise velocity fluctuations. Talluru et al. (Reference Talluru, Baidya, Hutchins and Marusic2014) utilized cross-wire measurements in a smooth-wall TBL to capture this modulating effect not only in the streamwise velocity, but also in the wall-normal and spanwise velocity components. Subsequent research identified a clear correlation between the nature of the outer, large scales and the small-scale energy in the near-wall region, with the passage of large-scale, high- (
 $u>0$) and low-momentum (
 $u<0$) regions enhancing and suppressing small-scale turbulent kinetic energy (TKE) near the wall, respectively (Chung & McKeon Reference Chung and McKeon2010; Hutchins et al. Reference Hutchins, Monty, Ganapathisubramani, Ng and Marusic2011; Pathikonda & Christensen Reference Pathikonda and Christensen2019). The degree of modulation is now known to increase with Reynolds number (
 $Re$), and this inner–outer interaction scenario holds even when the wall is not smooth (Anderson (Reference Anderson2016), Squire et al. (Reference Squire, Baars, Hutchins and Marusic2016), Pathikonda & Christensen (Reference Pathikonda and Christensen2017), Wu, Christensen & Pantano (Reference Wu, Christensen and Pantano2019), among others). Recent laser Doppler velocimetry measurements of turbulent flow overlying an open-cell, reticulated foam by Efstathiou & Luhar (Reference Efstathiou and Luhar2018) provided the first indirect evidence of the potential existence of the amplitude modulation (AM) phenomenon in permeable-wall turbulence. Efstathiou & Luhar (Reference Efstathiou and Luhar2018) leveraged the previously established link between velocity skewness and the aforementioned AM correlation in impermeable, smooth-wall turbulence (Schlatter & Örlü Reference Schlatter and Örlü2010b; Mathis et al. Reference Mathis, Marusic, Hutchins and Sreenivasan2011b) to infer the existence of AM effects in this permeable-wall flow scenario. To the best of our knowledge, direct quantification of AM effects, obtainable only via time-resolved measurements, has not yet been reported for permeable-wall turbulence.
The present work builds upon that recently reported by Kim et al. (Reference Kim, Blois, Best and Christensen2018) in which a link between large-scale turbulence in the overlying boundary layer and upwelling/downwelling events at the interface of idealized permeable walls was observed in high-resolution, but low-frame-rate particle-image velocimetry (PIV) data, with a specific focus on the impact of permeable-bed thickness on these flow interactions. To expand upon this initial insight and to study the dynamics of these interactions in the presence (hemispheres) and absence (smooth) of surface topography for fixed bed thickness, low- and high-frame-rate PIV measurements were made in the streamwise–wall-normal ( $x{-}y$) plane of turbulent flow overlying walls with the same internal structure (cubically packed spheres) to investigate the existence of the AM phenomenon in permeable-wall turbulence. These bed configurations allowed assessment of topographical and permeability effects on these inner–outer interactions. The wall models were fabricated using clear acrylic and the experiments were conducted in a refractive-index-matching (RIM) flow facility to overcome issues of optical accessibility. This approach enabled resolution of the rich spatio-temporal nature of flow in the vicinity of, and within, both permeable beds. The high-resolution, low-frame-rate PIV data were used to establish the existence of spatial features consistent with AM effects, thus providing indirect, yet statistically significant, evidence of this phenomenon in a manner similar to Efstathiou & Luhar (Reference Efstathiou and Luhar2018). The high-frame-rate PIV velocity data allowed direct quantification of AM effects in the flow as well as unique spatio-temporal views of these inner–outer interactions by means of conditional averaging.
2 Experiments
2.1 Flow facility
Schematic illustrations of (a) the RIM facility test section showing the dual camera, high-frame-rate (HF) and the single camera, low-frame-rate (LF) PIV experimental set-ups, (b) the smooth and rough permeable-wall models in perspective view, (c) a top view of the models showing the two spanwise positions of the measurement plane relative to the internal particle and pore structure, (d) a side view of the permeable smooth wall showing the two fields of view for the high-frame-rate PIV measurements, simultaneously capturing the surface (sFOV) and the pore (pFOV) flow (same arrangement utilized for flow over the rough permeable wall) and (e) a side view of the permeable rough wall showing the field of view for the low-frame-rate PIV measurements (same arrangement utilized for flow over the smooth permeable wall). The dashed-dot line indicates the position of the permeable interface, while the position of the virtual origin for the rough-wall case is denoted by the dotted line.

Experiments were performed in a closed-loop, RIM flow facility at the University of Notre Dame that is based on a previously developed facility detailed in Blois et al. (Reference Blois, Christensen, Best, Elliott, Austin, Dutton, Bragg, Garcia and Fouke2012a). Figure 1(a) presents a schematic of the facility. The test section, constructed of clear acrylic (refractive index,  $\text{RI}\simeq 1.498$), is 2.5 m long, 0.22 m high and 0.11 m wide, with its lower half containing the permeable walls under study (see figure 1a and Kim et al. (Reference Kim, Blois, Best and Christensen2018)). This arrangement ensured the same cross-sectional area for the incoming flow compared to that of an impermeable smooth wall when the lower cavity is covered. The flow is conditioned by a series of screens and honeycomb prior to a contraction that smoothly guides the flow into the test section, where a TBL then develops along the length of the test section (Kim et al. Reference Kim, Blois, Best and Christensen2018, Reference Kim, Blois, Best and Christensen2019; Pathikonda & Christensen Reference Pathikonda and Christensen2019). This facility can reach a bulk
 $Re$ (
 $Re_{b}=U_{b}\unicode[STIX]{x1D6FF}/\unicode[STIX]{x1D708}$, where
 $U_{b}$ is the bulk velocity,
 $\unicode[STIX]{x1D6FF}$ is the boundary-layer thickness and
 $\unicode[STIX]{x1D708}$ is the kinematic viscosity) of ≃105, or up to
 $1.0~\text{ms}^{-1}$ of free-stream velocity (
 $U_{e}$), with a temporal variability of less than 2 % as driven by pump performance. Such slight deviations in free-stream velocity during the course of an experiment were not large enough to appreciably suppress/enhance AM effects, as they were much smaller than those naturally experienced during the passage of low-/high-momentum events that suppress/enhance AM effects (Hutchins et al. Reference Hutchins, Monty, Ganapathisubramani, Ng and Marusic2011), potentially manifested by a change in instantaneous
 $Re$ as suggested by Zhang & Chernyshenko (Reference Zhang and Chernyshenko2016).
The working fluid of this facility is aqueous sodium iodide (NaI), ∼63 % by weight, whose refractive index ( $\text{RI}\simeq 1.496$ at
 $20\,^{\circ }\text{C}$) is close to that of acrylic (Budwig Reference Budwig1994). Since the RI of the fluid is sensitive to temperature (Narrow, Yoda & Abdel-Khalik Reference Narrow, Yoda and Abdel-Khalik2000), its temperature was finely controlled using an in-line heat exchanger, which allowed fine tuning with a resolution of
 $0.1\,^{\circ }\text{C}$. This level of control is critical to mitigate optical mismatch between the solid and liquid phases. The specific gravity and kinematic viscosity (
 $\unicode[STIX]{x1D708}$) of the NaI solution at ambient temperature are approximately 1.8 and
 $1.1\times 10^{-6}~\text{m}^{2}~\text{s}^{-1}$, respectively. Kim et al. (Reference Kim, Blois, Best and Christensen2018, Reference Kim, Blois, Best and Christensen2019) provide additional details of the facility and its flow character.
As the test section employed herein is of square cross-section, the behaviour of the flow at the measurement location was characterized to determine any possible influence of secondary flows that are known to form in channels of this cross-section (Huser & Biringen Reference Huser and Biringen1993; Pinelli et al. Reference Pinelli, Uhlmann, Sekimoto and Kawahara2010). As discussed in detail in Kim et al. (Reference Kim, Blois, Best and Christensen2018) and Kim et al. (Reference Kim, Blois, Best and Christensen2019), the flow in this square channel was not fully developed at the measurement location (approximately 1.7 m downstream of the test section inlet). As the square channel is enclosed, the TBLs developing on its confinement walls are subjected to a slight favourable pressure gradient in the streamwise direction owing to the pressure drop that drives this internal flow.
Measurements of the boundary layers on all four walls with roughness and permeable surfaces absent (i.e. with the bottom wall impermeable and smooth) revealed their thickness to be approximately 25 mm, leaving a region of at least 60 mm in the core of the channel that is unperturbed (i.e. constant mean velocity and minimal turbulence levels; i.e. a ‘free-stream’ region). Further, these developing, smooth-wall TBLs showed strong consistency with canonical, zero-pressure-gradient, smooth-wall TBL data (see Kim et al. Reference Kim, Blois, Best and Christensen2018). Finally, as reported in Kim et al. (Reference Kim, Blois, Best and Christensen2018), even when the bottom surface was both permeable and rough, meaning its boundary layer was thickest, the top-wall boundary layer showed a very similar consistency with canonical, smooth-wall TBL data. This consistency indicates that, even when the bottom boundary layer is within 20 mm of its top counterpart, the character of the top-wall boundary layer is still canonical in nature. The reader is directed to Kim et al. (Reference Kim, Blois, Best and Christensen2018) where these issues are discussed in greater detail.
2.2 Wall models
The permeable-wall models considered herein were inspired by coarse-grained river beds as a means of mimicking some of the structural attributes of such alluvial deposits, which are characterized by a high degree of porosity and by the coexistence of roughness and permeability at the interface. A simplified representation of this structure was required in order to characterize accurately the flow above and across the permeable interface. As depicted in figure 1(b), the internal structure of the two wall models was identical and consisted of five layers of uniform spheres ( $D=25.4~\text{mm}$ where
 $D$ is the sphere diameter) packed in a simple cubic arrangement (yielding a porosity of
 $\unicode[STIX]{x1D6F7}=48\,\%$). The two walls differ in the topography exposed to the overlying flow (see figure 1b). The first embodies a homogeneous and periodic hemispherical surface topography exposed to the flow and is referred to as the permeable rough wall hereafter. Similar porous beds have been widely utilized in earlier river-inspired studies (Manes et al. (Reference Manes, Pokrajac, McEwan and Nikora2009), Pokrajac & Manes (Reference Pokrajac and Manes2009), Roche et al. (Reference Roche, Blois, Best, Christensen, Aubeneau and Packman2018), among others). The second wall model, referred to as the permeable smooth wall, has the identical internal structure as its rough-wall counterpart, but no topography protruding into the overlying flow, as the upper half of the spheres comprising the top layer of this wall were removed. The interfacial porosity is defined herein by the opening of the first layer of the wall. From this perspective, the permeable rough- and smooth-wall cases have the same porosity. The interfacial permeability (i.e. resistance to mass flow across the interface) will likely differ between these cases due to the specifics of the near-wall flow induced by differences in surface topography. This approach is considered key in this investigation as it isolated the effects of interfacial permeability by controlling the interfacial topography.
The wall models were fabricated by casting an acrylic resin (Crystal Clear 204,  $\text{RI}\simeq 1.499$ at
 $20\,^{\circ }\text{C}$) into silicone moulds, resulting in an excellent RI match with the aqueous NaI working fluid and thus facilitated optical flow measurements near and within the two permeable-wall models. The wall models were mounted on the bottom wall of the recessed section over the entire length of the test section (see figure 1a). Additional details regarding the fabrication process of the models can be found in Kim et al. (Reference Kim, Blois, Best and Christensen2018). In addition to these two permeable-bed models, an impermeable smooth wall, which embodies neither surface topography nor wall permeability, was considered as the baseline for comparison.
2.3 PIV measurements
As schematically illustrated in figures 1(b) and 1(c), PIV measurements were conducted in the streamwise–wall-normal ( $x{-}y$) plane at two spanwise locations, referred to herein as the ‘Crest’ and ‘Trough’ positions (see figure 1b). The crest position corresponds to the spanwise mid-plane of the test section and aligns with the centre of the cubically packed spheres, meaning that the wall is locally impermeable at this spanwise position. The trough region is
 $k=D/2$ offset from the crest position and resides between the cubically packed spheres, meaning that the wall is a fully open (i.e. permeable) interface at this spanwise position so that fluid exchange occurred freely between the surface and subsurface regions. These two different measurement locations allowed investigation of spanwise flow heterogeneity and, by utilizing a double-averaging approach (Manes, Pokrajac & McEwan Reference Manes, Pokrajac and McEwan2007; Nikora et al. Reference Nikora, McEwan, McLean, Coleman, Pokrajac and Walters2007), the global impact of each wall model on the flow was discerned.
Measurements were made approximately 1.7 m (≃67 sphere diameters) downstream of the inlet, corresponding to approximately  $28\unicode[STIX]{x1D6FF}$ for the most conservative case (permeable rough wall). This downstream location falls well above the criterion (
 $15{-}20\unicode[STIX]{x1D6FF}$) of Antonia & Luxton (Reference Antonia and Luxton1971) to attain a self-similar boundary layer. At this measurement location, the thickness of the side-wall and top-wall boundary layers extended approximately
 $2k$ from each wall, meaning that the flow on each permeable wall was a developing TBL (see Kim et al. (Reference Kim, Blois, Best and Christensen2018) for additional details regarding the flow character of this facility under these conditions). Silver-coated glass spheres, with a specific gravity of 3.5 and a mean particle diameter of
 $2~\unicode[STIX]{x03BC}\text{m}$, served as PIV tracer particles (Kim et al. Reference Kim, Blois, Best and Christensen2018). The Stokes number of the tracer particles,
 $St_{p}$, is defined as the ratio of particle relaxation time,
 $t_{p}=(\unicode[STIX]{x1D70C}_{p}-\unicode[STIX]{x1D70C}_{f})d_{p}^{2}/18\unicode[STIX]{x1D70C}_{f}\unicode[STIX]{x1D707}_{f}$ (exponential particle response time to a velocity lag between the fluid and the particle (Adrian & Westerweel Reference Adrian and Westerweel2011)), to the smallest relevant time scale of the flow (viscous time scale,
 $t^{\ast }=\unicode[STIX]{x1D708}/u_{\unicode[STIX]{x1D70F}}^{2}$). In the measurements presented herein,
 $St_{p}\simeq 10^{-4}{-}10^{-5}$ is quite small, meaning that, while these tracer particles are more dense than the NaI working fluid (specific gravity of 1.8), they serve as effective accurate tracers of the fluid motion (Adrian & Westerweel Reference Adrian and Westerweel2011).
Images were processed utilizing a commercial software package (DaVis 8.1.3, LaVision). The image processing scheme began with a sliding background filter and particle intensity normalization to enhance the signal-to-noise ratio. The PIV image pairs were then interrogated using a multi-pass approach with 50 % overlap to satisfy Nyquist’s criterion. Spurious vectors were eliminated using a universal median filter that deemed valid more than 97 % of the calculated vectors. Thus, minimal interpolation of holes was required. Two different PIV arrangements (low and high frame rate) were utilized as described below.
2.3.1 Low-frame-rate PIV set-up
Low-frame-rate PIV measurements were performed over a field of view (FOV) sufficient to fully capture the outer extent of the boundary layer with high spatial resolution. These data facilitated a robust characterization of the flow via statistical analysis of uncorrelated snapshots. These data were collected at both the crest and trough positions (figure 1c) in order to capture the global impact of both permeable walls on the flow overlying and within the permeable walls via a double-averaging method (Kim et al. Reference Kim, Blois, Best and Christensen2019). Beyond this global flow characterization, the analysis reported herein focuses on flow at the trough position of each permeable wall where surface–subsurface flow interactions occurred.
These low-frame-rate PIV measurements were performed with a 29MP PowerView CCD camera ( $6600\times 4400~\text{pixel}$, 12-bit frame-straddle CCD, TSI) and a laser sheet (≃0.5-mm thick) formed from a Quantel EverGreen Nd:YAG double-pulsed laser (
 $200~\text{mJ}~\text{pulse}^{-1}$), all operated at an acquisition rate of 0.5 Hz. Five thousand statistically independent image pairs were recorded for each permeable-wall case, while three thousand image pairs were acquired for the impermeable smooth-wall case (see table 1). Vector fields for each crest case were obtained with a final interrogation window size of
 $16\times 16~\text{pixels}$. However, a larger,
 $32\times 32~\text{pixels}$, window was required for each trough case owing to a thin circular region (
 ${\sim}8~\text{pixels}$) of optical aberration around the rim of each spherical element due to slight RI mismatch between the working fluid and the acrylic wall models that was amplified by the curvature of the spheres. Increasing the window size to
 $32\times 32~\text{pixels}$ mitigated the impact of this optical aberration on the PIV cross-correlation and provided more accurate measurements for each trough case. The experimental parameters for the low-frame-rate PIV measurements are summarized in table 1.
Experimental parameters for the low-frame-rate PIV measurements.

2.3.2 High-frame-rate PIV set-up
High-frame-rate PIV measurements were also performed at the same flow conditions as the low-frame-rate measurements, although data were only acquired at the trough position of each permeable wall as the intent was to capture the dynamics of surface–subsurface flow interactions. In order to maximize spatial resolution and dynamic range, a dual camera set-up, similar to that described in Pathikonda & Christensen (Reference Pathikonda and Christensen2019), was used. Two high-speed, Phantom V641 cameras ( $2560\times 1600~\text{pixels}$, 12-bit CMOS) were mounted on opposite sides of the test section. As depicted in figure 1(a), HF camera 1 and HF camera 2 independently and simultaneously imaged the surface- and the subsurface-flow regions, respectively, in the
 $x{-}y$ plane at the trough position of each wall model with a slight wall-normal overlap. Figure 1(d) illustrates the surface-flow FOV (sFOV;
 $8k\times 4.3k$) and the pore-flow FOV (pFOV;
 $2.5k\times 4k$). This imaging approach ensured adequate spatial resolution in each region of the flow so that the dynamics of the flow exchange across the permeable interface could be appropriately captured. A Northrop Grumman PA-505 dual-cavity, Nd:YLF laser was employed to generate a uniform laser sheet (≃1 mm thick) and data were acquired at 600 Hz.
Twenty-five independent datasets were collected for each wall model, with each dataset size slightly different for the two wall models: 2240 and 2000 time-correlated PIV velocity fields per dataset for the smooth and rough permeable-wall cases, respectively, yielding ensemble time series of 56 000 and 50 000 instantaneous velocity vector fields, respectively. As noted earlier, these time series were acquired at a rate of 600 image pairs per second over a duration of approximately 3.5 s for each independent dataset (3.73 s and 3.33 s for the smooth and rough permeable-wall cases, respectively), corresponding to a temporal resolution of  $2.19y_{\ast }/u_{\unicode[STIX]{x1D70F}}$ (where
 $y_{\ast }$ is the viscous length scale) with a duration of
 $42{-}56\unicode[STIX]{x1D6FF}/U_{e}$ for each dataset. These acquisition parameters ensured resolution of both small-scale turbulence as well as large-scale motions [
 $O(\unicode[STIX]{x1D6FF})$] so that the interactions between these scales could be effectively quantified (Pathikonda & Christensen Reference Pathikonda and Christensen2019). The final interrogation window sizes were
 $16\times 16~\text{pixels}$ and
 $32\times 32~\text{pixels}$ for the sFOV and pFOV, respectively, ensuring nearly the same physical spatial resolution (
 $325~\unicode[STIX]{x03BC}\text{m}$ and
 $310~\unicode[STIX]{x03BC}\text{m}$, respectively) between the FOVs. The experimental parameters for the high-frame-rate PIV measurements are summarized in table 2.
Experimental parameters for the high-frame-rate PIV measurements.

2.4 Data consistency and uncertainty estimates
To confirm that the low- and high-frame-rate PIV datasets acquired at the flow conditions for each wall model indeed captured the same flow behaviour, figure 2 compares profiles of streamwise- and ensemble-averaged streamwise velocity as well as Reynolds normal and shear stresses for each wall model at the trough position. Good agreement is noted in all statistics, meaning that the low-frame-rate data provide a basis for determining the global flow parameters for each flow case that can then be applied to analysis conducted with the high-frame-rate data (which could not be used for this purpose since the FOVs were restricted to the near-wall surface- and pore-flow regions to ensure adequate spatial resolution). The slightly higher levels of Reynolds stresses in the smooth and rough high-frame-rate results near the wall are attributable to the higher spatial resolution of this measurement at the trough position compared to its low-frame-rate counterpart ( $325~\unicode[STIX]{x03BC}\text{m}$ for the former versus
 $430~\unicode[STIX]{x03BC}\text{m}$ for the latter; see tables 1 and 2).
Wall-normal profiles of various flow statistics at the trough position for the (a,b) smooth and (c,d) rough permeable-wall cases computed from the LF (○) and HF (▫) datasets at the same  $Re$. (a,c) Mean streamwise velocity; (b,d) Reynolds normal and shear stresses.

The uncertainty in PIV velocity measurements includes both random and bias contributions. The random error associated with determining particle displacements in PIV measurements depends directly on the particle-image diameter. Prasad et al. (Reference Prasad, Adrian, Landreth and Offutt1992) noted that this random error is approximately 5 % of the particle-image diameter. Here, the particle-image diameter uniformly fell within  $2{-}3~\text{pixels}$ throughout the experiments that corresponds to
 $0.1{-}0.15~\text{pixels}$ as an upper boundary on the random error. Considering the bulk particle displacement of
 $10{-}20~\text{pixels}$ between two PIV images, the uncertainty associated with the sub-pixel estimator in the instantaneous velocity was approximately 0.05 %–1.5 % in the present measurements. The particle-image diameter is also related to bias errors introduced by peak locking that can significantly impact the accuracy of turbulence statistics. However, the current particle-image diameter rendered this bias error negligible as the peak locking effect becomes negligible when the particle-image diameter is greater than 2 pixels (Christensen Reference Christensen2004; Adrian & Westerweel Reference Adrian and Westerweel2011). It should also be noted that the uncertainty in estimation of
 $u_{\unicode[STIX]{x1D70F}}$ using the modified Clauser chart method was approximately 4 %–6 % (Volino, Schultz & Flack Reference Volino, Schultz and Flack2011). Thus, the uncertainty in the statistics was predominantly due to their normalization by
 $u_{\unicode[STIX]{x1D70F}}$.
3 Results
3.1 Global flow characterization
The low-frame-rate data were used to determine the global flow parameters for each wall case. Due to the spanwise flow heterogeneity induced by the relatively large surface topography and the interface porosity of the current wall models, the boundary-layer parameters were assessed via a double-averaging approach (Manes et al. Reference Manes, Pokrajac and McEwan2007; Mignot, Barthélemy & Hurther Reference Mignot, Barthélemy and Hurther2009; Fang et al. Reference Fang, Han, He and Dey2018; Kim et al. Reference Kim, Blois, Best and Christensen2018, Reference Kim, Blois, Best and Christensen2019). This method was originally proposed in vegetated flow studies (Wilson & Shaw Reference Wilson and Shaw1977; Raupach & Shaw Reference Raupach and Shaw1982) and has been applied more recently to flow over large roughness in uniform and periodic configurations (Nikora et al. Reference Nikora, Goring, McEwan and Griffiths2001). As noted by Nikora et al. (Reference Nikora, Goring, McEwan and Griffiths2001), if the spatial variability over at least one roughness wavelength is considered, this method yields statistically significant wall-normal profiles of mean and turbulence quantities that reflect the global impact of surface roughness on the mean flow. In the current context, the low-frame-rate PIV measurements conducted at the crest and trough positions for flow over the rough and smooth permeable walls were used in concert with double averaging (Cheng & Castro Reference Cheng and Castro2002; Manes et al. Reference Manes, Pokrajac and McEwan2007) to obtain representative, spatially averaged mean and turbulence profiles for each flow configuration. Boundary-layer parameters for the current flow configurations, computed following the approach reported in Kim et al. (Reference Kim, Blois, Best and Christensen2018, Reference Kim, Blois, Best and Christensen2019), are summarized in table 3.
Double-averaged wall-normal profiles for the permeable smooth- and rough-wall cases, along with profiles from the baseline impermeable smooth-wall case. (a) Mean streamwise velocity, (b) streamwise Reynolds normal stress, (c) wall-normal Reynolds normal stress and (d) Reynolds shear stress. The notation  $\langle \overline{\cdot }\rangle$ represents double-averaged flow quantities.

Flow parameters for the impermeable smooth and permeable smooth and rough walls based on double-averaged flow quantities.  $\unicode[STIX]{x1D6FF}$: boundary-layer thickness;
 $d$: zero-plane displacement (measured from the base of the permeable walls);
 $u_{\unicode[STIX]{x1D70F}}$: friction velocity;
 $y_{\ast }$: viscous length scale;
 $t_{\ast }$: viscous time scale;
 $Re_{\unicode[STIX]{x1D70F}}$: friction
 $Re$;
 $Re_{\unicode[STIX]{x1D703}}$:
 $Re$ based on momentum thickness;
 $Re_{K}$:
 $Re$ based on permeability,
 $K$;
 $K_{a}$: acceleration parameter.

Figure 3(a) presents double-averaged profiles of streamwise velocity for the three wall conditions (impermeable smooth and permeable smooth and rough). A downward shift relative to the impermeable smooth-wall profile is observed for both permeable walls, with the permeable rough-wall case showing a larger downward shift compared to its smooth-wall counterpart. Such a shift is characteristic of rough-wall flows owing to increased flow resistance at the wall (Raupach Reference Raupach1981; Jiménez Reference Jiménez2004). Similarly, the permeable smooth- and rough-wall cases presented herein display such a shift owing to increased flow resistance at the boundary, with the latter due to combined permeability and topography effects and the former only due to permeability. Interestingly, however, both permeable-wall profiles display a clear logarithmic region in these double-averaged profiles, which facilitated the use of a modified Clauser chart method to determine the boundary-layer thickness ( $\unicode[STIX]{x1D6FF}$), friction velocity (
 $u_{\unicode[STIX]{x1D70F}}$) and zero-plane displacement (
 $d$) measured from the base of the permeable walls (Kim et al. Reference Kim, Blois, Best and Christensen2018, Reference Kim, Blois, Best and Christensen2019). With these parameters determined, profiles of the Reynolds normal and shear stresses are presented in figure 3(b–d) for all three wall models. The influence of permeability on the turbulent stresses is notable in the near-wall region when comparing the impermeable and permeable smooth-wall cases (symbol size embodies the uncertainty bounds in the turbulence statistics presented). A reduction in
 $\langle \overline{u^{2}}\rangle ^{+}$ and
 $-\langle \overline{uv}\rangle ^{+}$ is observed in the near-wall region due to the presence of slip and penetration compared to its impermeable, smooth-wall counterpart. The added influence of topography is evident in these turbulence quantities when comparing the permeable rough-wall results with those of the permeable smooth-wall case. In particular, the hemispherical surface topography of the permeable rough wall enhances the near-wall turbulence levels relative to the permeable smooth-wall case. This topographically induced enhancement suggests more efficient turbulent mixing across the permeable interface, likely due to the wakes shed from the individual hemispheres exposed to the surface flow, as noted by Rosti, Cortelezzi & Quadrio (Reference Rosti, Cortelezzi and Quadrio2015). Despite these surface-dependent features of turbulence in the near-wall region, both permeable-wall cases show excellent agreement with the impermeable smooth-wall case in the outer region of the boundary layer. Furthermore, it is noted in figure 3(d) that
 $-\langle \overline{uv}\rangle ^{+}$ decays rapidly to zero within both permeable beds, suggesting a shear penetration depth of less than
 $k$ in both cases (shallower in the smooth permeable case).
As noted above, the friction velocity ( $u_{\unicode[STIX]{x1D70F}}$) was estimated using the modified Clauser chart method (Perry & Li Reference Perry and Li1990). A validation based on the total stress method (Flack, Schultz & Connelly Reference Flack, Schultz and Connelly2007) was also performed, and the difference in
 $u_{\unicode[STIX]{x1D70F}}$ between the two methods was within 5 %. The virtual origin offset (or zero-plane displacement,
 $d$) was estimated simultaneously with
 $u_{\unicode[STIX]{x1D70F}}$ with a best-fitting approach that is often employed in studies of flow overlying complex topographies (Bomminayuni & Stoesser Reference Bomminayuni and Stoesser2011; Chan et al. Reference Chan, MacDonald, Chung, Hutchins and Ooi2015) whereby the location of
 $d$ is adjusted to maximize the linear fit in the log region of the double-averaged streamwise velocity profile (Dixit & Ramesh Reference Dixit and Ramesh2009). The fidelity of this approach was verified in Kim et al. (Reference Kim, Blois, Best and Christensen2019) for the case of flow over an impermeable rough wall formed from hemispheres of identical size and arrangement as that utilized herein. In the current investigation,
 $d$, measured from the actual wall interface (
 $y=0$) is located at an elevation 8.1 mm above this interface for the permeable rough-wall case (i.e. the
 $x{-}z$ plane that intersects the centre of the top layer of spheres of the permeable rough-wall case; see figure 1e). For the permeable smooth-wall case,
 $d$ was zero, meaning that the virtual origin determined in this fashion coincides with the elevation of the smooth interface of this wall model. The boundary-layer thickness (
 $\unicode[STIX]{x1D6FF}$) was determined as the distance from the zero plane (i.e.
 $y-d=0$) to the wall-normal elevation where the double-averaged streamwise velocity profile reached 99 % of the free-stream value. Further details on estimation of the boundary-layer parameters can be found in Kim et al. (Reference Kim, Blois, Best and Christensen2018).
The degree of favourable pressure gradient present in each flow case, a consequence of the constant cross-section of the test section, was quantified by the acceleration parameter,  $K_{a}$, given by
 $$\begin{eqnarray}K_{a}=\frac{\unicode[STIX]{x1D708}}{U_{e}^{2}}\frac{\text{d}U_{e}}{\text{d}x},\end{eqnarray}$$
where  $x$ is the streamwise coordinate. As summarized in table 3, the flow cases considered herein sit in the range
 $5\times 10^{-8}\leqslant K_{a}\leqslant 7.1\times 10^{-8}$. This pressure-gradient condition was classified as mild, as this value is just above the nominally zero-pressure-gradient conditions (
 $K_{a}\leqslant 1.0\times 10^{-8}$) reported by Flack et al. (Reference Flack, Schultz and Connelly2007) in studies of rough-wall turbulence, and is almost two orders of magnitude smaller than that associated with relaminarization of the flow (
 $K_{a}>3.5\times 10^{-6}$; Sreenivasan Reference Sreenivasan1982). Finally, the flow facility utilized for the measurements presented herein did not allow for direct quantification of the permeability (
 $K$), so an estimate was made using the Carman–Kozeny equation (Breugem et al. Reference Breugem, Boersma and Uittenbogaard2006; Voermans et al. Reference Voermans, Ghisalberti and Ivey2017) given by
 $$\begin{eqnarray}K=\frac{\unicode[STIX]{x1D6F7}^{3}}{180(1-\unicode[STIX]{x1D6F7})^{2}}D^{2},\end{eqnarray}$$
where  $D$ is the sphere diameter (25.4 mm herein). This equation gives
 $K=1.47~\text{mm}^{2}$, which yields a permeability
 $Re$ (
 $Re_{K}=u_{\unicode[STIX]{x1D70F}}\sqrt{K}/\unicode[STIX]{x1D708}$) of approximately 50 for both permeable walls.
3.2 Spatial features of surface–subsurface interactions
This section examines qualitatively the flow interactions between the surface and subsurface domains using representative instantaneous velocity fields as well as statistical approaches that highlight dominant flow patterns across the interface. Hereafter, the analysis focuses exclusively on the trough position where these interactions manifest across the simple cubic internal structure of the permeable walls.
Representative instantaneous flow fields for the permeable (a,b) smooth and (c,d) rough cases in the  $x{-}y$ measurement plane. Contour maps of (a,c) instantaneous streamwise velocity (
 $U$) superimposed with instantaneous streamlines and (b,d) corresponding instantaneous streamwise velocity fluctuations with instantaneous, in-plane velocity vectors overlaid (same instantaneous fields as in (a) and (c)). The
 $y$-origin is set at the permeable interface while the dashed lines outline the solid structure of each permeable wall in the measurement plane at the trough position.

The nature of surface–subsurface flow interactions across the smooth and rough permeable interfaces at the trough position can be clearly seen in the representative instantaneous velocity fields presented in figures 4(a) and 4(c), respectively. Here, contours of instantaneous streamwise velocity overlaid with streamlines for both permeable-wall models reveal upwelling and downwelling events through the permeable interfaces that transport pore fluid into the surface flow and surface fluid into the pore flow, respectively. These upwelling and downwelling events correlate well with the occurrence of large-scale flow events in the surface flow as is evident in figures 4(b) and 4(d), which present contours of streamwise velocity fluctuations ( $u$) overlaid with in-plane fluctuating velocity vectors. In particular, the results reported in figures 4(a) and 4(b) for the permeable smooth-wall case reveal the presence of instantaneous upwelling (
 $x/k=6$) and downwelling (
 $x/k=4$) flow events across the wall interface. At these same streamwise positions, large-scale regions of low and high streamwise momentum (
 $u<0$ and
 $u>0$), respectively, are also observed to occur in the surface flow. These observations, which are consistent with previous studies (Breugem et al. Reference Breugem, Boersma and Uittenbogaard2006; Kim et al. Reference Kim, Blois, Best and Christensen2018), suggest a clear link between the passage of large-scale structures in the surface flow and fluid exchange across the interface in the form of sweeps from the surface flow transported into the permeable wall and ejections of pore fluid into the surface flow. The absence of any surface topography in these permeable smooth-wall results indicates that these interactions across the interface are a consequence of wall permeability.
Similar physics is notable in the permeable rough-wall case as presented in figures 4(c) and 4(d). Here, multiple events of upwelling ( $x/k=8$ and 10) and downwelling (
 $x/k=0.5$, 2.5 and 4.5) flow across the permeable interface are noted in this representative instantaneous velocity field, suggesting an enhancement of these interactions due to surface topography. In addition, the intensity of these wall-normal flow motions in the permeable rough-wall case is enhanced compared to those in the smooth-wall case, suggesting that the surface topography of a permeable wall can significantly influence fluid exchange across the permeable interface by strengthening the Reynolds-shear-stress producing upwelling and downwelling events. These events again correlate well with the passage of large-scale regions of low (
 $u<0$) and high (
 $u>0$) streamwise momentum, respectively, in the surface flow. The streamwise extent (
 ${\sim}1{-}3\unicode[STIX]{x1D6FF}$) of these large-scale motions, and their slight inclination away from the wall (
 $10^{\circ }{-}20^{\circ }$), are quite similar to those that drive momentum and energy transport in both impermeable smooth- (Adrian, Meinhart & Tomkins (Reference Adrian, Meinhart and Tomkins2000b), Christensen & Adrian (Reference Christensen and Adrian2001), Ganapathisubramani, Longmire & Marusic (Reference Ganapathisubramani, Longmire and Marusic2003), Natrajan & Christensen (Reference Natrajan and Christensen2006), among others) and rough-wall (Volino, Schultz & Flack Reference Volino, Schultz and Flack2007; Wu & Christensen Reference Wu and Christensen2010, among others) turbulence that are now understood to modulate the amplitude of the near-wall small scales (Mathis et al. Reference Mathis, Hutchins and Marusic2009), with this modulation effect increasing with
 $Re$.
Contour maps of r.m.s. wall-normal velocity at the trough position for the permeable (a) smooth- and (b) rough-wall cases. Black markers indicate a reference point for the conditional events discussed in § 3.3.1.

To further explore the characteristics and intensity of upwelling and downwelling events across the permeable interfaces, figure 5 presents contour maps of root-mean-square (r.m.s.) wall-normal velocity,  $\overline{v}_{rms}^{+}$, at the trough region for the permeable smooth- and rough-wall cases. Spatial patterns consistent with intense vertical exchange of fluid across the permeable interfaces, as observed in the instantaneous velocity fields, are present, particularly below the interface where specific patterns of more intense vertical velocity fluctuations appear immediately upstream of the solid matrix contact points. These patterns are presumably associated with preferential paths of penetrating turbulence across the interface. Comparing these patterns between the two permeable-wall cases at the trough position suggests that the vertical momentum exchange across the wall interface is different both in intensity and pattern for the smooth and rough permeable walls. As shown in figure 5(a), flow penetration into the permeable smooth wall is inclined and originates immediately upstream of the sphere contact points. In contrast, the penetrating flow path for the rough permeable wall (figure 5b) is oriented normal to the wall and the magnitude of
 $\overline{v}_{rms}^{+}$ is higher than the smooth-wall case in both the surface and subsurface flow regions. Since the internal structure of the two permeable walls is identical, these differences in intensity and pattern are attributable to the hemispherical topography of the rough-wall case. Furthermore, this result supports the notion that the surface condition of a permeable wall plays a crucial role in defining how momentum is exchanged across the interface, as reported by Rosti et al. (Reference Rosti, Cortelezzi and Quadrio2015). These simple structural features will be recalled below as guidance for investigating the dynamics the surface–subsurface flow interactions across the permeable walls, particularly the potential existence of amplitude modulation of the flow near and within the permeable walls by larger-scale motions in the surface flow.
3.3 Indirect evidence of amplitude modulation
This section explores the connection between the small-scale turbulence near and within the porous beds and large-scale motions overlying the beds in the surface flow, using various statistical approaches and leveraging the high-resolution, low-frame-rate PIV measurements. Based on the instantaneous and statistical results presented in the previous section, the relationship between upwelling and downwelling events (i.e. those events that drive flow into and out of the permeable walls) and the streamwise velocity fluctuations above the permeable walls that demarcate the passage of large-scale structures was evident. Kim et al. (Reference Kim, Blois, Best and Christensen2018) used conditionally averaged velocity fields obtained for a given local vertical flow event at the permeable interface to demonstrate that upwelling ( $v>0$)/downwelling (
 $v<0$) events at the wall interface are statistically tied to the simultaneous occurrence of large-scale regions of negative/positive streamwise velocity fluctuations, respectively, in the surface-flow region that are highly reminiscent of large-scale motions in impermeable-wall turbulence. In impermeable, smooth-wall turbulence, Hutchins & Marusic (Reference Hutchins and Marusic2007a) reported that small-scale streamwise velocity fluctuations in the near-wall region are more energetic/quiescent under the influence of positive/negative large-scale streamwise velocity fluctuations in the outer layer. This AM of the near-wall, small scales by larger scales in the outer layer was quantified by Mathis et al. (Reference Mathis, Hutchins and Marusic2009). The behaviour of the wall-normal velocity component at the interface of the permeable walls considered herein, particularly its role in transport across the interface, may also be linked to the same phenomenological relationship. In this regard, the link between velocity quantities at the interface (
 $u$, the sign of
 $v$) and the passage of large-scale motions in the surface flow could be indicative of modulation of the small scales near, and within, the permeable walls by outer large-scale motions, similar to that originally found in smooth-wall turbulence (Mathis et al. Reference Mathis, Hutchins and Marusic2009). While the high-frame-rate PIV data will be used to quantify these connected interactions using the AM metrics that were introduced by Mathis et al. (Reference Mathis, Hutchins and Marusic2009) for smooth-wall turbulence, following Efstathiou & Luhar (Reference Efstathiou and Luhar2018), this connection is first explored using unconditional and conditionally averaged profiles of streamwise velocity skewness to infer enhanced/diminished AM effects. Inference of AM effects from velocity skewness was recently suggested, as wall-normal profiles of the AM correlation coefficient proposed by Mathis et al. (Reference Mathis, Hutchins and Marusic2009) show remarkable resemblance to wall-normal profiles of streamwise velocity skewness (Schlatter & Örlü Reference Schlatter and Örlü2010b; Mathis et al. Reference Mathis, Marusic, Hutchins and Sreenivasan2011b). Then, the spatial characteristics of surface–subsurface interactions are explored using conditional averaging of the high-resolution, low-frame-rate PIV data based on the occurrence of upwelling and downwelling events.
3.3.1 Skewness
Following the approach of Efstathiou & Luhar (Reference Efstathiou and Luhar2018), profiles of streamwise velocity skewness ( $\text{Skew}_{u}$) are used to infer the presence of AM effects in the permeable smooth- and rough-wall cases. This analysis is restricted to the low-frame-rate PIV data acquired at the trough position of each wall model as this region of each permeable wall embodies flow interactions across the interface. To explore potential AM effects during upwelling and downwelling processes, the velocity fields for each wall model were separated by upwelling (characterized by
 $v>0$ at the permeable interface) and downwelling (
 $v<0$) events at the interface. The conditional streamwise velocity skewness,
 $\text{Skew}_{u}$, was then calculated for upwelling and downwelling events by first ensemble averaging across the conditional ensembles (one for
 $v>0$ and the other for
 $v<0$) followed by line averaging in the streamwise direction over a limited region of
 $3.6<x/k<5.3$ and
 $3.1<x/k<5.8$ comprising one open pore space along the trough position for the permeable smooth- and rough-wall cases, respectively. The reference point for the conditional event (i.e. discerning between upwelling and downwelling events) was positioned at
 $x_{ref}=4.4k$ and
 $y_{ref}=-0.2k$, as indicated by the black markers in figure 5. This procedure appropriately reflects the impact of upwelling and downwelling events on
 $\text{Skew}_{u}$ across the permeable interface. In addition to these conditionally averaged skewness profiles, the unconditional skewness was also calculated, as was the skewness of the impermeable smooth-wall case, to highlight the effects of permeability.
Wall-normal profiles of unconditional and conditionally averaged streamwise velocity skewness for the permeable (a) smooth- and (b) rough-wall cases. Profiles from the impermeable smooth-wall case and the DNS of Schlatter & Örlü (Reference Schlatter and Örlü2010a) are included for comparison.

Figure 6 presents the unconditional and conditional streamwise velocity skewness profiles for the permeable smooth- and rough-wall cases as well as the impermeable smooth-wall case. As shown in figure 6(a), the impermeable smooth wall  $\text{Skew}_{u}$ shows excellent agreement with the direct numerical simulations (DNS) from Schlatter & Örlü (Reference Schlatter and Örlü2010a) at comparable
 $Re$ (
 $Re_{\unicode[STIX]{x1D703}}\simeq 2540$), validating the measurement protocol used herein as well as the fidelity of the PIV data. The unconditional skewness profile for the permeable smooth-wall case diverges from the baseline impermeable smooth-wall case below
 $(y-d)/\unicode[STIX]{x1D6FF}=0.05$, illustrating that permeability increases near-wall streamwise velocity skewness. Leveraging the intrinsic link between
 $\text{Skew}_{u}$ and AM (Schlatter & Örlü Reference Schlatter and Örlü2010b; Mathis et al. Reference Mathis, Marusic, Hutchins and Sreenivasan2011b), these trends represent further inferential evidence of AM effects in permeable-wall turbulence. In particular, the higher magnitude of unconditional
 $\text{Skew}_{u}$ for the permeable-wall case compared to the impermeable bed suggests that wall permeability enhances this modulating effect, in a similar fashion to that recently observed for impermeable rough-wall flow (Anderson Reference Anderson2016; Pathikonda & Christensen Reference Pathikonda and Christensen2017).
The conditionally averaged  $\text{Skew}_{u}$ profiles for the permeable smooth-wall case diverge from the unconditional one, with the
 $\text{Skew}_{u}$ associated with downwelling flow (linked to the passage of large-scale regions of
 $u>0$ in the surface flow) being higher in magnitude and the
 $\text{Skew}_{u}$ associated with upwelling events being lower in magnitude. This difference persists until
 $(y-d)/\unicode[STIX]{x1D6FF}\simeq 0.6$, after which the conditional
 $\text{Skew}_{u}$ profiles collapse with the unconditional profile. In the context of AM, the higher skewness associated with downwelling events, which occur during the passage of large-scale regions of high streamwise momentum in the surface flow, is entirely consistent with that previously reported for impermeable-wall turbulence where the passage of high-momentum events in the outer layer excites small-scale turbulence in the near-wall region (Chung & McKeon Reference Chung and McKeon2010; Hutchins et al. Reference Hutchins, Monty, Ganapathisubramani, Ng and Marusic2011; Pathikonda & Christensen Reference Pathikonda and Christensen2019). Likewise, the lower skewness associated with upwelling events, which occur during the passage of large-scale regions of low streamwise momentum in the surface flow, is consistent with impermeable-wall turbulence where the passage of low-momentum events in the outer layer suppresses small-scale turbulence in the near-wall region. Zhang & Chernyshenko (Reference Zhang and Chernyshenko2016) interpreted AM of the ‘small’ and ‘fast’ scales near the wall by the ‘large’ and ‘slow’ scales in the outer region in a quasi-steady, quasi-homogeneous manner, with the former responding to the latter as a slow variation in instantaneous
 $Re$. Metzger & Klewicki (Reference Metzger and Klewicki2001) and Mathis et al. (Reference Mathis, Marusic, Hutchins and Sreenivasan2011b) examined the increasing trend displayed by skewness factor with
 $Re$ and noted that this behaviour is consistent with a similar trend of AM and
 $Re$. Thus, as the large-scale motions strengthen with increasing
 $Re$, so do AM effects and skewness. In this regard, the noted deviations between the conditionally averaged
 $\text{Skew}_{u}$ profiles may be due to variation of the local
 $Re$ whereby the passage of large-scale regions of high/low streamwise momentum, associated with downwelling/upwelling events at the interface, results in an increase/decrease of the local
 $Re$.
The permeable rough-wall case (figure 6b) displays a similar behaviour as the permeable smooth-wall case, with downwelling-associated skewness consistently higher than the unconditional and upwelling-associated skewness profiles. Interestingly, unlike the permeable smooth-wall case, where deviation from the impermeable smooth-wall case was noted in the near-wall region, the unconditional skewness for the permeable rough-wall case does not diverge from the baseline smooth impermeable case except in the immediate vicinity of the hemispherical topography where noted peaks are observed in both the unconditional and conditional  $\text{Skew}_{u}$ profiles for the permeable rough-wall case.
3.3.2 POD filtered conditional averages
With the clear linkage between the occurrence of upwelling/downwelling events across the permeable interface with the passage of large-scale regions of low/high streamwise momentum in the surface flow, and the coupled diminished/enhanced AM effect under such conditions, the spatial signatures of these processes are considered further. In order to examine the modulating effect of outer large scales on the small scales near and within the permeable interface for the smooth- and rough-wall cases, a scale decomposition based on POD was employed (Berkooz, Holmes & Lumley Reference Berkooz, Holmes and Lumley1993; Adrian, Christensen & Liu Reference Adrian, Christensen and Liu2000a), followed by conditional averaging based on the occurrence of upwelling and downwelling events. To this end, POD was performed on the permeable smooth- and rough-wall cases for a targeted domain of  $12k\times 3.5k$ (equivalently
 $3.4\unicode[STIX]{x1D6FF}\times 1\unicode[STIX]{x1D6FF}$) and
 $12k\times 5.2k$ (
 $2.6\unicode[STIX]{x1D6FF}\times 1\unicode[STIX]{x1D6FF}$) in the surface-flow region, respectively. One-thousand uncorrelated velocity fields per wall condition from the low-frame-rate PIV data at the trough position were employed in this analysis.
Contour maps of conditionally averaged large-scale (a,e) streamwise ( $u_{L}^{+}$) and (b,f) wall-normal (
 $v_{L}^{+}$) velocities and small-scale r.m.s. (c,g) streamwise (
 $u_{rms,S}^{+}$) and (d,h) wall-normal (
 $v_{rms,S}^{+}$) velocities based on (a–d) upwelling and (e–h) downwelling events for the permeable smooth-wall case. Arrows indicate the sign of the wall-normal velocity events at the interface used to condition the ensembles.

The case of the permeable smooth wall is examined first to isolate the role of wall permeability. Using the relationship between cumulative TKE and POD mode number (not reported herein for brevity), a cutoff filter was set at 60 % of cumulative TKE to decouple the large scales (the first 46 most energetic POD modes) from the small scales (POD modes 47 and up). It should be noted that the analysis presented is rather insensitive to the POD mode cutoff selected to separate the larger and smaller spatial scales. Each instantaneous velocity field in a given conditional ensemble (upwelling/downwelling) was then projected onto the first 46 modes to yield the associated instantaneous, large-scale velocity field. The associated instantaneous, small-scale field was then formed by subtracting this large-scale field from the original one. Conditional averages of the large-scale streamwise and wall-normal velocities and the small-scale streamwise and wall-normal turbulence intensities were computed to explore enhancement/suppression of small-scale turbulence near and within the permeable walls by large-scale motions in the surface flow during downwelling/upwelling events.
Figure 7 presents these conditionally averaged quantities for upwelling and downwelling events for the permeable smooth-wall case. These results confirm that the large-scale streamwise surface flow is always negatively correlated with the large-scale, wall-normal flow at the wall interface, which is consistent with the patterns noted in the instantaneous velocity fields presented in figure 4. Of particular interest, small-scale turbulence activity very close to the wall is excited/suppressed (figures 7g and 7h/7c and 7d) under the action of large-scale regions of positive/negative streamwise velocity fluctuations (figures 7e/7a) associated with downwelling/upwelling (figures 7f/7b) events at the permeable interface. These patterns are entirely consistent with that previously noted in impermeable smooth- and rough-wall turbulence and demonstrate the specific role of the surface-flow large scales in modulating the near-wall small scales linked to upwelling and downwelling motions. Remarkably, just below the wall interface, a similar excitation/suppression of small-scale turbulence persists with the passage of high/low streamwise momentum large scales in the surface flow. This region of enhanced/diminished small-scale turbulence within the permeable smooth wall occurs along the inclined pathway of penetrating flow apparent in the conditionally averaged large-scale wall-normal velocity (figures 7b and 7f) and that identified in figure 5(a). Thus, it appears that AM effects not only occur in the near-surface-flow region, but they also persist within the permeable smooth wall.
As in figure 7, but for the permeable rough-wall case.

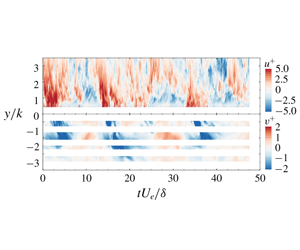
(a,b) Schematics illustrating flow penetration paths for the permeable smooth- and rough-wall cases, respectively, as identified in figure 5. (c,d) Time–height contours of fluctuating streamwise velocity,  $u^{+}(y,t)$, in the surface flow (
 $y/k>0$) and fluctuating wall-normal velocity,
 $v^{+}(y,t)$, in the subsurface flow (
 $y/k<0$) sampled at the streamwise positions noted with vertical red and blue lines in (a,b) for the surface- and subsurface-flow regions, respectively.

The same approach was applied to the permeable rough-wall case wherein the POD analysis indicated that the first thirty most-energetic modes embodied 60 % of the cumulative energy (in contrast to the first 46 POD modes for the permeable smooth-wall case). Figure 8 presents the conditionally averaged large-scale streamwise and wall-normal velocities as well as the small-scale turbulence intensities for the permeable rough-wall case. As with the permeable smooth-wall case, a negative correlation between the large-scale streamwise surface flow and the vertical transport of fluid across the wall interface is noted. Owing to the presence of topography, the large-scale events appear to be larger and more intense. In addition, the large-scale events associated with upwelling/downwelling events at the interface considerably impact the small-scale energy in the vicinity of, and within, the permeable interface by enhancing small-scale activity in both the streamwise and wall-normal velocity components with respect to the occurrence of the low-/high-speed streamwise surface flow. Finally, the enhanced/diminished small-scale activity within the permeable rough wall occurs along the vertically oriented penetrating flow path apparent in the conditionally averaged large-scale wall-normal velocity (figures 8b and 8f) and identified for this wall model in figure 5(b).
3.4 Direct quantification of amplitude modulation
The results presented in the previous section suggest that pore-penetrating turbulence, which contributes to the exchange processes across the permeable interface, is controlled and modulated by the passage of large-scale motions in the surface flow. In fact, this modulating phenomenon appears to extend into the wall, specifically along the preferential paths of the penetrating flow. This section leverages the high-frame-rate PIV measurements to compute quantitative AM metrics for the permeable smooth- and rough-wall cases and to explore the spatio-temporal signatures of these processes.
As noted earlier, each wall model displayed a different characteristic penetrating flow path across the permeable interface (the permeable smooth wall showed an inclined penetration path while the permeable rough wall displayed a vertically oriented path). These penetrating flow paths (schematically illustrated in figures 9a and 9b for the permeable smooth- and rough-wall cases, respectively) are used to guide the temporal probing of the flow using the high-frame-rate PIV data. Figures 9(c) and 9(d) display time–height contours of fluctuating streamwise (surface-flow region,  $y/k>0$) and wall-normal (subsurface-flow region,
 $y/k<0$) velocity extracted from the high-frame-rate PIV data for the permeable smooth- and rough-wall cases, respectively. These time–height fields were constructed by sampling temporal velocity signals for each flow case at fixed streamwise locations (as denoted with lines in figures 9a and 9b). The pore-flow sampling location was shifted
 $0.5k$ downstream of the sampling location for the surface flow to capture the dynamics within the penetrating flow patterns described in figure 5. This offset corresponds to
 $tU_{e}/\unicode[STIX]{x1D6FF}\simeq 0.14$, which is negligible in any variation of the structural characteristics of both the surface and subsurface flows. It should also be noted that, owing to the mask residing along the perimeter of the packing spheres, where excessive optical aberration occurred, the pore flow is only partially presented in figures 9(c) and 9(d).
The time–height fields presented in figures 9(c) and 9(d) confirm the periodic nature of the surface-flow events, which alternate between high and low streamwise momentum, and reveal that this periodicity also occurs within the subsurface flow. In particular, they clearly illustrate that downwelling flow events ( $v<0$) in the subsurface-flow region, transporting fluid deep into the porous domain, occur simultaneously with large-scale regions of high streamwise momentum (
 $u>0$) in the surface flow. The opposite occurs during subsurface upwelling events (
 $v>0$) that transport pore-scale fluid towards the interface, for which large-scale regions of low streamwise momentum (
 $u<0$) occur simultaneously in the surface flow. These plots represent a direct way to visualize these temporal connections and provide additional evidence that substantiates the hypothesis that modulation of the small scales occurs not only in the near-wall region but also within the permeable walls. These time–height contours also reveal that the temporal interactions between the surface and subsurface flows are very different for the permeable smooth- and rough-wall cases. For the permeable rough-wall case (figure 9d), the subsurface flow is characterized by periodic and larger-scale coherent motions that penetrate deep into the porous bed and appear to be in-phase with the surface flow. In contrast, flow over the smooth permeable wall (figure 9c) exhibits significantly reduced penetration depth and flow coherence, although the subsurface vertical motions remain in-phase with the surface flow. This observation highlights the apparent role of surface topography in inducing more intense and more regularized transport of momentum and energy across the permeable interface.
The inner–outer interactions between the large scales in the surface flow and the smaller scales near the wall interface, as well as within the subsurface, can be quantified using various correlation metrics as introduced and discussed by Mathis et al. (Reference Mathis, Hutchins and Marusic2009), Schlatter & Örlü (Reference Schlatter and Örlü2010b), Bernardini & Pirozzoli (Reference Bernardini and Pirozzoli2011) and Eitel-Amor, Örlü & Schlatter (Reference Eitel-Amor, Örlü and Schlatter2014) for wall-bounded turbulence. Mathis et al. (Reference Mathis, Hutchins and Marusic2009), based on time series of streamwise velocity acquired at fixed wall-normal positions in the inner and log regions of the turbulent boundary layer, proposed the correlation
 $$\begin{eqnarray}R^{AM}(y_{2};y_{1})=\frac{\overline{u_{L}(y_{1})E_{L}[u_{s}(y_{2})]}}{\unicode[STIX]{x1D70E}_{u_{L}}(y_{1})\unicode[STIX]{x1D70E}_{E_{L}[u_{s}]}(y_{2})},\end{eqnarray}$$
between the large-scale streamwise velocity  $u_{L}(y_{1})$ (separated from the smaller scales,
 $u_{s}(y_{2})$ via a low-pass filter with a cutoff wavelength comparable to
 $\unicode[STIX]{x1D6FF}$) and the large-scale envelope of the small-scale streamwise velocity
 $E_{L}[u_{s}(y_{2})]$ determined using a Hilbert transform [where
 $\unicode[STIX]{x1D70E}_{(\cdot )}$ denotes the r.m.s. of
 $(\cdot )$]. Mathis et al. (Reference Mathis, Hutchins and Marusic2009) reported two versions of this correlation:
 $R^{AM}(y_{2};y_{1}=y_{2})$, which samples the large scales at the same wall-normal position as the small scales (single-point analysis), and
 $R^{AM}(y_{2};y_{1})$, where the large scales are sampled at a fixed wall-normal position in the outer region,
 $y_{1}$, while the small scales are sampled at all wall-normal positions (two-point analysis). More recently, leveraging whole-field velocity data afforded by computations, Bernardini & Pirozzoli (Reference Bernardini and Pirozzoli2011), Eitel-Amor et al. (Reference Eitel-Amor, Örlü and Schlatter2014) and Dogan et al. (Reference Dogan, Örlü, Gatti, Vinuesa and Schlatter2019) reported full two-dimensional cross-correlations of the form
 $$\begin{eqnarray}R_{\boldsymbol{u}}(y_{1},y_{2})=\frac{\overline{u_{L}(y_{1})E_{L}[\boldsymbol{u}_{s}(y_{2})]}}{\unicode[STIX]{x1D70E}_{u_{L}}(y_{1})\unicode[STIX]{x1D70E}_{E_{L}[\boldsymbol{u}_{s}]}(y_{2})},\end{eqnarray}$$
and
 $$\begin{eqnarray}C_{\boldsymbol{u}}(y_{1},y_{2})=\frac{\overline{u_{L}(y_{1})\boldsymbol{u}_{s}^{2}(y_{2})}}{\unicode[STIX]{x1D70E}_{u_{L}}(y_{1})\unicode[STIX]{x1D70E}_{\boldsymbol{u}_{s}}^{2}(y_{2})},\end{eqnarray}$$
respectively, where  $\boldsymbol{u}=(u,v)$ (the two velocity components resolved in the PIV measurements presented herein), with the latter suggested as an alternative (Schlatter & Örlü Reference Schlatter and Örlü2010b), yet complementary (Mathis et al. Reference Mathis, Marusic, Hutchins and Sreenivasan2011b), AM metric based on the relationship between skewness and amplitude modulation in wall turbulence. It should be noted that
 $R^{AM}$ of Mathis et al. (Reference Mathis, Hutchins and Marusic2009) is a subset of the fully two-dimensional
 $R(y_{1},y_{2})$, with the single-point version of
 $R^{AM}$ being the diagonal of
 $R$ with
 $y_{1}=y_{2}$, while the two-point version of
 $R^{AM}$ represents a profile across
 $R$ for
 $y_{1}=\text{const}$. In the current work, the high-frame-rate planar PIV data acquired simultaneously in the streamwise–wall-normal plane of both the surface and subsurface flows for both permeable smooth- and rough-wall flow are leveraged to compute both
 $R$ and
 $C$ within the
 $y_{1}{-}y_{2}$ plane for the streamwise and wall-normal velocity components. Although previous studies have suggested that scale separation via filtering in the spanwise direction is most effective, particularly at low and moderate
 $Re$ (Bernardini & Pirozzoli Reference Bernardini and Pirozzoli2011; Eitel-Amor et al. Reference Eitel-Amor, Örlü and Schlatter2014; Dogan et al. Reference Dogan, Örlü, Gatti, Vinuesa and Schlatter2019), the current high-frame-rate PIV datasets contain no spatial information in the spanwise direction. Therefore, a temporal filter corresponding to
 $\unicode[STIX]{x1D706}_{c}=\unicode[STIX]{x1D6FF}$ (similar to that employed by Mathis et al. (Reference Mathis, Hutchins and Marusic2009)) is used herein to separate the larger and smaller scales in the streamwise and wall-normal velocity components in the surface-flow region.
Correlation coefficients (a,c,e)  $R_{u}(y_{1},y_{2})$ and (b,d,f)
 $R_{v}(y_{1},y_{2})$ for the permeable (a,b) smooth- and (c,d) rough-wall cases, contrasted with that for (e,f) impermeable smooth-wall flow reproduced from Pathikonda & Christensen (Reference Pathikonda and Christensen2019).

Correlation coefficients (a,c)  $C_{u}(y_{1},y_{2})$ and (b,d)
 $C_{v}(y_{1},y_{2})$ for the permeable (a,b) smooth- and (c,d) rough-wall cases.

The degree of interaction between the outer larger scales and the smaller scales close to the smooth and rough permeable interfaces is first considered in figure 10 from the perspective of  $R_{u}$ and
 $R_{v}$, given by (3.4), for the permeable smooth- and rough-wall cases. These permeable-wall results are contrasted with the same in figures 10(e) and 10(f) for the baseline case of impermeable smooth-wall flow at
 $Re_{\unicode[STIX]{x1D70F}}=1410$ from Pathikonda & Christensen (Reference Pathikonda and Christensen2019), computed from similar high-frame-rate PIV measurements in the same flow facility and with the same filtering methodology utilized herein. As discussed in Bernardini & Pirozzoli (Reference Bernardini and Pirozzoli2011), the imprint of inner–outer interactions can be discerned in this two-dimensional correlation coefficient via strong, off-diagonal, positive correlation values for
 $y_{1}>y_{2}$. All three cases presented in figure 10 embody this imprint of AM effects in both the streamwise and wall-normal velocity components, highlighting the clear presence of amplitude modulation of the near-wall smaller scales by the outer, larger scales. Of note, the magnitude of this correlation for
 $y_{1}>y_{2}$ is larger in both permeable-wall cases compared to the baseline impermeable-wall flow in both
 $R_{u}$ and
 $R_{v}$, meaning that the large-scale motions overlying these permeable walls have a stronger modulating effect on the small-scale turbulence very close to both permeable interfaces, as compared to the baseline impermeable-wall flow. This distinction suggests that wall permeability enhances the AM phenomenon, as inferred earlier from indirect measures of the same effect (streamwise velocity skewness and conditional averaging). The permeable rough-wall results, particularly for
 $R_{u}$, suggest that the coupling of permeability with surface topography further increases the AM effect, likely because the large-scale motions along the trough position exhibit enhanced coherence due to the effects of roughness-formed channelling (Kim et al. Reference Kim, Blois, Best and Christensen2018, Reference Kim, Blois, Best and Christensen2019). An additional source for this enhancement could be the more regular shedding of smaller-scale structures from the hemispherical roughness elements of the permeable rough wall. Thus, the enhanced coherence of the large-scale motions and additional small scales shed from the permeable rough wall may be responsible for inducing a stronger AM effect as compared to the permeable smooth-wall case.
A similar trend is noted in figure 11 which presents  $C_{u}$ and
 $C_{v}$, given by (3.5), for the permeable smooth- and rough-wall cases (Pathikonda & Christensen (Reference Pathikonda and Christensen2019) did not report
 $C$ for impermeable smooth-wall flow). As discussed in Eitel-Amor et al. (Reference Eitel-Amor, Örlü and Schlatter2014) and Dogan et al. (Reference Dogan, Örlü, Gatti, Vinuesa and Schlatter2019), this two-dimensional correlation coefficient in the
 $y_{1}{-}y_{2}$ plane also reveals the presence of AM effects via strong, off-diagonal, positive correlation values for
 $y_{1}>y_{2}$. In contrast to
 $R$,
 $C$ leverages the link between the skewness and AM effects as previously reported by Schlatter & Örlü (Reference Schlatter and Örlü2010b) and Mathis et al. (Reference Mathis, Marusic, Hutchins and Sreenivasan2011b), whereby the overall skewness can be reconstructed from various combinations of
 $u_{L}$ and
 $u_{s}$, with the specific cross-correlation term between
 $u_{L}$ and
 $u_{s}^{2}$ providing an alternative diagnostic for identifying AM of the near-wall smaller scales by the outer, larger scales. Here we extend this concept to both the streamwise and wall-normal velocity components through
 $C_{u}$ and
 $C_{v}$, similar to that reported in Blackman & Perret (Reference Blackman and Perret2016) for a turbulent boundary layer overlying an array of cubes. Both the permeable smooth- and rough-wall cases show strong, off-diagonal, positive correlation magnitudes for
 $y_{1}>y_{2}$, reflecting the noted influence of the outer larger scales on the smaller scales near the permeable interface. As was observed in
 $R$, the permeable rough-wall
 $C_{u}$ and
 $C_{v}$ metrics show higher correlation magnitudes, indicating that these inner–outer interactions are stronger in the presence of topography for flow over a permeable interface.
With the existence of AM effects clearly established in the region just above the smooth and rough permeable walls, the possibility of AM effects penetrating within the permeable walls is considered. To do so, space–time correlations between the large scales in the surface flow and the small scales in the subsurface-flow region were computed. In this case, the large scales were sampled at fixed outer locations of  $(y-d)/\unicode[STIX]{x1D6FF}=0.06$ and 0.05 for the permeable smooth- and rough-wall cases (horizontal dashed lines in figures 9c and 9d), respectively, while the temporal signals of the pore flow were acquired along the vertical blue lines illustrated in figures 9(a) and 9(b). A different spectral filter size was required to properly decompose the large and small scales in the subsurface flow. The present subsurface flow travelling along the trough side is dominated by a channelling effect with a periodic acceleration and deceleration at each pore (Horton & Pokrajac Reference Horton and Pokrajac2009; Manes et al. Reference Manes, Pokrajac, McEwan and Nikora2009; Kim et al. Reference Kim, Blois, Best and Christensen2018). Thus, the dominant length scale of the subsurface flow is smaller than that of the surface flow, so a quarter of the boundary-layer thickness, which is approximately half the size of the packing sphere diameter, was used as the cutoff wavelength (
 $\unicode[STIX]{x1D706}_{c}=0.25\unicode[STIX]{x1D6FF}$) in the spectral filter, whereas the filter size for the large-scale surface flow remained identical (
 $\unicode[STIX]{x1D706}_{c}=\unicode[STIX]{x1D6FF}$).
AM correlation maps between the small-scale (a,b) streamwise and (c,d) wall-normal subsurface velocities and the large-scale surface flows for the permeable (a,c) smooth- and (b,d) rough-wall cases. Black dashed line demarcates  $R=0.3$ iso-contour level.

Figure 12 presents AM correlation maps in the space–time domain illustrating AM of the small-scale subsurface flow by the large scales in the surface flow. Remarkably, these results suggest that AM effects extend deep into the subsurface-flow region, as conjectured earlier via indirect measures of this effect. Figure 12 also highlights that, for both permeable walls, the modulation occurs mainly along the penetrating flow paths of upwelling and downwelling flow and progressively vanishes deep into the wall as the small-scale turbulence decays. Further, these results suggest that the interfacial topography plays a role in defining the penetration depth of the AM effect. To highlight this behaviour, an iso-contour line in these correlations is highlighted as a black dashed-line for a value of  $R=0.3$. By doing so, two distinct regions of high correlation, separated by a relatively narrow band of lower correlation, are identified. For the permeable smooth-wall case, these regions are labelled
 $S_{u}^{\prime }/S_{v}^{\prime }$ and
 $S_{u}^{\prime \prime }/S_{v}^{\prime \prime }$ for the streamwise/wall-normal velocity component (figures 12a and 12c), where
 $S_{u}^{\prime }$ and
 $S_{v}^{\prime }$ are located near the interface (
 $-0.5<y/k<0$), while
 $S_{u}^{\prime \prime }$ and
 $S_{v}^{\prime \prime }$ are located deeper in the permeable bed (
 $-2<y/k<-1.4$). Of note, these two regions of strong correlation occur at different times relative to the passage of a large-scale event in the surface flow at zero time delay. While
 $S_{u}^{\prime }$ and
 $S_{v}^{\prime }$ reveal an AM penetration depth of about
 $0.5{-}0.6k$ that is temporally in-phase with the passage of a large-scale motion in the surface flow at zero time lag (
 $\unicode[STIX]{x1D70F}U_{e}/\unicode[STIX]{x1D6FF}=0$),
 $S_{u}^{\prime \prime }$ and
 $S_{v}^{\prime \prime }$ are positioned at
 $\unicode[STIX]{x1D70F}U_{e}/\unicode[STIX]{x1D6FF}=-1.6$, suggesting that the flow at
 $y/k\simeq -1.5$ is only weakly correlated to the penetrating flow at
 $\unicode[STIX]{x1D70F}U_{e}/\unicode[STIX]{x1D6FF}=0$, but more strongly correlated to the penetrating flow occurring earlier in time at an upstream location. The permeable rough-wall correlations (figures 12b and 12d) exhibit several fundamental differences with their smooth-wall counterparts. First, the primary high-correlation regions,
 $R_{u}^{\prime }$
 $R_{v}^{\prime }$, are notably larger and extend deeper into the bed (
 $-1<y/k<0$), revealing an AM penetration depth of approximately
 $k$. Moreover, the secondary correlations,
 $R_{u}^{\prime \prime }$ and
 $R_{v}^{\prime \prime }$, which are smaller in spatial extent, reside deeper in the bed near
 $y/k=-2.5$ and are centred at positive time delays. This latter observation suggests that these AM effects occur after the passage of the large-scale motion in the surface flow at zero time delay, meaning that it is correlated to a large-scale event that sits downstream at the time of the subsurface excitation. Thus, these results indicate that, due to enhanced flow penetration induced by surface topography, the permeable rough-wall case exhibits more intense and deeper penetration of AM effects compared to the smooth-wall case.
3.5 Conditional averaging based on zero-crossing events
Due to the rich spatio-temporal information of the surface and subsurface flows embodied in the high-frame-rate PIV measurements, the aforementioned modulating effect can also be explored using conditional averaging of the large- and small-scale spatial signatures captured within the PIV FOVs. The conditional event utilized herein is given by zero crossings of the large-scale velocity fluctuations in a space–time domain. Unlike the conditional averaging by POD (figure 7) or the AM correlation coefficients (figures 10, 11 and 12), the advantage of the zero-crossing conditional event in this study is that it simultaneously reveals the spatial characteristics of the modulating effect along with its temporal evolution.
The concept of this conditional averaging approach was first employed by Baars et al. (Reference Baars, Talluru, Hutchins and Marusic2015) to decompose the large- and small-scale fluctuating energies for wall-bounded turbulence. Although this work was based on point measurements by leveraging Taylor’s hypothesis, unique features for the modulating phenomenon were successfully revealed. A similar approach was also used with LES data of turbulent channel flow to reconstruct large-scale coherent regions interacting with small-scale turbulence (Chung & McKeon Reference Chung and McKeon2010). Recently, the zero-crossing conditional averaging was extended to high-frame-rate PIV data by Pathikonda & Christensen (Reference Pathikonda and Christensen2019) to capture directly the spatio-temporal signature of the large- and small-scale interactions (without the need for Taylor’s hypothesis reconstruction) in a smooth-wall TBL. In the present work, a similar approach was utilized to give a clear picture of AM effects in a space–time domain for the flow overlying the two permeable walls.
Time series of large-scale streamwise velocity,  $u_{L}$, were used to define the events for conditional averaging and were extracted at the same sampling point,
 $\boldsymbol{x}_{ref}=(x_{ref},y_{ref})$, as that used in the calculation of the AM correlation coefficients. The spectral cutoff filter (
 $\unicode[STIX]{x1D706}_{c}=\unicode[STIX]{x1D6FF}$) was applied to obtain the large scales from the given time series at the reference point. Following Pathikonda & Christensen (Reference Pathikonda and Christensen2019), positive zero crossings in
 $u_{L}$ were utilized as the conditional event for this analysis. Following Pathikonda & Christensen (Reference Pathikonda and Christensen2019), identifying the temporal instances
 $\unicode[STIX]{x1D70F}_{ref^{+}}^{i}$ (where
 $i$ refers to the
 $i$th identified zero-crossing event, the ‘+’ denotes the positive zero crossing and
 $\unicode[STIX]{x1D70F}=tU_{e}/\unicode[STIX]{x1D6FF}$ herein) as the
 $u_{L}$ crosses from negative to positive in the absolute time (
 $t$), the conditional events are given by
 $$\begin{eqnarray}u_{L}(\unicode[STIX]{x1D70F}_{ref^{+}})\equiv u_{L}(x_{ref},y_{ref},\unicode[STIX]{x1D70F}_{ref^{+}})=0,\end{eqnarray}$$
and
 $$\begin{eqnarray}\frac{\text{d}u_{L}}{\text{d}t}(x_{ref},y_{ref},\unicode[STIX]{x1D70F}_{ref^{+}})>0.\end{eqnarray}$$
The velocity fields associated with these zero-crossing events in both the sFOV and pFOV were formed by collecting the velocity fields as
 $$\begin{eqnarray}[\boldsymbol{u}|_{+}(x,y,\unicode[STIX]{x1D70F})]^{i}=[\boldsymbol{u}(x,y,\unicode[STIX]{x1D70F}_{ref^{+}}+\unicode[STIX]{x1D70F})]^{i},\end{eqnarray}$$
where  $[\cdot ]^{i}$ denotes an ensemble. The
 $[\boldsymbol{u}|_{+}(x,y,\unicode[STIX]{x1D70F})]$ ensembles were formed around the positive zero crossing at
 $\unicode[STIX]{x1D70F}_{ref^{+}}$ over an interval
 $\pm 2.5\unicode[STIX]{x1D70F}$ (where
 $\unicode[STIX]{x1D70F}=tU_{e}/\unicode[STIX]{x1D6FF}$). Applying this process to the permeable smooth- and rough-wall datasets yielded 323 and 279 positive zero-crossing events, respectively, and these ensembles were employed in the conditional averages at each
 $\unicode[STIX]{x1D70F}$.
Representative time series of large-scale (a) streamwise ( $u_{L}^{+}$) and (b) wall-normal (
 $v_{L}^{+}$) velocity extracted at
 $y_{ref}/\unicode[STIX]{x1D6FF}\simeq 0.06$ for the permeable smooth-wall case. All identified positive zero-crossing points (
 $\unicode[STIX]{x1D70F}_{ref^{+}}$; red circles) and three example neighbourhoods of width
 $\pm 2.5\unicode[STIX]{x1D70F}$ (where
 $\unicode[STIX]{x1D70F}=tU_{e}/\unicode[STIX]{x1D6FF}$) (red lines) are identified.

Figures 13(a) and 13(b) present representative time series of large-scale streamwise and wall-normal velocity fluctuations, respectively, from the permeable smooth-wall case, acquired at the aforementioned reference point  $(x_{ref},y_{ref})$. Of all positive
 $u_{L}$ zero crossings demarcated by the red circles in figure 13(a), three examples are highlighted with solid red lines demarcating the temporal neighbourhoods [
 $-2.5tU_{e}/\unicode[STIX]{x1D6FF}$,
 $2.5tU_{e}/\unicode[STIX]{x1D6FF}$] around each positive zero crossing. Each identified
 $u_{L}$ event embodies a local minimum and local maximum that correlates well with a local upwelling (local maximum in
 $v_{L}^{+}$) and local downwelling (local minimum in
 $v_{L}^{+}$) event in the time series of
 $v_{L}$ (figure 13b). Thus, this conditional averaging approach resolves a characteristic signature of the penetrating flow across the wall interface, allowing a better understanding of the spatial structure of the transporting fluid and its resulting influence on the near-wall and subsurface small-scale turbulence in the transitional layer of the permeable walls. As discussed in Pathikonda & Christensen (Reference Pathikonda and Christensen2019), there are instances when identified positive zero-crossing neighbourhoods overlap. Such occurrences were rather rare (∼5 %) and occurred in two neighbourhoods at most. Thus, no exceptions were made for these instances. Finally, while positive zero crossings are utilized herein to identify large-scale conditional events for averaging, this analysis could be performed using negative zero crossings in
 $u_{L}$, which yields an equivalent result simply shifted in time relative to the positive zero-crossing result (Pathikonda & Christensen Reference Pathikonda and Christensen2019).
To explore the temporal variation of small-scale turbulent kinetic energy immediately above and within the permeable walls under the influence of the large scales in the surface flow via conditional averaging, the small-scale velocity field at each instance was decoupled and the corresponding TKE variables were formed as
 $$\begin{eqnarray}\displaystyle & \displaystyle \langle \boldsymbol{u}|_{+}\rangle _{L}=\langle \boldsymbol{u}|_{+}\rangle ^{i}, & \displaystyle\end{eqnarray}$$
 $$\begin{eqnarray}\displaystyle & \displaystyle [\boldsymbol{u}|_{+}]_{s}^{i}=[\boldsymbol{u}|_{+}]^{i}-\langle \boldsymbol{u}|_{+}\rangle _{L}, & \displaystyle\end{eqnarray}$$
 $$\begin{eqnarray}\displaystyle & \displaystyle \langle \text{TKE}|_{+}\rangle _{s}^{i}={\textstyle \frac{1}{2}}\langle \boldsymbol{u}|_{+}^{2}\rangle _{s}^{i}, & \displaystyle\end{eqnarray}$$
and
 $$\begin{eqnarray}\unicode[STIX]{x1D6E5}\langle \text{TKE}|_{+}\rangle _{s}^{i}=\langle \text{TKE}|_{+}\rangle _{s}^{i}-\langle \text{TKE}|_{+}\rangle _{s,\unicode[STIX]{x1D70F}}^{i},\end{eqnarray}$$
where  $\langle \cdot \rangle ^{i}$ indicates an ensemble average over all temporal instances and
 $\langle \cdot \rangle _{\unicode[STIX]{x1D70F}}^{i}$ refers to ensemble averaging and time averaging to obtain unconditional quantities. Here, TKE denotes a surrogate TKE formed from
 $u$ and
 $v$ owing to the planar, two-component velocity data acquired in the
 $x{-}y$ plane. The small-scale TKE discrepancy,
 $\unicode[STIX]{x1D6E5}\langle \text{TKE}|_{+}\rangle _{s}^{i}$, is also considered herein to better highlight the variation in the small-scale TKE relative to its unconditional ensemble average. Thus, this TKE discrepancy is a spatio-temporal measure of the energy surplus or deficit from the nominal TKE value depending on enhancement/suppression via AM effects by the passage of high/low streamwise momentum events in the surface flow.
Contour maps of (a–c) large-scale streamwise,  $\langle u|_{+}\rangle$, (above the wall) and wall-normal
 $\langle v|_{+}\rangle$ (below the wall) velocity, (d–f) small-scale TKE,
 $\langle \text{TKE}|_{+}\rangle _{s}$ (above and within the wall) and (g–i) small-scale TKE discrepancy,
 $\unicode[STIX]{x1D6E5}\langle \text{TKE}|_{+}\rangle _{s}$ (zoomed in around the permeable interface) for the permeable smooth-wall case at three temporal instances:
 $\unicode[STIX]{x1D70F}=-0.76$, 0, and 0.76. The dashed lines demarcate the solid structure in the measurement plane at the trough position.

As in figure 14, but for the permeable rough-wall case at three temporal instances:  $\unicode[STIX]{x1D70F}=-1.12$, 0 and
 $1.12$.

The temporal evolution of  $\langle u|_{+}\rangle _{L}$ (above the wall) and
 $\langle v|_{+}\rangle _{L}$ (within the wall) as well as
 $\langle \text{TKE}|_{+}\rangle _{s}$ and
 $\unicode[STIX]{x1D6E5}\langle \text{TKE}|_{+}\rangle _{s}$ above and within the permeable smooth and rough walls are shown in figures 14 and 15, respectively, at three temporal instances. These results highlight the mutual interplay between the large-scale surface and subsurface flows and the modulating effect of the large scales upon the small scales in the vicinity of, and within, each permeable wall. The
 $\langle u|_{+}\rangle _{L}$ contour maps in the surface flow for both wall cases are marked by the passage of large-scale, inclined regions of low (
 $\langle u|_{+}\rangle _{L}<0$) and high (
 $\langle u|_{+}\rangle _{L}>0$) streamwise momentum that are spatially correlated with upwelling (
 $\langle v|_{+}\rangle _{L}>0$) and downwelling (
 $\langle v|_{+}\rangle _{L}<0$) events across each permeable wall. These patterns are entirely consistent with those identified in the instantaneous velocity fields presented in figure 4 as well as via POD filtering and conditional averaging based on the occurrence of upwelling and downwelling events in figures 7 and 8. However, the results shown in figures 14 and 15 provide more comprehensive spatio-temporal views of these interactions, including how the small-scale TKE just above, and within, the permeable walls evolve with the passage of large-scale structures in the surface flow, particularly during the transition from a large-scale region of low streamwise momentum to a high-momentum region with increasing time. During this transition, large-scale upwelling flow is followed by downwelling flow across the permeable interfaces (evident in
 $\langle v|_{+}\rangle _{L}$). Under the influence of these large-scale structures in the surface flow, the small-scale TKE,
 $\langle \text{TKE}|_{+}\rangle _{s}$, is subjected to a modulation effect, revealing suppression (negative
 $\unicode[STIX]{x1D70F}$) followed by excitation (positive
 $\unicode[STIX]{x1D70F}$) of small-scale turbulence close to the wall for both permeable cases (figures 14d–f and 15d–f). This excitation/suppression phenomena is quite reminiscent of the POD filtered and conditionally averaged results shown in figures 7 and 8 from the temporally uncorrelated, low-frame-rate PIV data. The corresponding small-scale TKE discrepancy further highlights this modulating effect with respect to the passage of large scales in the surface flow. In particular, a small-scale energy deficit is noted under the influence of a large-scale region of low streamwise momentum (negative
 $\unicode[STIX]{x1D70F}$) and a small-scale energy surplus is noted with the passage of a high streamwise momentum event (positive
 $\unicode[STIX]{x1D70F}$), all relative to its mean value for both permeable wall cases. Remarkably, as first identified in the POD filtered conditional averaging results in figures 7 and 8, these plots of small-scale TKE discrepancy in figures 14 and 15 again indicate that the modulating influence of large scales in the surface flow on the small-scale turbulence extends into the permeable walls, with small-scale energy deficit/surplus below the permeable interface with the passage of large-scale low/high streamwise momentum events in the surface flow.
Taken together, these results provide substantial evidence of AM effects in turbulent flow overlying a permeable wall and provide the first direct evidence that these AM effects not only exist in the near-wall region (as has been previously identified in studies of impermeable-wall turbulence) but also extend into the permeable wall through penetrating flow across the permeable interface. The imprint of this modulation effect is more clearly discerned in the permeable rough-wall case, likely because wall permeability accompanied by surface topography induces a more pronounced penetrating flow, allowing more intense vertical exchange of flow between the surface and subsurface regions compared to that of the permeable smooth-wall case.
4 Summary
Low- and high-frame-rate PIV measurements were conducted to investigate the potential existence of a modulating mechanism linking the large scales populating the turbulent flow overlying a permeable wall to the small-scale fluctuations both near the wall and within the subsurface flow. To achieve these aims, two idealized walls with identical grain packing and porosity but different interfacial topography (smooth and rough) were used to isolate the role of permeability and highlight the role of added interfacial roughness, respectively. Through the use of indirect and, more importantly, direct quantitative observations, the present results establish, for the first time, the exact relationship between large-scale motions in the overlying flow and small-scale motions just above, and within, the permeable walls. These results confirm the existence of a robust linkage between the near-wall surface flow and the vertical transport of fluid across the permeable interface, which was first reported by Breugem et al. (Reference Breugem, Boersma and Uittenbogaard2006). In addition, POD filtering and conditional averaging of temporally uncorrelated PIV velocity fields, time series of instantaneous streamwise and wall-normal velocity and AM correlation coefficients identified a clear relationship between outer large scales of high ( $u>0$) and low (
 $u<0$) momentum, downwelling/upwelling across the permeable interface and excitement/suppression of small-scale turbulence, respectively. Importantly, these dynamics occur not only just above the permeable walls, but also deep within them. Figure 16 provides a conceptual summary of these surface–subsurface flow interactions.
Schematic diagram summarizing surface–subsurface flow interactions in permeable-wall turbulence as revealed by the results presented herein.

These results are the first to report standard AM metrics, previously proposed and established for impermeable-wall turbulence (e.g. Mathis et al. Reference Mathis, Hutchins and Marusic2009; Pathikonda & Christensen Reference Pathikonda and Christensen2017) for permeable walls. These metrics confirm previous indirect observations of AM effects in permeable-wall turbulence reported by Efstathiou & Luhar (Reference Efstathiou and Luhar2018). In addition, the analysis reported herein elucidates quantitatively such relationships in permeable-wall turbulence. These results indicate that permeability enhances the AM effect and that the coexistence of permeability and surface topography leads to a further increase in the AM phenomenon. These observations, which previously were based on Taylor’s hypothesis and its resulting temporal correlations, were further explored by using zero-crossing conditional averaging with high-frame-rate PIV data (Pathikonda & Christensen Reference Pathikonda and Christensen2019). Spatial signatures of the large- and small-scale energy were reconstructed by leveraging the zero-conditioned ensembles of velocity fields that do not require Taylor’s hypothesis. The temporal evolution of these structures clearly captured the prevailing effect of amplitude modulation across the transitional layer of the current permeable walls. Furthermore, the imprint of this modulation effect is more clearly captured in the spatial character for the case of the permeable rough wall, resulting from enhanced vertical exchange of flow by the surface topography. The fact that  $-\langle \overline{uv}\rangle ^{+}$ quickly decayed to zero within both permeable beds (figure 3d) suggests that the turbulent velocity fluctuations in the subsurface flow are ‘inactive’ in the sense that they do not contribute to turbulent mixing. This observation, coupled with that argued by Breugem et al. (Reference Breugem, Boersma and Uittenbogaard2006) that subsurface turbulence is driven by large-scale pressure fluctuations in the surface flow, suggests that AM of the subsurface flow may be driven by these large-scale pressure fluctuations at the interface that are generated by the passage of large-scale motions in the log region of the surface flow. Measurements of pressure fluctuations at the interface were not possible in the present experiments, and thus confirmation of this possibility requires further study.
In quantifying the presence and nature of amplitude modulation in permeable-wall turbulence, the results detailed herein are critical to the development and validation of near-wall modelling efforts. Similar to the predictive inner–outer model proposed by Mathis, Hutchins & Marusic (Reference Mathis, Hutchins and Marusic2011a) for smooth-wall TBLs, the present results provide a framework for enhanced modelling of flow in the transitional layer of permeable walls. Knowledge of such surface–subsurface flow interactions is central to a better understanding of the transport of particulates, pollutants, nutrients and gases within a range of natural and industrial flow environments.
Acknowledgements
This research was supported by the National Science Foundation through grant CBET-1236527 and the University of Notre Dame. The authors thank Dr G. Pathikonda for sharing impermeable, smooth-wall data for the comparisons made in figure 10. The authors also thank the reviewers for their insightful questions and comments that have greatly improved the manuscript.
Declaration of interests
The authors report no conflict of interest.



