





Introduction
Upland cotton and soybean are among the most important row crops in North Carolina and the southeastern United States, with cotton covering more than 166,000 ha and soybean more than 648,000 ha in 2024, together contributing substantially to the agricultural economy of North Carolina and the southeastern United States (USDA–NASS 2025). However, weed interference continues to be one of the primary threats to sustainable production of these crops. Herbicide-resistant weeds have become widespread across the region, which severely limits the effectiveness of herbicides that rely on a single site of action (Jones et al. Reference Jones, Andres, Owen, Dunne, Contreras, Cahoon, Jennings, Leon and Everman2023; Mahoney et al. Reference Mahoney, Jordan, Roma-Burgos, Jennings, Leon, Vann, Everman and Cahoon2020; Poirier et al. Reference Poirier, York, Jordan, Chandi, Everman and Whitaker2014). Herbicides are categorized into groups by the Weed Science Society of America according to their mechanism of action. In recent years, several weed populations in North Carolina have been documented to exhibit resistance to inhibitors of 5-enolpyruvylshikimate-3-phosphate synthase (EPSPS) (e.g., glyphosate, Group 9), acetolactate synthase (ALS; Group 2), protoporphyrinogen oxidase (PPO; Group 14), 4-hydroxphenypyruvatedioxygenase (HPPD; Group 27), photosystem II (PS II; Group 5), and acetyl-CoA carboxylase (ACCase; Group 1). Resistance to glufosinate (Group 10) has also been documented, but no weed resistance to auxin herbicides (Group 4)has been confirmed in North Carolina thus far (Heap Reference Heap2025).
In North Carolina, Palmer amaranth is the top-ranked common and most troublesome weed in both cotton and soybean production, followed by annual grasses such as goosegrass [Eleusine indica (L.) Gaertn.], large crabgrass [Digitaria sanguinalis (L.) Scop.], barnyardgrass [Echinochloa crus-galli (L.) P. Beauv.], and foxtail species (Setaria spp.); and several broadleaf species including pitted morningglory (Ipomoea lacunosa L.) and ivyleaf morningglory (I. hederacea Jacq.) (Van Wychen Reference Van Wychen2022), all of which can rapidly reduce yield and complicate harvest. Given that Palmer amaranth also has the greatest number of confirmed herbicide-resistant populations in North Carolina across multiple site of action, the diversity of effective herbicide options has narrowed for this species. The Enlist crops are resistant to 2,4-D, glufosinate, and glyphosate. Therefore, they offer a timely postemergence option for cotton and soybean growers, particularly because no auxin (Group 4) resistance has been detected in the state (Heap Reference Heap2025).
Adoption of Enlist cotton and soybean has increased rapidly across the United States as growers seek effective alternatives to control weeds that are resistant to glyphosate and PPO inhibitors (Werle et al. Reference Werle, Mobli, Striegel, Arneson, DeWerff, Brown and Oliveira2022), particularly amid regulatory uncertainty and restrictions on dicamba applications to dicamba-resistant soybean and cotton. Large-scale evaluations have further shown that 2,4-D applications, when used in accordance with product label guidelines, result in minimal off-target movement and little or no injury to nearby susceptible soybeans (Kruger et al. Reference Kruger, Alves, Schroeder, Golus, Reynolds, Dodds, Brown, Fritz and Hoffmann2023; Werle et al. Reference Werle, Mobli, Striegel, Arneson, DeWerff, Brown and Oliveira2022), making this an effective postemergence herbicide. At the same time, research on Enlist E3 soybean has demonstrated that crop yield and profitability are maximized when residual preemergence herbicides are combined with postemergence herbicides and applied sequentially to control common waterhemp [Amaranthus tuberculatus (Moq.) J. D. Sauer] and common lambsquarters (Chenopodium album L.) (Singh et al. Reference Singh, Miller, Peters, Naeve and Sarangi2025). These findings highlight both the advantages of adopting Enlist systems and the importance of evaluating complete preemergence and postemergence programs under local conditions. In North Carolina, where Palmer amaranth, morningglory species, and annual grasses dominate, field comparisons of Enlist-based programs remain scarce. Therefore, evaluating those programs is both timely and necessary.
Residual preemergence and early postemergence herbicides are essential for suppressing early emerging cohorts, to reduce early crop-weed competition, and to protect yield (Liu et al. Reference Liu, Kumar and Lambert2020; Lopes Ovejero et al. Reference Lopes Ovejero, Soares, Oliveira, Fonseca, Berger, Soteres and Christoffoleti2013; Singh et al. Reference Singh, Miller, Peters, Naeve and Sarangi2025), but herbicides applied late postemergence are still needed to control escapes and late-emerging cohorts, thereby reducing seedbank replenishment and preventing long-term population growth (Kaur et al. Reference Kaur, Rogers, Lawrence, Shi, Chahal, Knezevic and Jhala2024; Oreja et al. Reference Oreja, Hare, Jordan and Leon2023, Reference Oreja, Mahoney, Jordan, Jennings, Vann and Leon2025). Across soybean and corn systems, sequential applications (e.g., preemergence followed by postemergence) have repeatedly outperformed single-pass approaches for season-long control and for reducing weed seed production (Kaur et al. Reference Kaur, Rogers, Lawrence, Shi, Chahal, Knezevic and Jhala2024; Liu et al. Reference Liu, Kumar and Lambert2020; Lopes Ovejero et al. Reference Lopes Ovejero, Soares, Oliveira, Fonseca, Berger, Soteres and Christoffoleti2013; Oreja et al. Reference Oreja, Hare, Jordan and Leon2023, Reference Oreja, Mahoney, Jordan, Jennings, Vann and Leon2025; Singh et al. Reference Singh, Miller, Peters, Naeve and Sarangi2025), which is key for resistance management (Bagavathiannan and Norsworthy Reference Bagavathiannan and Norsworthy2012).
Although the value of sequential preemergence and postemergence applications is well established, less is known about how auxinic herbicides such as 2,4-D affect flexibility in postemergence application timing within complete herbicide programs in cotton and soybean. Auxin herbicides can reduce regrowth and seed production even when plants survive treatment, which may improve control of later-emerging cohorts and help limit seedbank replenishment (Kaur et al. Reference Kaur, Rogers, Lawrence, Shi, Chahal, Knezevic and Jhala2024; Bagavathiannan and Norsworthy Reference Bagavathiannan and Norsworthy2012). In addition, cotton and soybean differ in canopy architecture and rate of canopy closure, which can influence how the same herbicide application sequences perform by altering crop competitiveness and the duration of weed suppression (Oreja et al. Reference Oreja, Hare, Jordan and Leon2023). For these reasons, evaluating complete preemergence-postemergence herbicide application sequences in Enlist cotton and soybean under North Carolina conditions is important for better understanding how postemergence timing and crop system affect late-season weed control and yield protection.
The response to identical herbicide programs may also differ between cotton and soybean because of differences in canopy architecture and crop growth rate. Soybean typically develops canopy cover more rapidly than cotton, which may enhance suppression of later-emerging weeds and complement postemergence herbicide activity, whereas the wider row spacing and slower canopy closure of cotton may increase reliance on late postemergence applications to maintain weed control (Oreja et al. Reference Oreja, Hare, Jordan and Leon2023). These crop-specific differences suggest that the contribution of auxin-based postemergence treatments to overall program performance may vary between the two systems.
Therefore, the objective of this study was to evaluate the efficacy of Enlist-based herbicide programs with different preemergence and postemergence herbicide application timings for weed control and yield protection in cotton and soybean, and to determine whether herbicide program performance differed between the two crop systems.
Materials and Methods
Field experiments were conducted in eastern North Carolina to evaluate the effectiveness of herbicide programs for weed control and to assess yield of cotton and soybean. Three experiments were conducted at the Upper Coastal Plain Research Station near Rocky Mount (35.87°N, 77.68°W), and one experiment at the Peanut Belt Research Station near Lewiston-Woodville (36.12°N, 77.17°W). The Rocky Mount site was characterized as an Aycock very fine sandy loam (fine silty, siliceous, subactive, thermic Typic Paleudult), whereas the Lewiston–Woodville site was a Norfolk sandy loam (fine-loamy, siliceous, thermic Typic Paleudult). At Lewiston-Woodville, one field was used each year. At Rocky Mount, three fields were used in 2019 and one field in 2020; therefore, results were summarized at the site-year level (i.e., location × year), with individual fields considered replicates within each environment. Trials were arranged as a randomized complete block design with four replications, including both crops (cotton, soybean) and parallel herbicide program sequences to enable direct crop by herbicide program comparisons. Individual plots consisted of four rows measuring 9.1 m in length. Plot width varied according to crop row spacing, averaging approximately 3.6 m. Herbicide treatments and data collection were restricted to the center two rows to minimize edge effects. The Rocky Mount site had glyphosate-resistant Palmer amaranth, ivyleaf morningglory (I. hederacea Jacq.), and annual grasses including broadleaf signalgrass [Urochloa platyphylla (Munro ex C. Wright) R.D. Webster], with densities at the first postemergence application timing ranging from 6 to 20, 2 to 15, 3 to 11, and 5 to 40 plants m⁻2, respectively, in nontreated plots. The Lewiston–Woodville site exhibited primarily ivyleaf morningglory (8 to 25 plants m⁻2), and Texas panicum (Panicum texanum Buckley) (11 to 30 plants m⁻2). Cotton variety PHY340W3FE (Corteva Agriscience, Indianapolis, IN) was planted in 91-cm rows at both locations (target density 15 plants m⁻1 of row). Enlist soybean (Pioneer, relative maturity 5.3; Corteva) was planted for a target population of 296,000 plants ha⁻1. In Rocky Mount soybean seed was drilled in 19-cm rows, and in Lewiston-Woodville seed was planted in twin rows (paired rows 23 cm apart on 91-cm centers). Fields were prepared with conventional tillage comprised of two passes with a disk harrow followed by one pass with a field cultivator. For cotton only, raised beds were prepared after primary tillage with in-row sub-soiling.
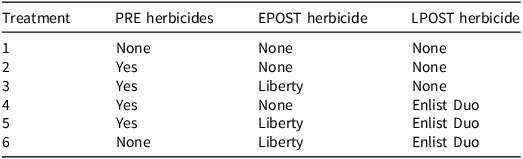
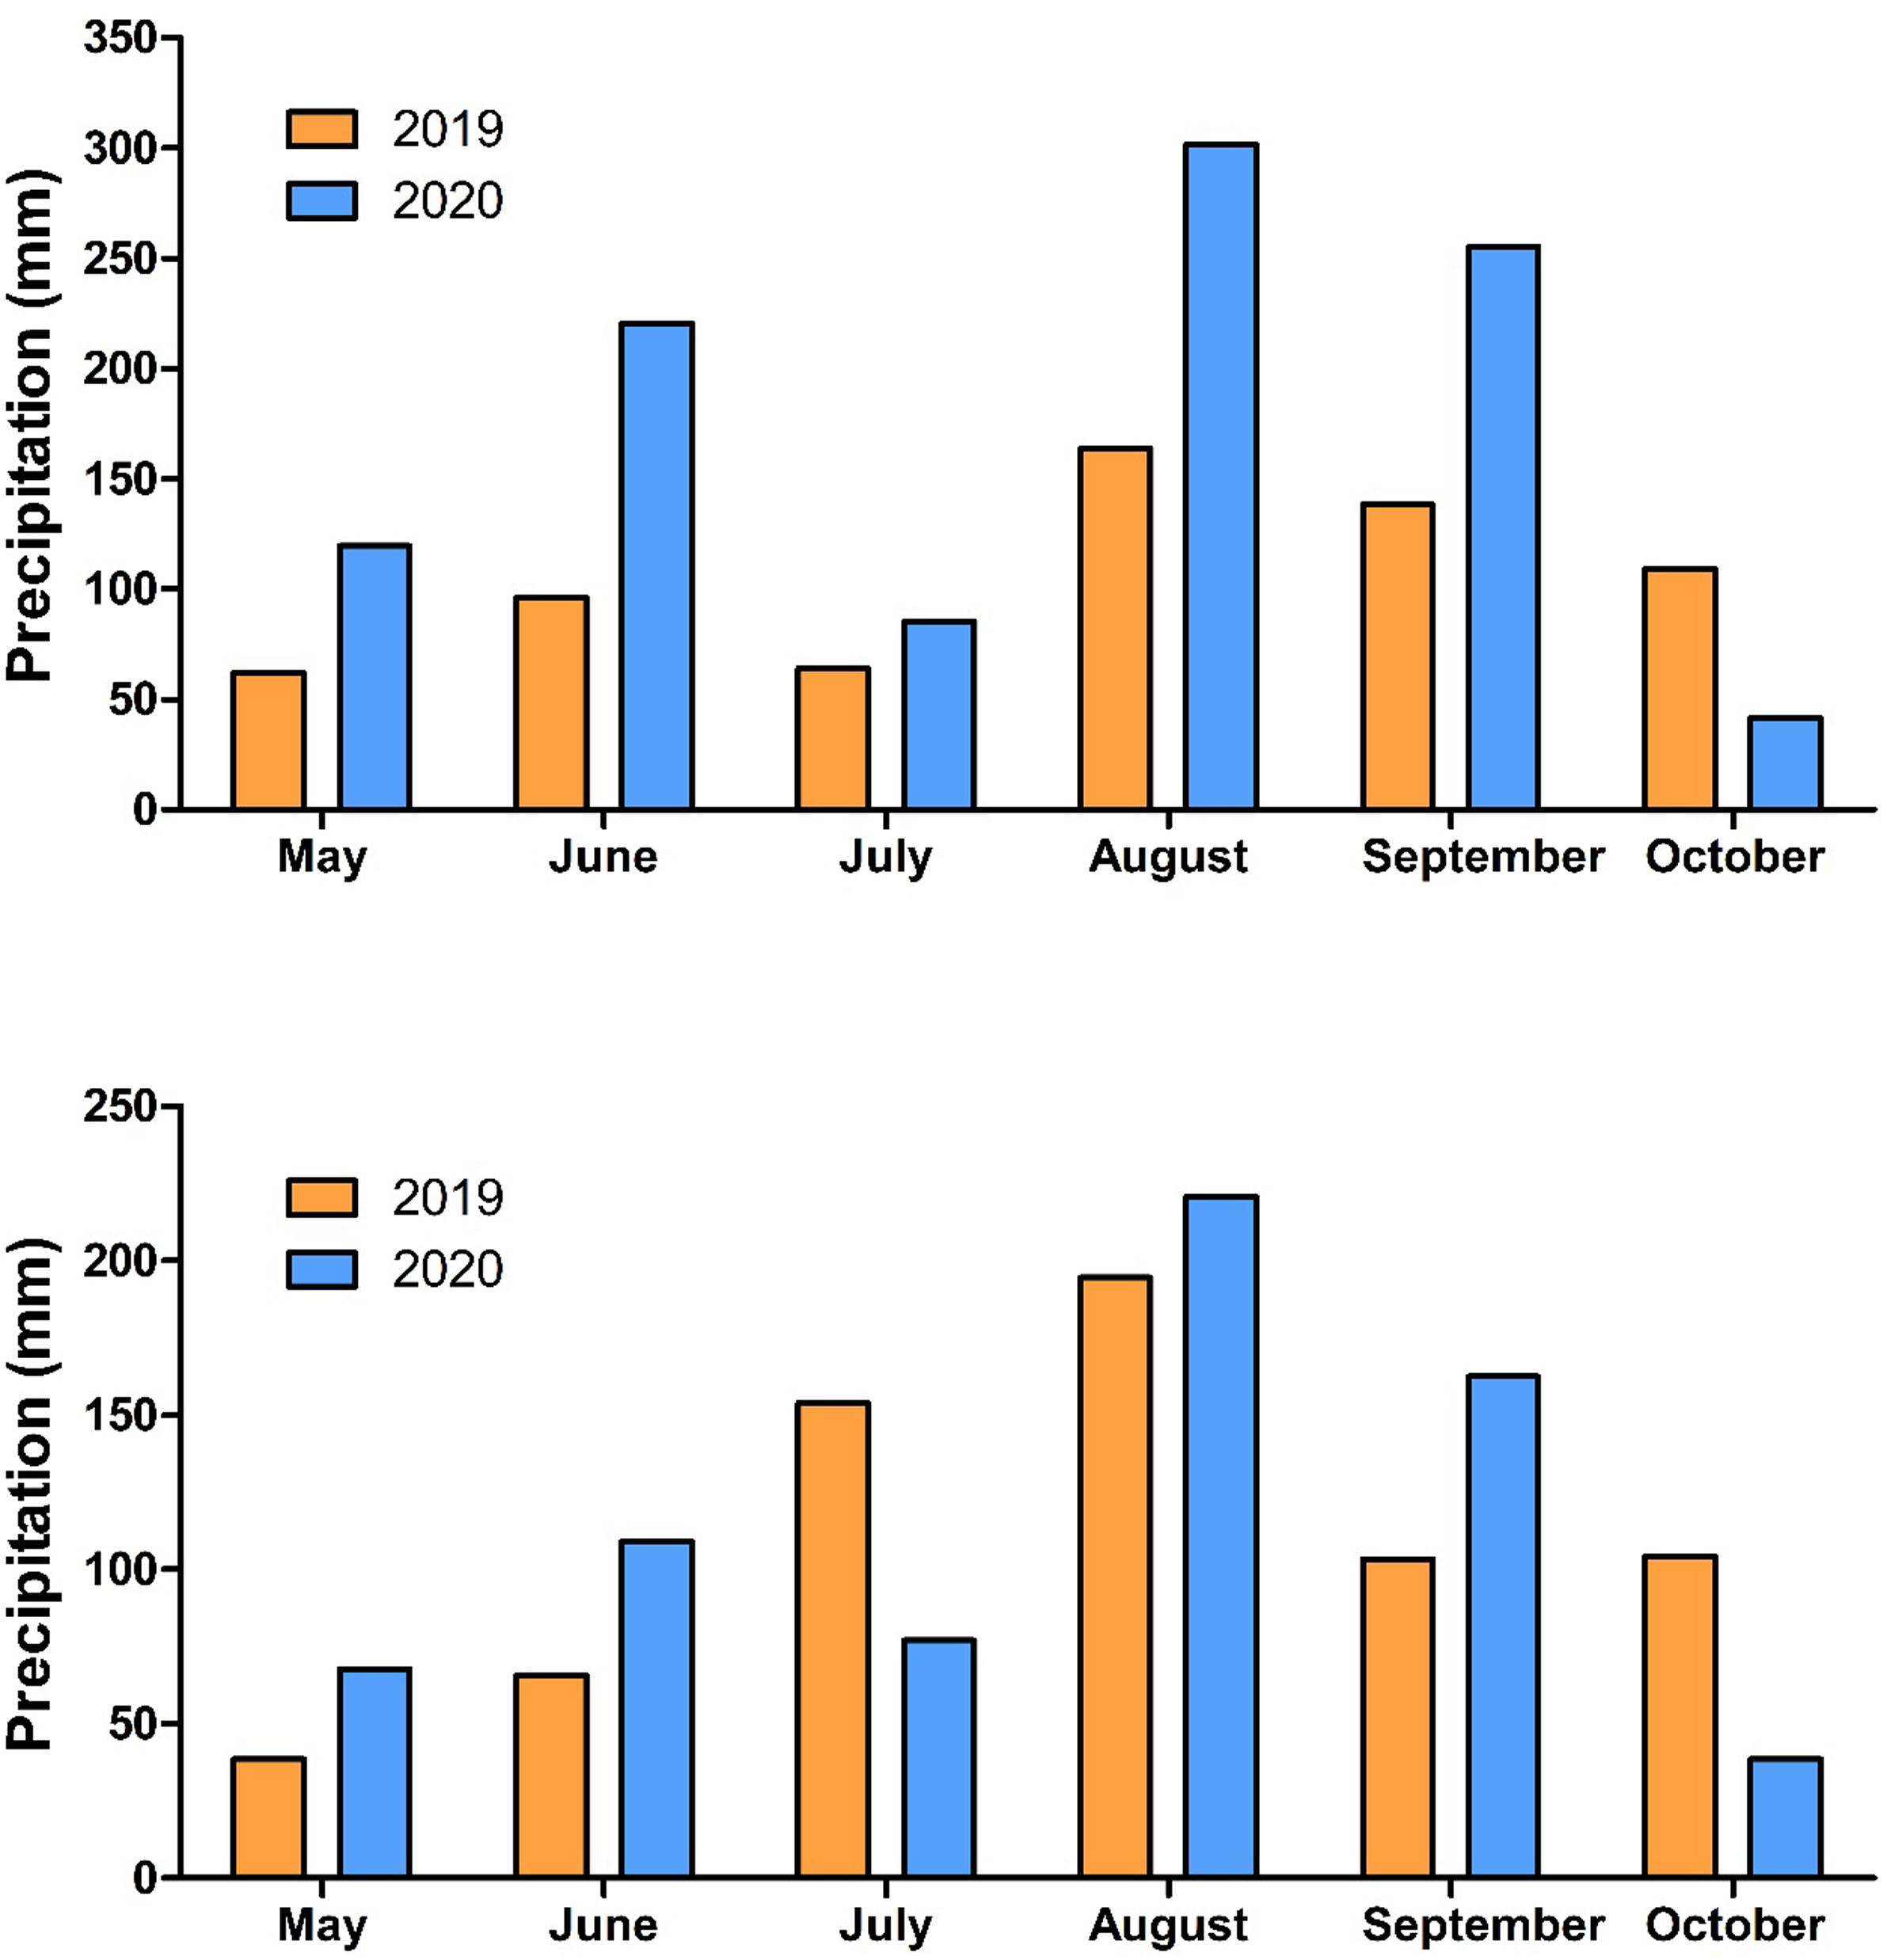
The experiment consisted of six herbicide programs (Table 1), evaluated in both cotton and soybean. The herbicides applied preemergence emergence consisted of fomesafen (Reflex; 240 g ai L⁻1) at 578 to 770 g ai ha⁻1 and acetochlor (Warrant; 352 g ai L⁻1) at 828 to 1,240 g ai ha⁻1, applied at planting. Rate ranges were used to accommodate product label recommendations for different soil textures and organic matter content across field sites. Glufosinate (Liberty, 280 g ai L⁻1; BASF Corporation, Research Triangle Park, NC) was applied postemergence at 578 g ai ha⁻1 (2.06 L ha⁻1) 2 to 3 wk after planting (WAP), and 2,4-D + glyphosate (Enlist Duo, 240 + 240 g ae L⁻1; Corteva) was applied postemergence at 1,334 g ae ha⁻1 of each herbicide 4 to 5 WAP. A nonionic surfactant at 250 mL L⁻1 was included as a spray additive in postemergence applications, according to label recommendations. Herbicides were applied using a CO2-pressurized backpack sprayer, 11002VS nozzle for all herbicide applications, except for 2,4-D plus glyphosate. These herbicides were applied using a Turbo TeeJet TTI 02 Induction nozzle (TeeJet Technologies, Glendale Heights IL). The equipment was calibrated to obtain an application volume of 145 L ha⁻1 at a pressure of 270 kPa and 5 km h⁻1 speed. Daily precipitation at each site was obtained from weather stations present on site (NC ECONet, https://econet.climate.ncsu.edu/) and summarized to monthly totals for May to October of each year (Figure 1). Average monthly temperatures during the growing season were generally similar to long-term historical averages at both locations.

Table 1. Long description
A table comparing six herbicide programs for cotton and soybean. The table has six rows and three columns. The columns are labeled PRE herbicides, EPOST herbicide, and LPOST herbicide. The rows are labeled with treatment numbers from 1 to 6. Row 1: PRE herbicides, None; EPOST herbicide, None; LPOST herbicide, None. Row 2: PRE herbicides, Yes; EPOST herbicide, None; LPOST herbicide, None. Row 3: PRE herbicides, Yes; EPOST herbicide, Liberty; LPOST herbicide, None. Row 4: PRE herbicides, Yes; EPOST herbicide, None; LPOST herbicide, Enlist Duo. Row 5: PRE herbicides, Yes; EPOST herbicide, Liberty; LPOST herbicide, Enlist Duo. Row 6: PRE herbicides, None; EPOST herbicide, Liberty; LPOST herbicide, Enlist Duo.
a Abbreviations: EPOST, early postemergence; LPOST, late postemergence; PRE, preemergence.
b PRE herbicides consisted of fomesafen (578–770 g ai ha⁻1) + acetochlor (828–1,240 g ai ha⁻1), the EPOST herbicide was glufosinate (578 g ai ha⁻1), and the LPOST herbicide was 2,4-D + glyphosate (1,334 g ae ha⁻1 each).
c Rates varied according to soil texture and organic matter following label recommendations. At Rocky Mount, fomesafen was applied at 578 g ai ha⁻1 and acetochlor at 828 g ai ha⁻1, whereas at Lewiston–Woodville rates were 770 g ai ha⁻1 and 1,240 g ai ha⁻1, respectively.
d Herbicide manufacturers: Enlist Duo, Corteva Agriscience, Research Triangle Park, NC; Liberty, BASF Corporation, Research Triangle Park, NC.
Total monthly precipitation (mm) from May to October 2019 and 2020 at Rocky Mount (upper panel) and Lewiston–Woodville (lower panel), North Carolina. Bars show monthly totals by year. Data were obtained from the nearest NC ECONet stations to each site.

Weed control was visually evaluated at 7 to 8 WAP using a 0% to 100% scale, where 0% = no control and 100% = all weeds are dead or absent, with the plot exhibiting the least control within each block, which was assigned 0% control. Foliar chlorosis, necrosis, plant stunting, and reduction in plant population were considered when assessing control. Control ratings were made relative to the nontreated plots within each block, which consistently exhibited substantial weed populations at the time of evaluation; therefore, by considering variation in weed pressure among blocks, ratings provided a more accurate estimation of control than a field-wide reference weed density. The lowest-control plot was often, but not always, the no-herbicide treatment; therefore, some no-herbicide plots could have control values slightly higher than 0%. Scores reflected the combined effects of herbicide program and crop weed suppression. All weed control assessments were carried out by the same evaluator to ensure consistency.
After crop harvest, yield from each plot was converted to relative yield (%) within each environment (location × year × crop) using the weed-free (preemergence + early postemergence + late postemergence) check as the benchmark. Specifically, relative yield was calculated as (plot yield ÷ mean yield of the preemergence + early postemergence + late postemergence treatment in that environment) × 100. The preemergence + early postemergence + late postemergence treatment was used as the weed-free reference because it consistently provided near-complete weed control across environments. This standardization made it possible to compare yields across environments while avoiding deflation from single-plot maxima and allowing a direct comparison of herbicide programs for both cotton and soybean.
Statistical Analysis
Because the same herbicide programs were evaluated in both cotton and soybean, the experiment was analyzed as a factorial arrangement of crop and herbicide program. Crop, herbicide program, location, and year were treated as fixed effects in the global model. Control ratings were analyzed using generalized linear models (binomial family, logit link) at the plot level. Overdispersion was assessed and, when present, a quasi-binomial variance function was used. Because relative yield is a bounded percentage (0% to 100%) and diagnostics indicated deviations from normality and heteroscedasticity in some environments, we analyzed relative yield with the aligned rank transform (ART) for factorial designs. The parallel treatment structure across crops allowed formal evaluation of crop, herbicide program, and crop by herbicide program effects on relative yield. A global ART model with fixed effects of location, year, crop, treatment, and all interactions was fitted; because treatment interacted significantly with environmental factors, inference for relative yield was then made within each environment (year × crop × location) using one-way ART models with treatment as the sole effect. For multiple comparisons, estimated marginal means were compared using a Tukey adjustment (α = 0.05) and summarized with compact letter displays. For presentation, arithmetic means ± SE of relative yield are reported for each treatment within each environment. Analyses were conducted with R software (v. 4.4.2; R Core Team 2024) using ARTool v0.11.2, emmeans v1.11.0, and multcompView v0.1.10 functions; generalized mixed models used base stats v4.4.2.
Results and Discussion
Overall, the growing season (May to October) was wetter in 2020 than in 2019. At Rocky Mount, rain totals were 1,024 mm (2020) and 633 mm (2019), with much a wetter May-to-June period in 2020 than in 2019 (120–220 mm vs. 62–96 mm), and at Lewiston-Woodville totals were similar (676 vs. 660 mm), the but months of May and June were also wetter in 2020 (175 vs. 105 mm) (Figure 1).
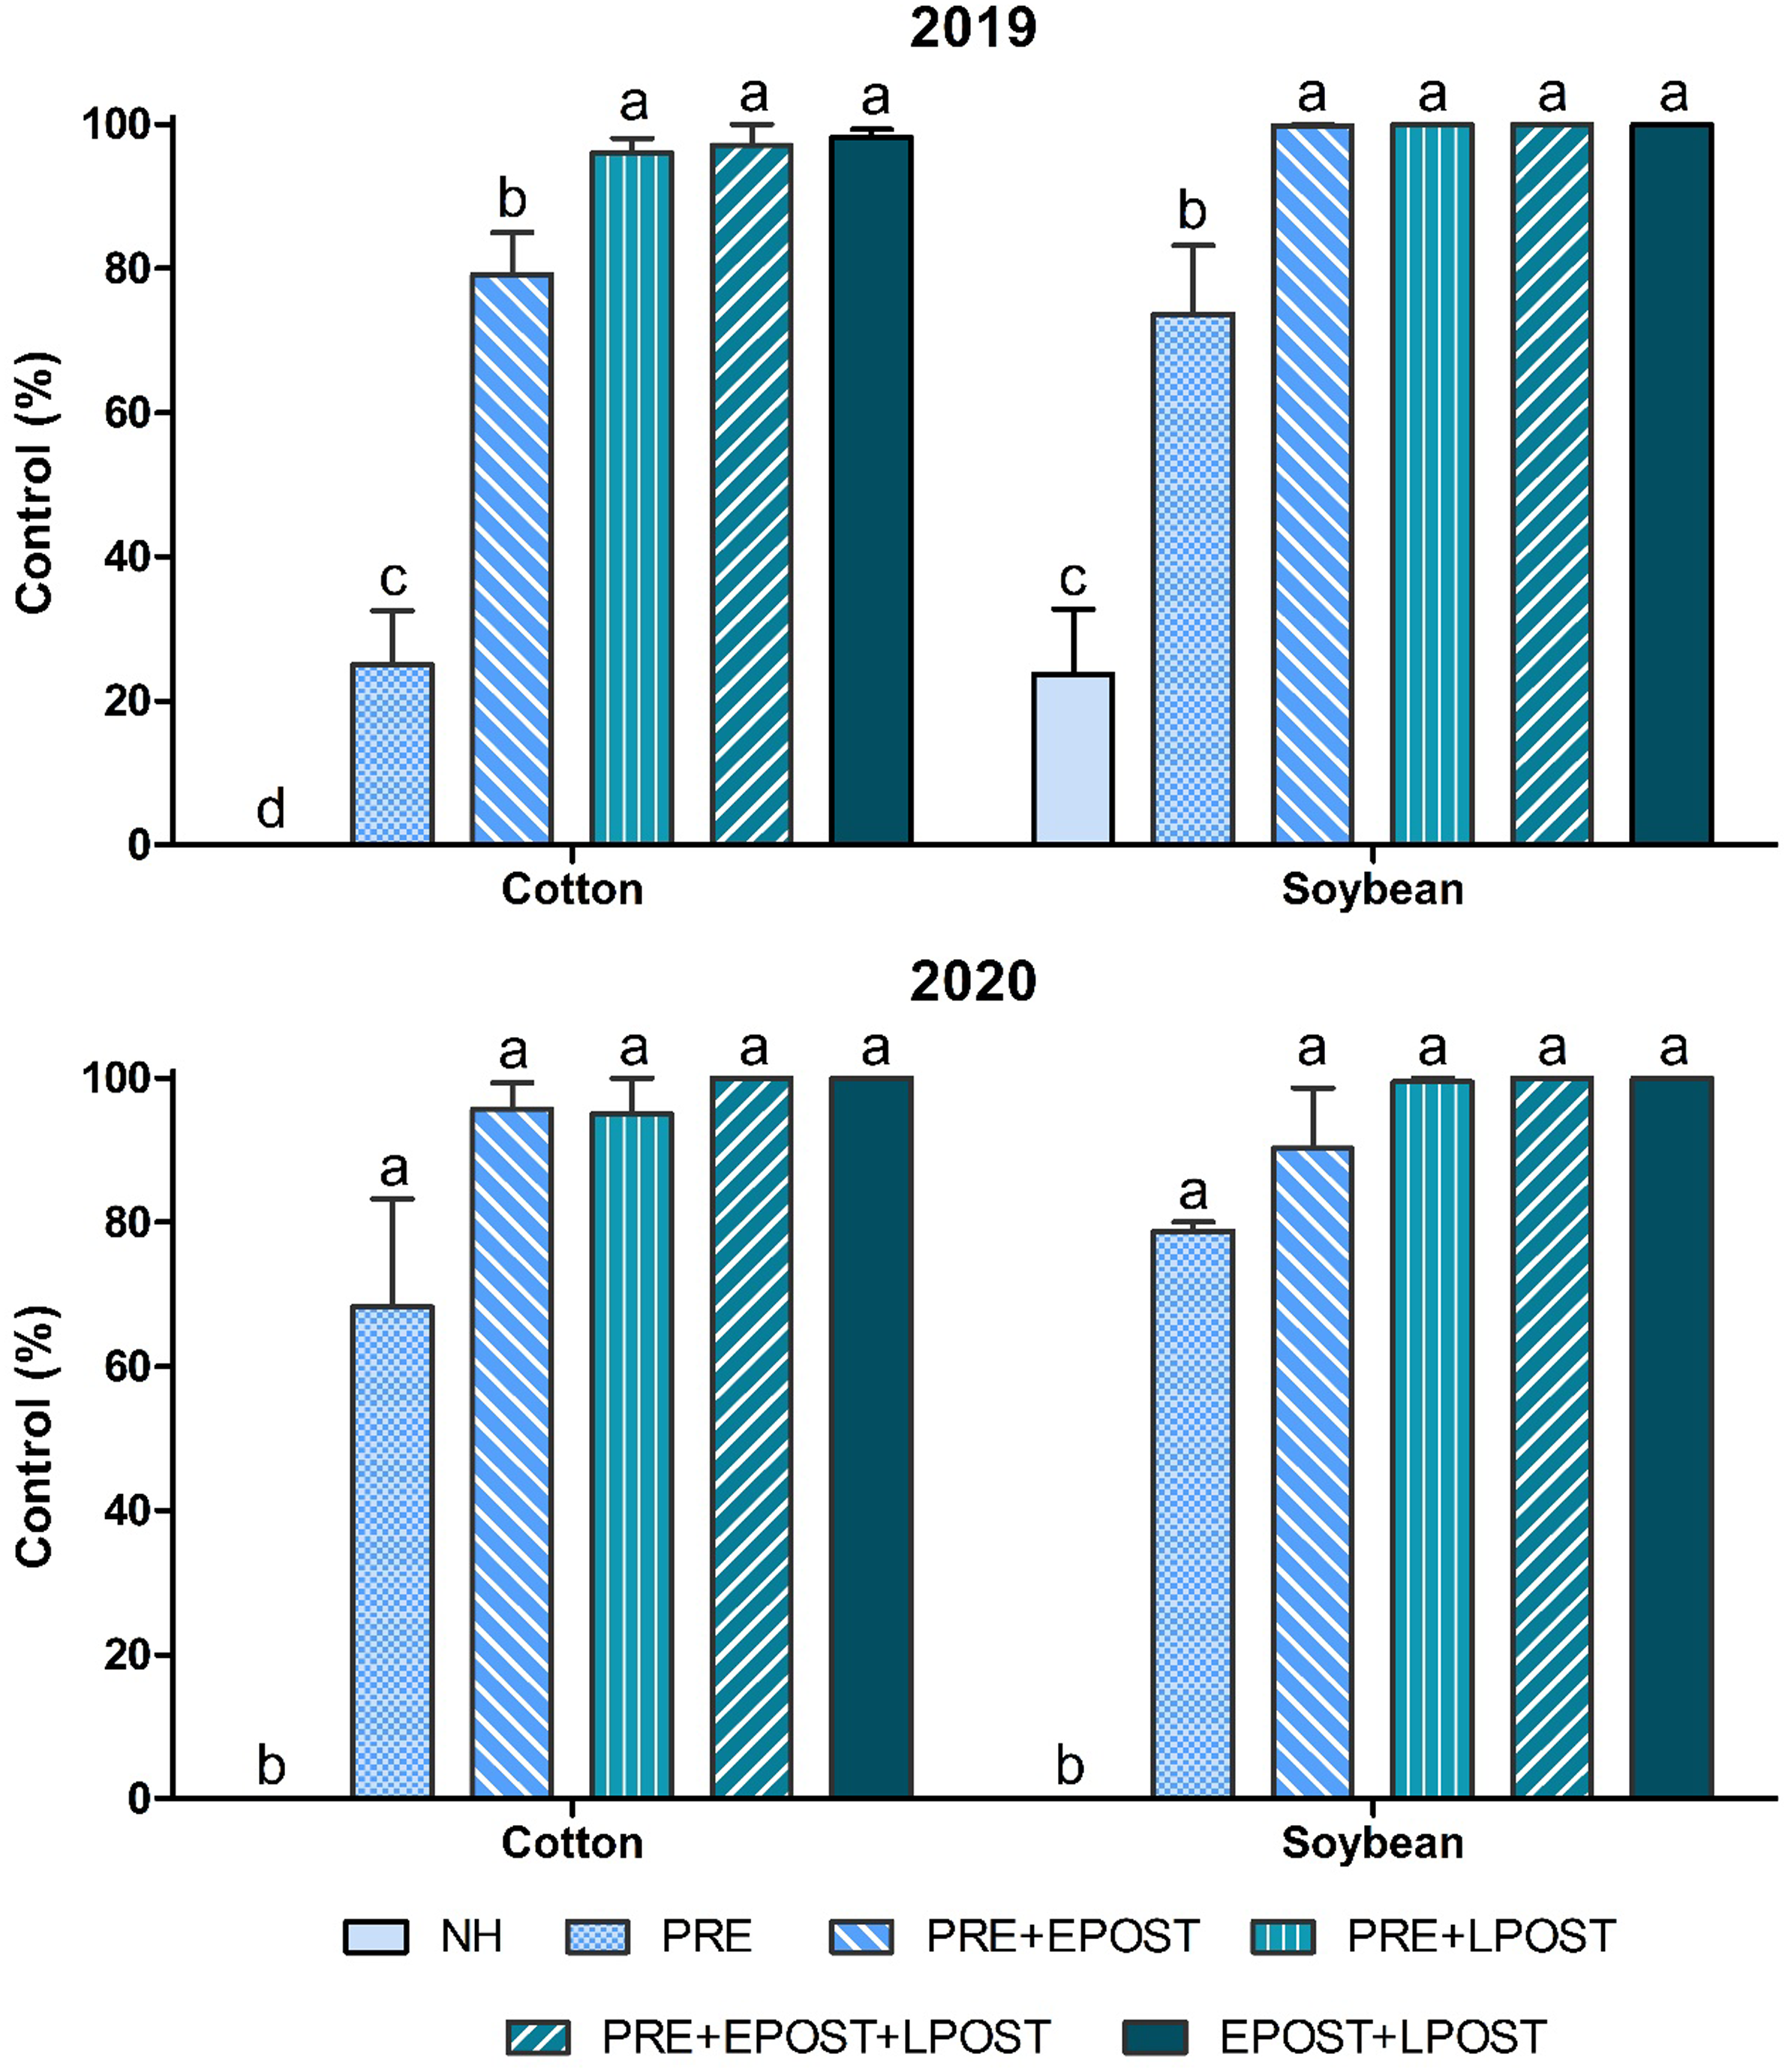
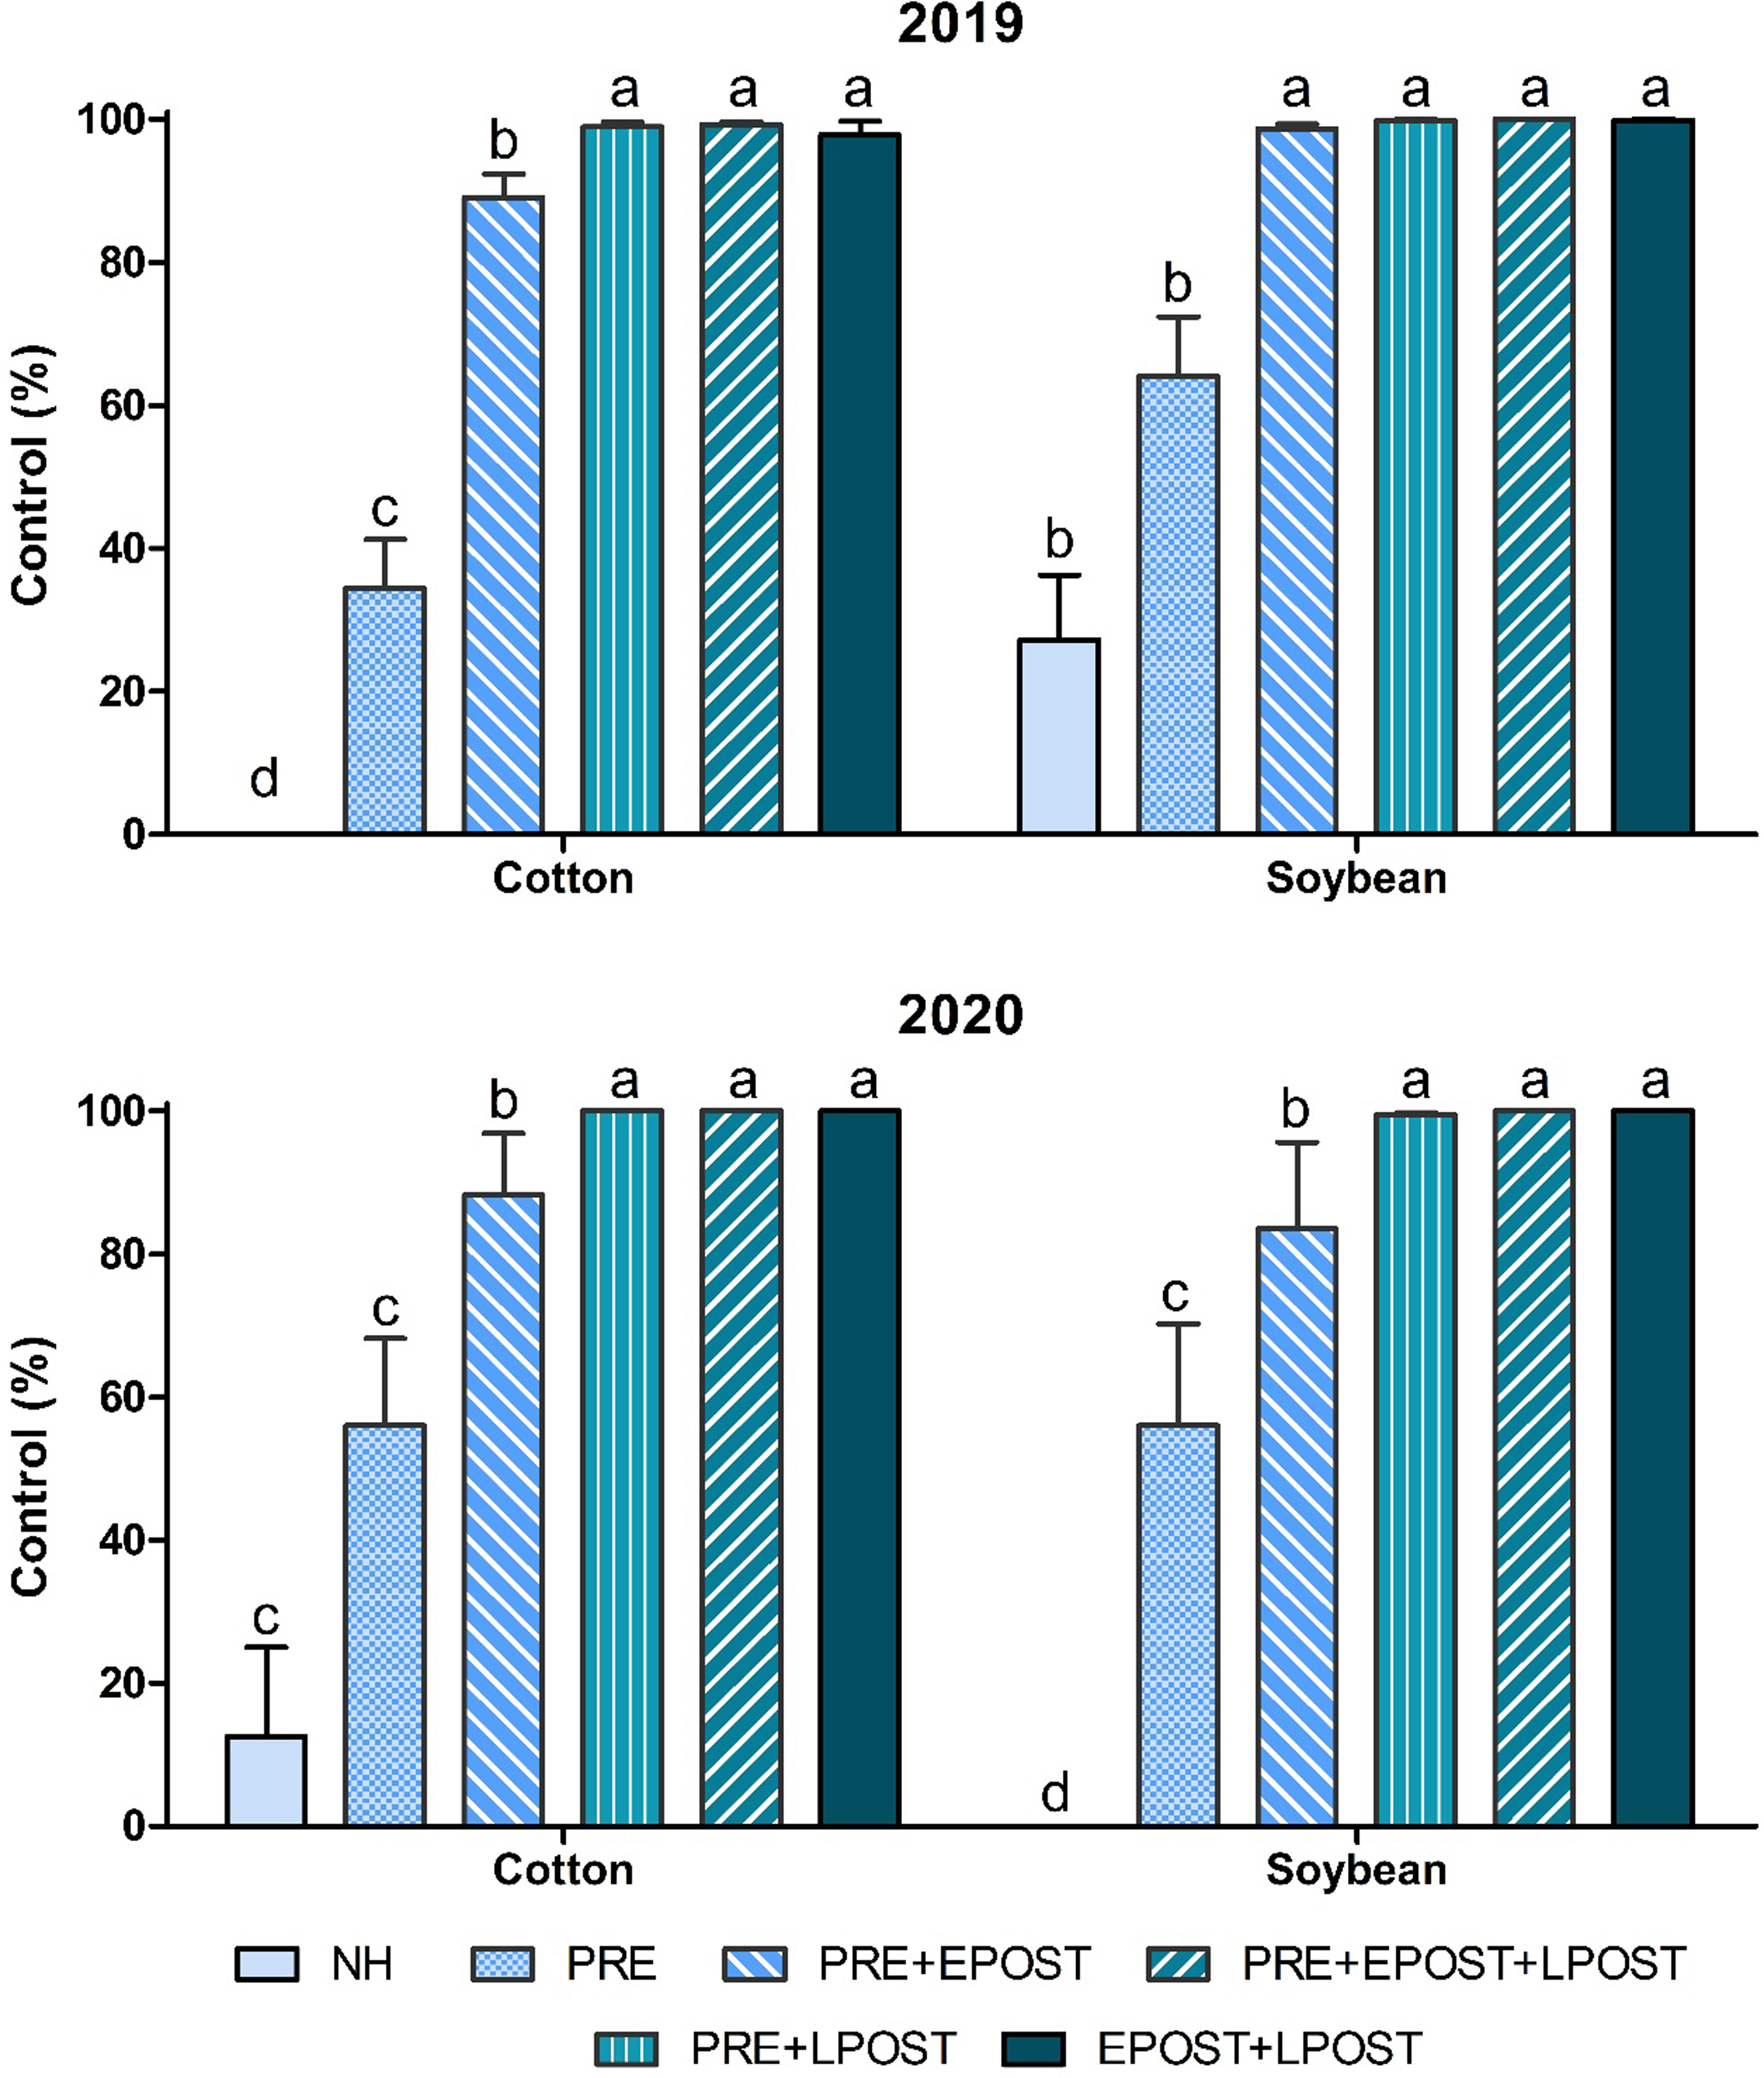
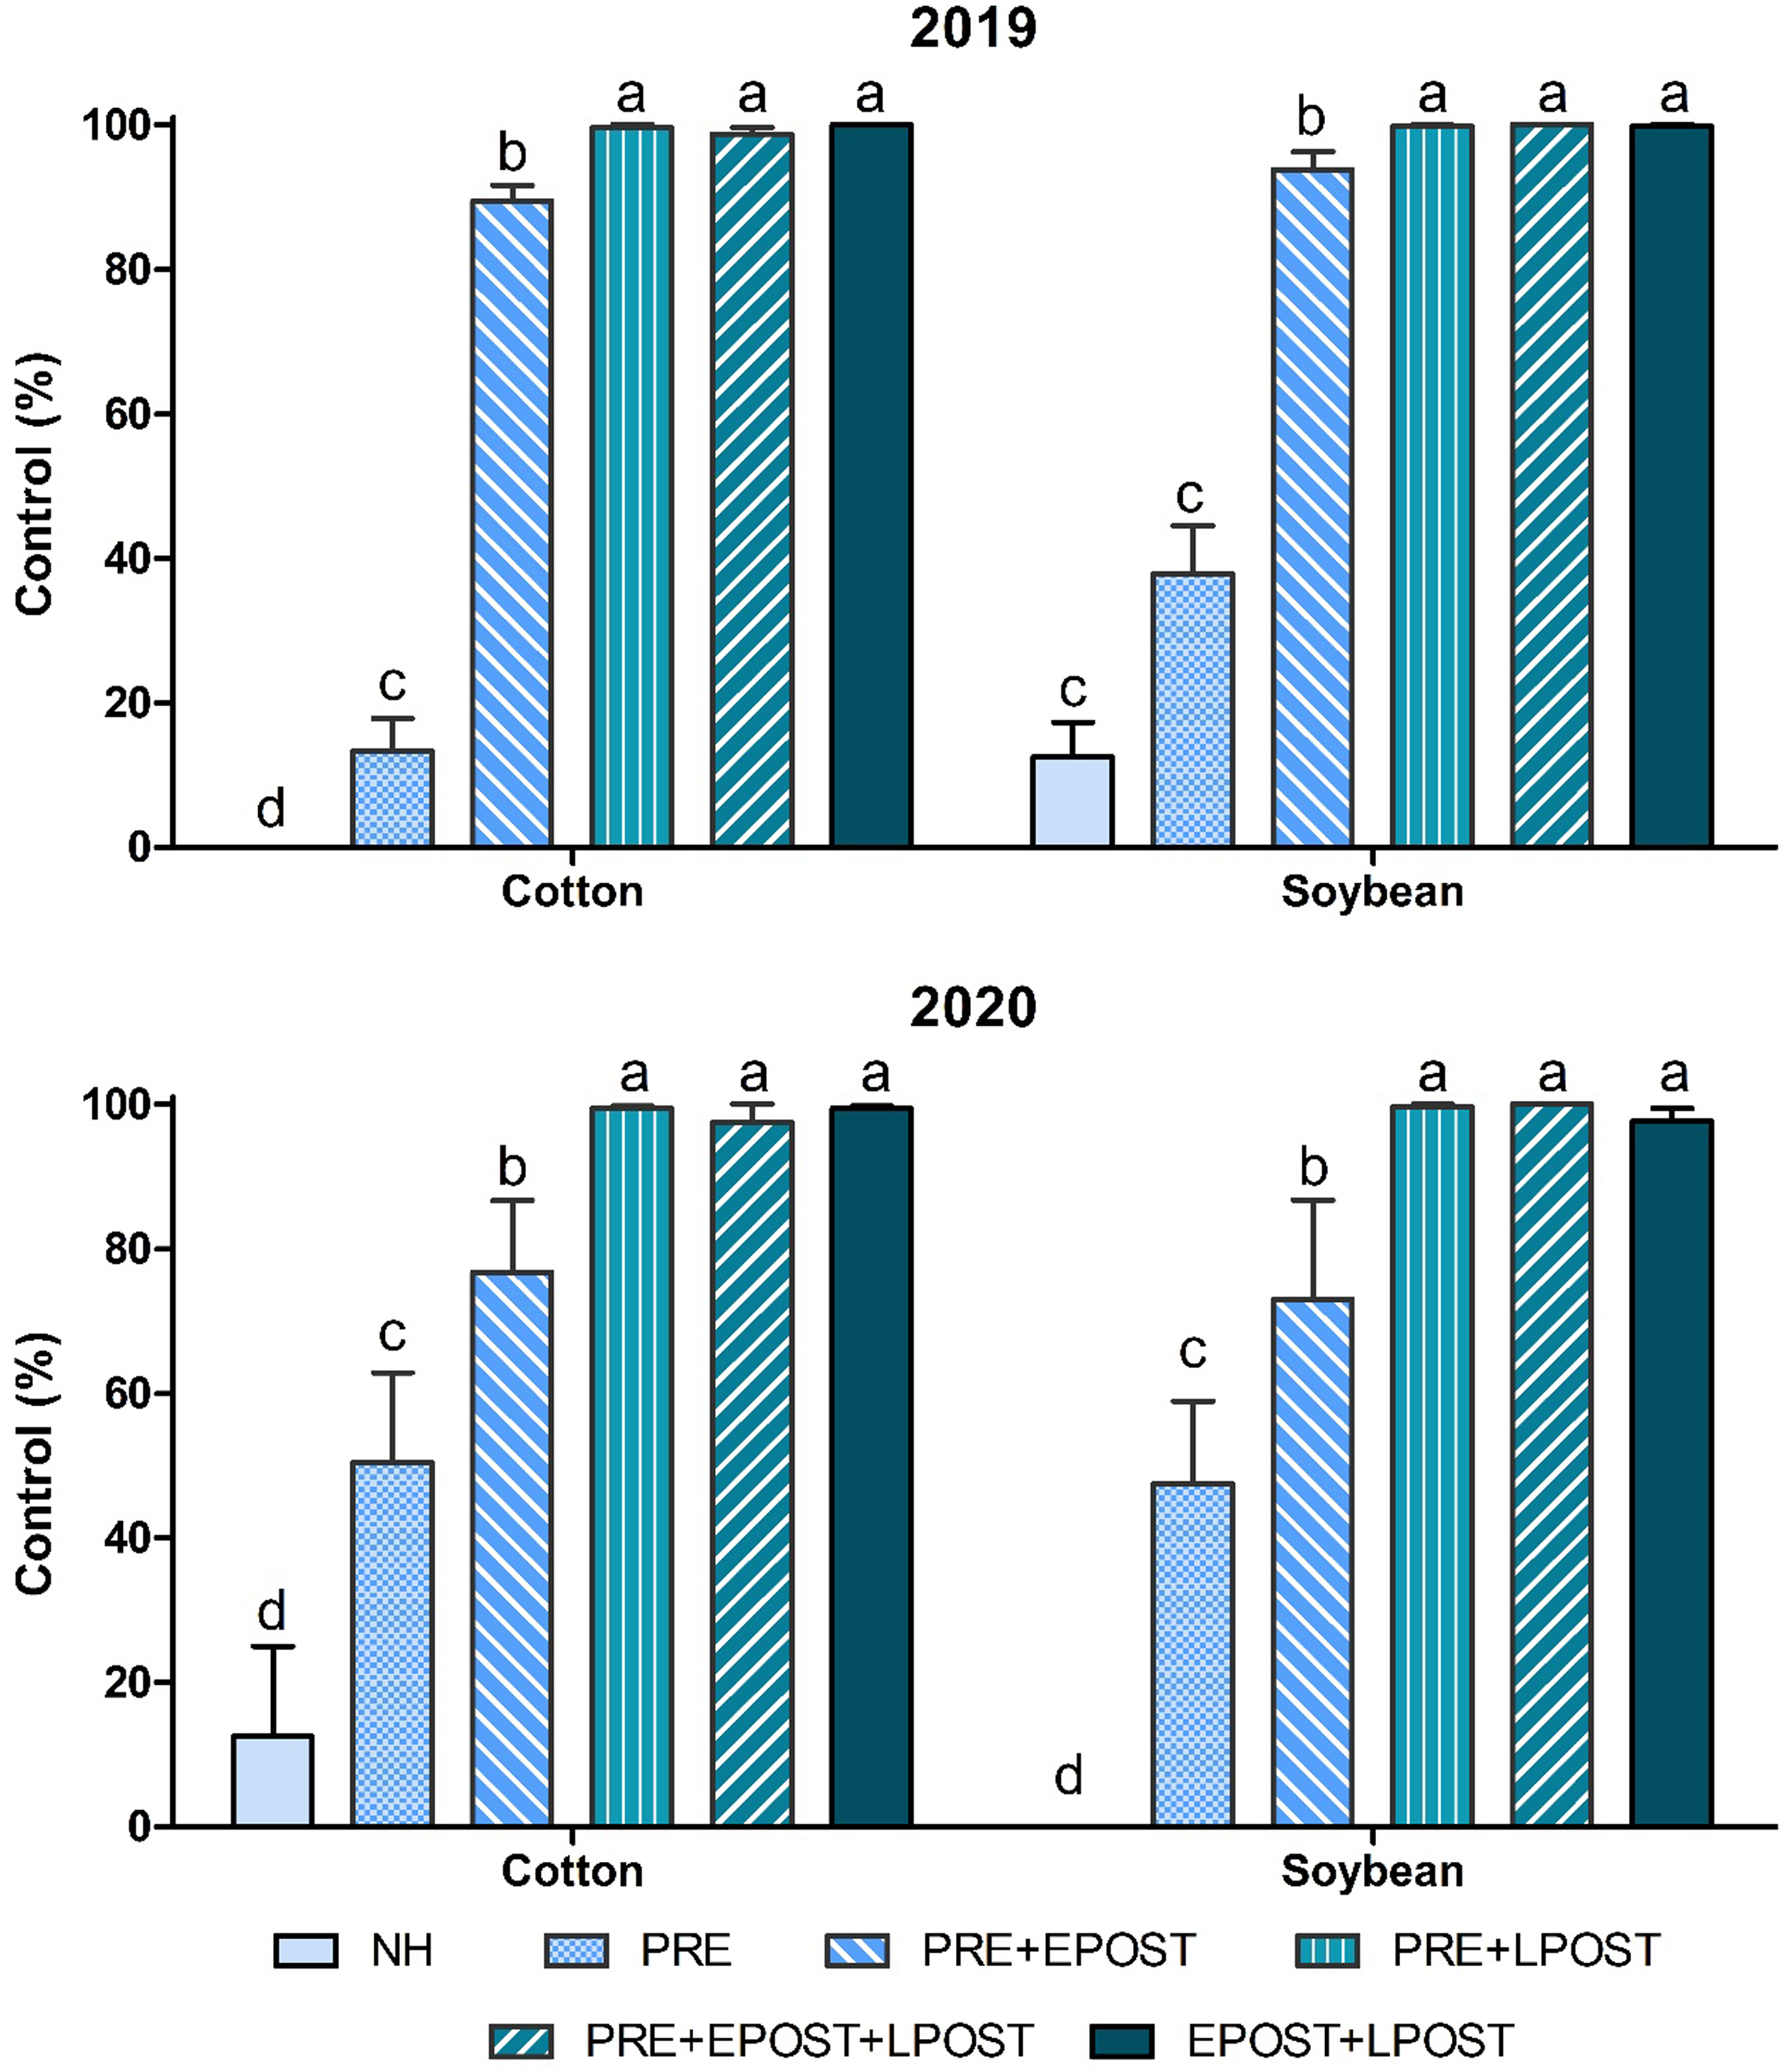
In general, independently of weed species, across crops, years, and species, regimens that included a herbicide applied late postemergence, either preemergence + late postemergence or early postemergence + late postemergence, and the full three-pass sequence (preemergence + early postemergence + late postemergence) provided the highest control without differences among them (P < 0.001). The preemergence + early postemergence application routine failed to reach maximum control as the rest of programs with late postemergence treatments in several environments. The herbicide program with the lowest control in every case, ranging from 10% to 60%, occurred when herbicides were applied only at preemergence (Figures 2, 3, and 4). This pattern is consistent with the continuous seedling emergence of Palmer amaranth (Reinhardt Piskackova et al. Reference Reinhardt Piskackova, Reberg-Horton, Richardson, Jennings, Franca, Young and Leon2021), annual grasses (Leguizamon et al. Reference Leguizamon, Rodriguez, Rainero, Perez, Perez, Zorza and Fernandez-Quintanilla2009), and morningglories (Norsworthy and Oliveira Reference Norsworthy and Oliveira2007), which allows late cohorts to escape both residual activity and herbicides applied early postemergence (Chahal et al. Reference Chahal, Barnes and Jhala2021; Hilgenfeld et al. Reference Hilgenfeld, Martin, Mortensen and Mason2004). These results support current recommendations of promoting a diversified preemergence application followed by sequential postemergence applications for managing weed species such as Palmer amaranth that have an extended period of emergence.
Palmer amaranth control (%) evaluated 7–8 wk after planting in cotton and soybean in 2019 and 2020 in response to herbicide programs. Abbreviations: PRE, preemergence acetochlor (828–1,240 g ai ha⁻1) + fomesafen (578–770 g ai ha⁻1); EPOST, glufosinate (578 g ai ha⁻1); LPOST, 2,4-D + glyphosate (1,334 g ae ha⁻1 each). Program sequences were PRE, PRE + EPOST, PRE + LPOST, EPOST + LPOST, PRE + EPOST + LPOST, and no herbicide. Bars show means ± SEM, averaged across Rocky Mount and Lewiston-Woodville. Within each year × crop panel, columns sharing a letter are not different via a Tukey-style pairwise comparisons from a generalized linear model (binomial) (α = 0.05).

Figure 2. Long description
Panel A: A bar graph showing Palmer amaranth control percentages in cotton and soybean crops for the year 2019. The horizontal axis represents the crop type (Cotton and Soybean) and the vertical axis represents the control percentage. The graph includes six different herbicide programs: NH, PRE, PRE+EPOST, PRE+LPOST, PRE+EPOST+LPOST, and EPOST+LPOST. Each program is represented by a different color bar. The bars show means plus or minus standard error of the mean (SEM), averaged across Rocky Mount and Lewiston-Woodville. Within each year and crop panel, columns sharing a letter are not different via a Tukey-style pairwise comparisons from a generalized linear model (binomial) (alpha equals 0.05). Panel B: A bar graph showing Palmer amaranth control percentages in cotton and soybean crops for the year 2020. The horizontal axis represents the crop type (Cotton and Soybean) and the vertical axis represents the control percentage. The graph includes six different herbicide programs: NH, PRE, PRE+EPOST, PRE+LPOST, PRE+EPOST+LPOST, and EPOST+LPOST. Each program is represented by a different color bar. The bars show means plus or minus SEM, averaged across Rocky Mount and Lewiston-Woodville. Within each year and crop panel, columns sharing a letter are not different via a Tukey-style pairwise comparisons from a generalized linear model (binomial) (alpha equals 0.05).
Annual grass control (%) evaluated 7–8 wk after planting in cotton and soybean in 2019 and 2020 in response to the herbicide programs. Abbreviations: PRE, preemergence acetochlor (828–1,240 g ai ha⁻1) + fomesafen (578–770 g ai ha⁻1); EPOST, glufosinate (578 g ai ha⁻1); LPOST, 2,4-D + glyphosate (1,334 g ae ha⁻1 each). Program sequences were no herbicide, PRE, PRE + EPOST, PRE + LPOST, EPOST + LPOST, and PRE + EPOST + LPOST. Bars show means ± SEM, averaged across Rocky Mount and Lewiston-Woodville. Within each year × crop panel, columns sharing a letter are not different via a Tukey-style pairwise comparisons from a generalized linear model (binomial) (α = 0.05).

Morningglory (Ipomoea spp.) control (%) evaluated 7–8 wk in cotton and soybean in 2019 and 2020 in response to the herbicide programs. Abbreviations: PRE, preemergence acetochlor (828–1,240 g ai ha⁻1) + fomesafen (578–770 g ai ha⁻1); EPOST, glufosinate (578 g ai ha⁻1); LPOST, 2,4-D + glyphosate (1,334 g ae ha⁻1 each). Program sequences were no herbicide, PRE, PRE + EPOST, PRE + LPOST, EPOST + LPOST, and PRE + EPOST + LPOST. Bars show means ± SEM, averaged across Rocky Mount and Lewiston-Woodville. Within each year × crop panel, columns sharing a letter are not different via a Tukey-style pairwise comparisons from a generalized linear model (binomial) (α = 0.05).

Figure 4. Long description
Panel A: In 2019, a bar graph compares the control percentage of morningglory in cotton and soybean crops using different herbicide programs. The horizontal axis lists the herbicide programs: NH, PRE, PRE+EPOST, PRE+LPOST, PRE+EPOST+LPOST, and EPOST+LPOST. The vertical axis measures control percentage, ranging from 0 to 100 percent. The bars are grouped by crop type, with cotton on the left and soybean on the right. Each bar represents a different herbicide program, with colors indicating the specific program. The NH program shows the lowest control, while the PRE+EPOST+LPOST and EPOST+LPOST programs show the highest control. Panel B: In 2020, a similar bar graph compares the control percentage of morningglory in cotton and soybean crops using the same herbicide programs. The horizontal axis lists the herbicide programs, and the vertical axis measures control percentage, ranging from 0 to 100 percent. The bars are grouped by crop type, with cotton on the left and soybean on the right. Each bar represents a different herbicide program, with colors indicating the specific program. The NH program shows the lowest control, while the PRE+EPOST+LPOST and EPOST+LPOST programs show the highest control.
In addition, differences among herbicide applications were largest in 2019, when preemergence and preemergence + early postemergence applications provided lower control (20% to 70%) than late postemergence treatments (80% to 100%). In 2020, those differences in control were reduced, and most postemergence-based applications approached maximum control (>90%) (Figures 2, 3, and 4). The reduced control observed in 2019 at both locations may be explained by the lower amount of rain recorded during the period when the residual herbicides were applied. Greater and earlier rain during May–June 2020 likely enhanced herbicide soil incorporation, which explains the smaller differences among programs that year (Figure 1). A limited amount of rain can delay the activation and incorporation of soil-applied herbicides such as acetochlor. According to Khalil et al. (Reference Khalil, Flower, Siddique and Ward2019) and Urach Ferreira et al. (Reference Urach Ferreira, Ferguson, Reynolds, Kruger and Irby2024), rain shortly after application is essential for preemergence herbicides to be incorporated into the soil and achieve effective weed suppression. Conversely, dry periods following application can reduce herbicide bioavailability through volatilization and photodegradation, resulting in lower control (Moraes Ribeiro et al. Reference Moraes Ribeiro, Torres, Ramos, Vieira dos Santos, Simoes and Monquero2018). Differences in weed density and weed size at postemergence application timing may also have contributed to variability in herbicide performance between locations.
Differences between crops reflect variation in crop competitiveness and canopy development, which can influence weed suppression and the performance of identical herbicide application routines. In 2019, preemergence + early postemergence application to soybean resulted in greater control than when it was used on cotton, whereas when herbicides were applied late postemergence, similar levels of high control were observed in both crops. This crop difference in preemergence + early postemergence was observed only in 2019 (Figures 2, 3, and 4). This difference can be attributed, in part, to the narrower row spacing and typically faster canopy closure of soybean than cotton, which may have favored greater shading and weed suppression. Soybean generally exhibits greater competitive ability against weeds than cotton, which can reduce weed growth and seed production (Oreja et al. Reference Oreja, Hare, Jordan and Leon2023). This difference in weed suppression was more evident in 2019, when lower early season precipitation may have reduced crop competitiveness of cotton relative to soybean. These differences suggest that identical herbicide practices may not provide equivalent levels of weed suppression between crops, particularly when crop competitiveness differs. The ranking of the treatments based on control was consistent and did not differ among species (Figures 2, 3, and 4). However, within the preemergence-only treatment, morningglory control was substantially lower (generally <50%) than control of Palmer amaranth or grasses (50% to 70%), especially in 2019. This pattern aligns with reports that large-seeded species such as morningglories often escape soil-applied residual herbicides because germination can occur deeper in the soil and later in the season (Lopes Ovejero et al. Reference Lopes Ovejero, Soares, Oliveira, Fonseca, Berger, Soteres and Christoffoleti2013; Moraes Ribeiro et al. Reference Moraes Ribeiro, Torres, Ramos, Vieira dos Santos, Simoes and Monquero2018).
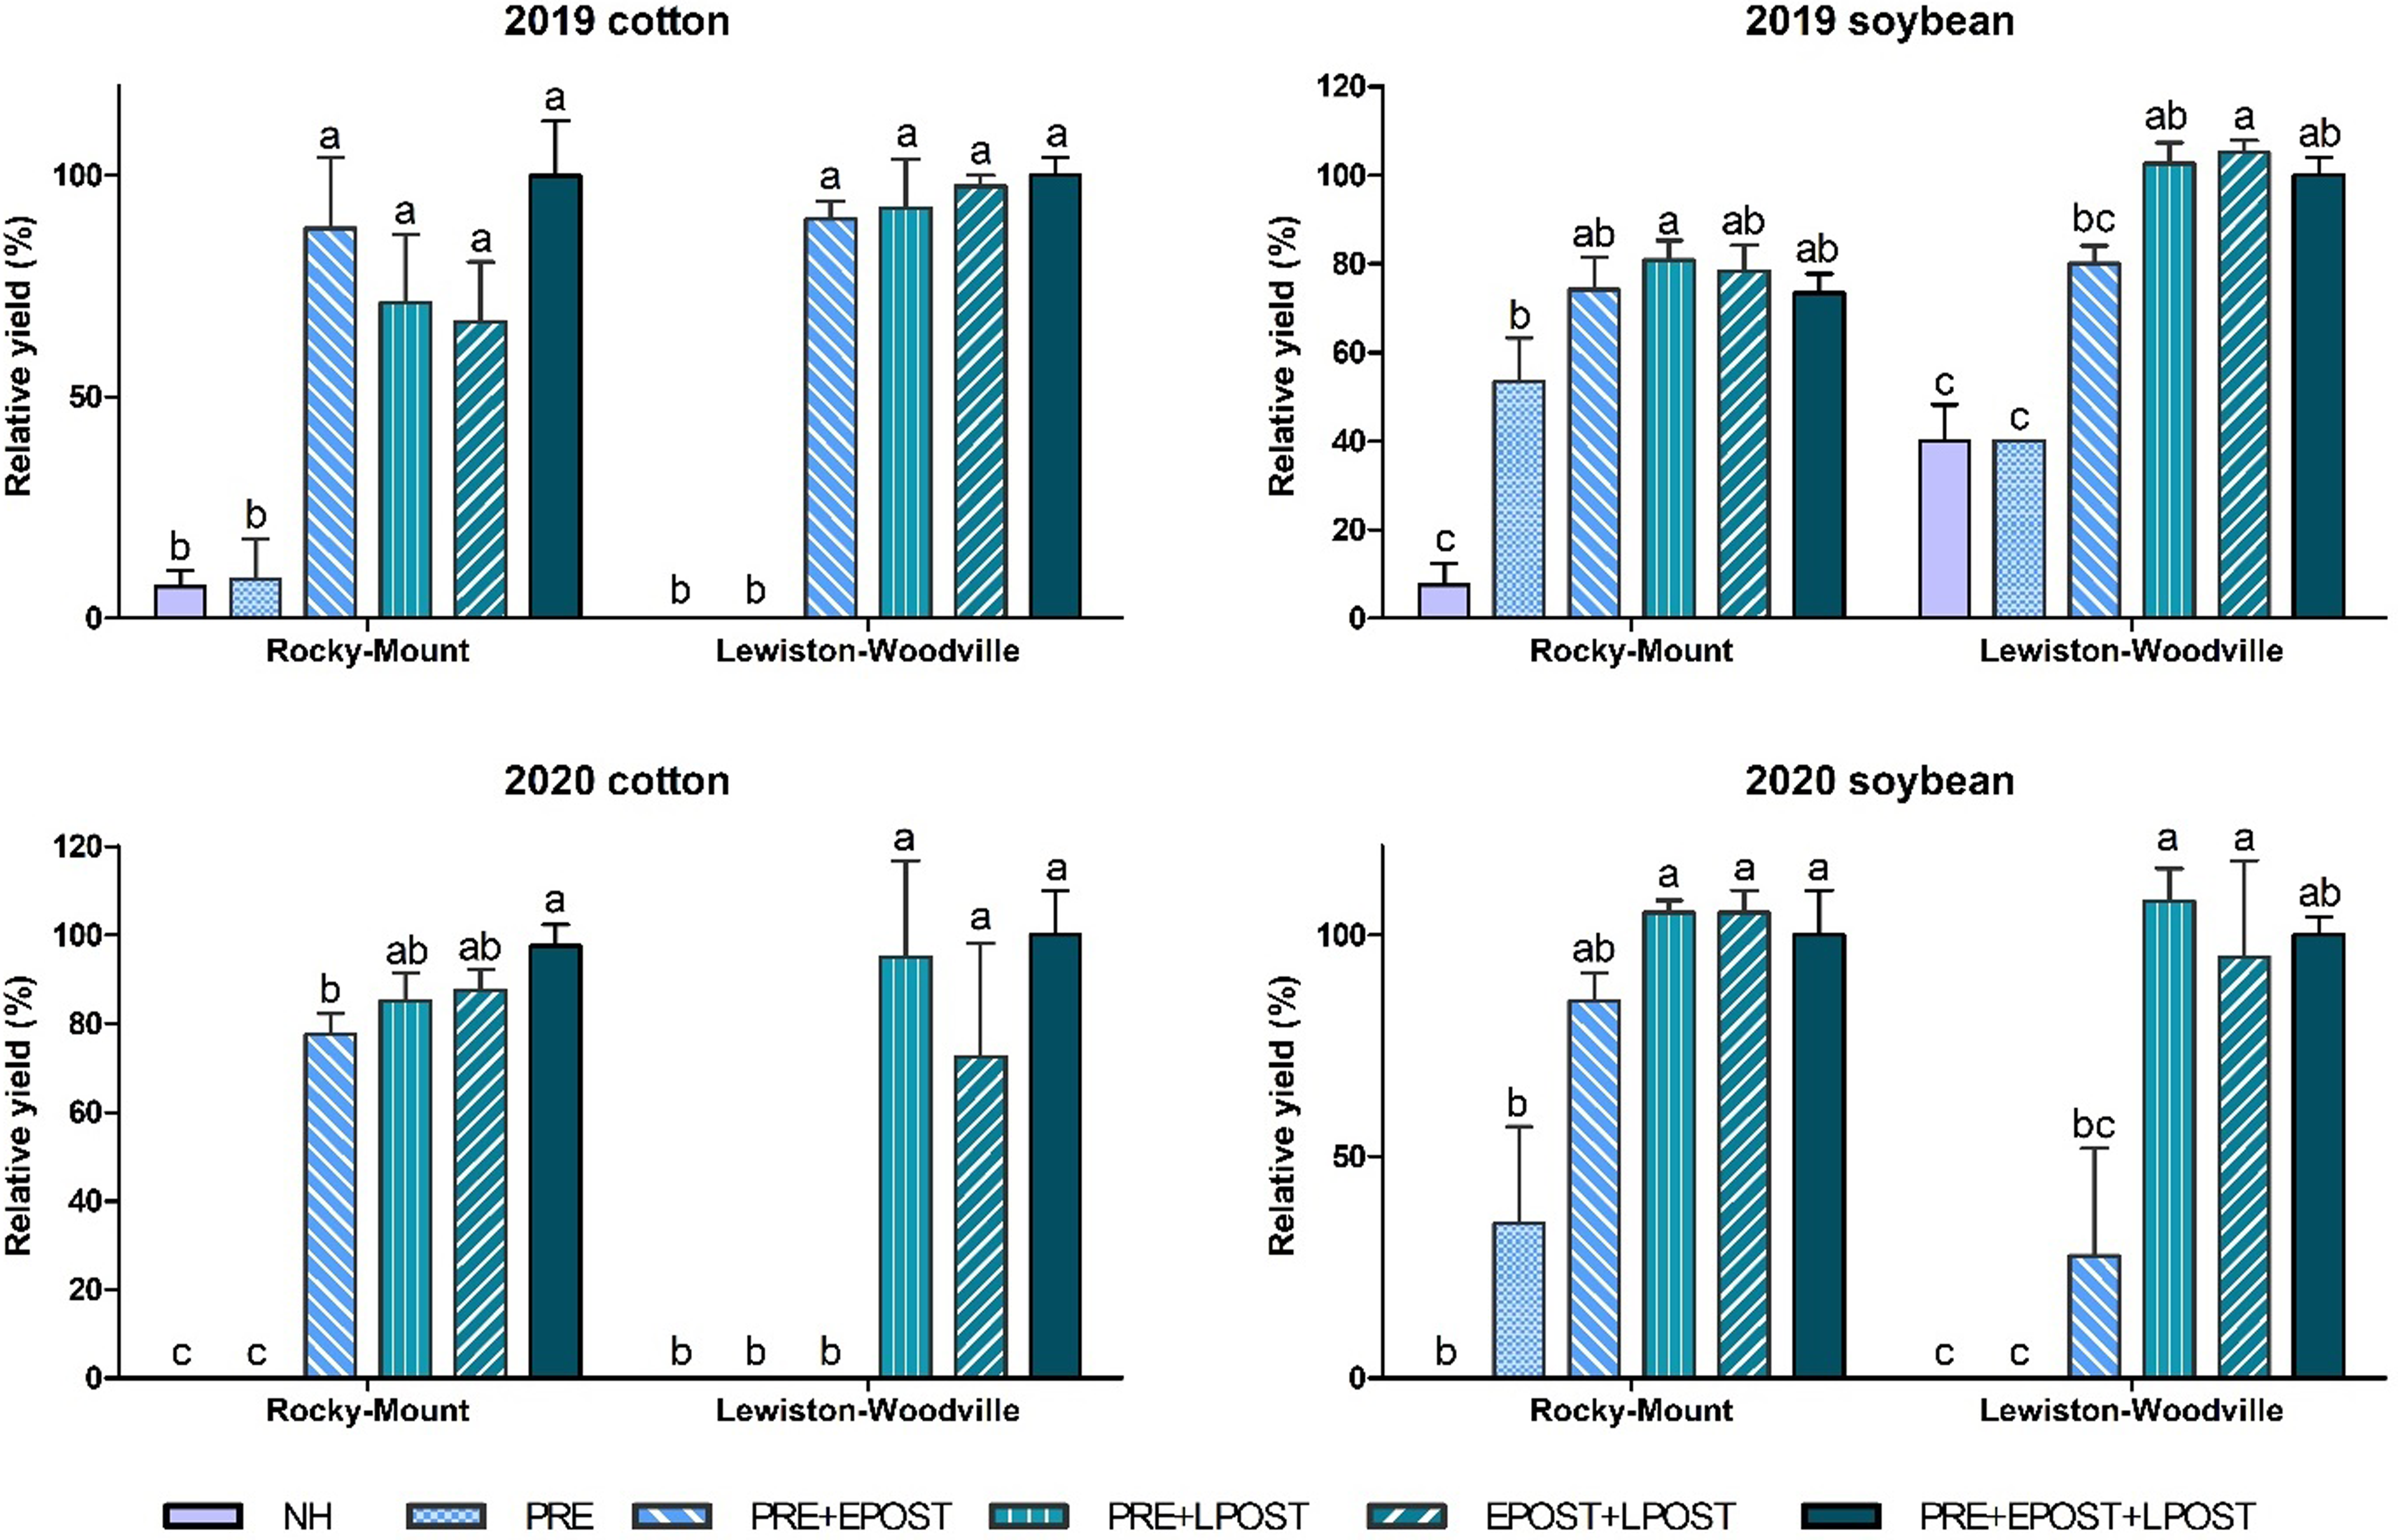
Independently of year, crop, and location, relative yields reflected a strong correspondence with observed weed control percentages (Figure 5). Nontreated plots exhibited yield losses above 70%, while plots in which herbicides applied late postemergence reached yields similar to the maximum observed within each environment (P < 0.05). In addition, consistent with the weed control results, preemergence + early postemergence treatments generally produced relative yields similar to late postemergence treatments, although yields were often lower (P < 0.05), particularly in Lewiston-Woodville (Figure 5). When preemergence herbicide efficacy is reduced, and early postemergence herbicides are applied too early, cohorts emerging during the critical period for weed control can still reduce yield (Knezevic et al. Reference Knezevic, Evans, Blankenship, Van Acker and Lindquist2002). This highlights the need to routinely scout fields and time postemergence herbicide applications accordingly. The yield levels recorded under the best-performing programs (normalized to relative yield = 1.0) were within the range of commercially attainable regional yields, based on long-term averages for North Carolina and the southeastern United States (soybean: 3,000–4,000 kg ha⁻1; cotton: 1,200–1,600 kg lint ha⁻1) (USDA–NASS 2025).
Standardized relative crop yield (%), expressed as the percentage of the maximum observed yield within each year × crop × location. Panels show 2019 cotton, 2019 soybean, 2020 cotton, and 2020 soybean; within each panel, results are shown for Rocky Mount and Lewiston-Woodville. Maximum yields were as follows: cotton 2019, Lewiston-Woodville 3,287 kg lint ha⁻1, Rocky Mount 2,460 kg lint ha⁻1; soybean 2019, Lewiston-Woodville 2,710 kg ha⁻1, Rocky Mount 3,161 kg ha⁻1; cotton 2020, Lewiston-Woodville 827 kg lint ha⁻1, Rocky Mount 3,374 kg lint ha⁻1; soybean 2020, Rocky Mount 1,802 and 2,179 kg ha⁻1 (Lewiston-Woodville not recorded). Herbicide programs included no herbicide, PRE (preemergence acetochlor, 828–1,240 g ai ha⁻1 + fomesafen 578–770 g ai ha⁻1; EPOST (glufosinate, 578 g ai ha⁻1), and LPOST (2,4-D + glyphosate, 1,334 g ae ha⁻1 each, combined as PRE, PRE + EPOST, PRE + LPOST, EPOST + LPOST, and PRE + EPOST + LPOST. Bars show arithmetic means ± SE. Within each year × crop × location, columns sharing a letter are not different via a Tukey-adjusted pairwise comparisons of aligned rank transform estimated marginal means (α = 0.05).

Practical Implications
In Enlist cotton and soybean, sequential herbicides applications that include one applied late postemergence are the most reliable for improving weed control and protecting yield. Herbicide programs should include a residual preemergence, followed by an early postemergence application of glufosinate to suppress weed emergence at early crop stages, and late postemergence 2,4-D + glyphosate to control late-emerging weeds. Under drier early season conditions, preemergence herbicide soil incorporation may be compromised. In these situations, growers should increase scouting frequency and be prepared to apply herbicides postemergence to keep fields weed-free through the critical period for weed control and control late-emerging weeds, especially where large-seed species such as morningglory are pervasive.
For cotton, which requires wider interrow spacing and has a slower canopy closure, applying a herbicide late postemergence is particularly important to prevent escapes and yield loss. Although weed populations and resistance profiles continue to evolve across the southeastern United States, a diversified preemergence followed by sequential postemergence herbicide program remains essential for managing extended-emergence weed species, reducing weed escapes, and mitigating herbicide resistance selection.
Acknowledgments
We thank Andrew Hare and Denis Mahoney and staff at Peanut Belt Research Station and Upper Coastal Plain Research Station for their technical assistance. Corteva Agriscience provided cotton and soybean seed.
Funding
The North Carolina Agricultural Foundation provided partial funding for this research.
Competing Interests
The authors declare they have no competing interests.

 Open access

