INTRODUCTION
The common or harbour seal (Phoca vitulina vitulina L.) is the smaller of the two pinniped species recorded in Ireland. Until 2003 very little information was available on harbour seal distribution and abundance in the Republic of Ireland. Using a combination of aerial and ground surveying methods Cronin et al. (Reference Cronin, Duck, Ó'Cadhla, Nairn, Strong and O'Keeffe2007) derived a minimum population estimate of 2905 for the Republic of Ireland, with counties along the Atlantic seaboard (Donegal, Galway, Kerry and Cork) containing the highest percentage of the overall population. Numbers of harbour seals in the UK and the Republic of Ireland are estimated at 30,550 collectively, with Irish seals representing almost 10% of that total population (SCOS, 2007).
A decline in harbour seal numbers has been recorded in parts of their range, attributed to many different causes including disease, an increase in competition for available food and low recruitment (Pitcher, Reference Pitcher1990; Harding et al., Reference Harding, Härkönen and Caswell2002; Härkonen et al., Reference Härkonen, Dietz, Reijnders, Teilmann, Harding, Hall, Brasseur, Siebert, Goodman, Jepson, Dau Rasmussen and Thompson2006; Mathews & Pendleton, Reference Mathews and Pendleton2006; Lonergan et al., Reference Lonergan, Duck, Mackey, Cunningham and Boyd2007; Thompson & Wheeler, Reference Thompson and Wheeler2008). In many areas of its range however harbour seal numbers are believed to be increasing, with animals perceived to be a threat to local fishing practices (e.g. Harwood & Croxall, Reference Harwood and Croxall1988; Olesiuk et al., Reference Olesiuk, Bigg and Ellis1990; Jemison et al., Reference Jemison, Pendleton, Wilson and Small2006). As coastal foragers there is potential for interactions between seals and fisheries, directly by causing damage to gear and catch and indirectly by competing for the same target species or removal of fish biomass. Harbour seals are in general regarded as both opportunistic and catholic feeders (Härkonen, Reference Härkonen1987; Pierce & Santos, Reference Pierce and Santos2003; Andersen et al., 2004). Within the north-east Atlantic, they have been reported to feed mainly on teleost fish species, many of which are commercially fished. Härkonen (Reference Härkonen1987) showed seals to feed on fish including cod (Gadus morhua), lemon sole (Microstomus kitt), herring (Clupea harengus) and Ammodytidae species in the Skagerrak and the Kattegat. In Scotland, where the diet of harbour seals has been extensively studied, seals have been shown to feed on a wide variety of teleost fish species including whiting (Merlangius merlangius), scad (Trachurus trachurus), herring, sprat (Sprattus sprattus), haddock (Melanogrammus aeglefinus) and Trisopterus species (Pierce et al., Reference Pierce, Thompson, Miller, Diack, Miller and Boyle1991; Thompson et al., Reference Thompson, Pierce, Hislop, Miller and Diack1991; Pierce & Santos, Reference Pierce and Santos2003).
To date, studies of pinnipeds in the Republic of Ireland are limited, and include distribution and abundance estimates for both of the species found here (e.g. Lockley, Reference Lockley1966; Warner, Reference Warner1983; Cronin et al., Reference Cronin, Duck, Ó'Cadhla, Nairn, Strong and O'Keeffe2007). Studies on foraging and diet are rare and have focused on the physical interactions of grey seals (Halichoerus grypus F.) with fisheries (e.g. Berrow et al., Reference Berrow, O'Neill and Brogan1998). Assessing the potential impact of seals on fisheries requires reliable data on both diet and foraging behaviour. A study aimed to address these knowledge gaps was initiated in 2006 by investigating the movements and foraging behaviour of harbour seals in south-west Ireland using telemetry technology whilst simultaneously investigating the diet of the species (Cronin et al., Reference Cronin, Kavanagh and Rogan2008). The findings of the study on the diet of the harbour seal are presented here.
Using a combination of techniques, including hard part analysis of prey remains recovered from scats and fatty-acid analysis, the diet of harbour seals in west and south-west Ireland was investigated. In this study, blubber fatty-acids are used to provide qualitative information on changes in diet or differences between groups of animals within the same population.
MATERIALS AND METHODS
Scat collection
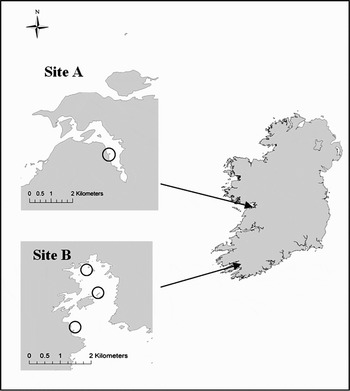
Scat sampling was carried out over a 17-month period from May 2006 to September 2007 at two sites. The first site, Glengarriff Harbour, is situated in the upper part of Bantry Bay in County Cork in the south-west of Ireland (Figure 1). The harbour is sheltered and consists of a number of small islands, mostly uninhabited, where seals are found hauling-out on rocky and seaweed covered island shores exposed during low tides. The second sample site, near the coastal village of Ballyvaughan in County Clare, is located in the sheltered Poulnaclogh Bay on the west coast of Ireland. The haul-out site consists of a short stretch of intertidal, rocky shoreline, partially covered with seaweed. Sites were accessed either on foot, by boat or by kayak and all sampling took place at or just after low tide. Scats were collected and placed in individual polythene bags and stored frozen at –20°C, until processing could be carried out.
Map of sampling sites in the Republic of Ireland. Site (A) Poulnaclogh Bay, Ballyvaughan, County Clare; Site (B) Glengarriff Harbour, Bantry Bay, County Cork.

Dietary analysis
Dietary analyses were carried out following procedures described in Pierce & Boyle (Reference Pierce and Boyle1991), Brown & Pierce (Reference Brown and Pierce1998) and Ridoux et al. (Reference Ridoux, Spitz, Vincent and Walton2007), and are briefly outlined here. Scats were washed through a nest of sieves with a minimum mesh size of 250 µm. Otoliths, bones and crustacean remains recovered were cleaned and stored dry, cephalopods beaks were stored in 70% alcohol. Prey remains were identified to the lowest possible taxon using reference collections and published guides (Clarke, Reference Clarke1986; Härkonen, Reference Härkonen1986; Watt et al., Reference Watt, Pierce and Boyle1997; Campana, Reference Campana2004). Otoliths were graded by an estimation of the extent of the digestion they had undergone, into high, medium and low categories, following Tollit et al. (Reference Tollit, Steward, Thompson, Pierce, Santos and Hughes1997). It was not always possible to distinguish between closely related species of fish and so Trisopterus species (T. esmarkii, T. minutus and T. luscus), sandeel species (Ammodytes tobianus, A. marinus and Hyperoplus lanceolatus) and Gadidae (Melanogrammus aeglefinus, Pollachius pollachius and P. virens) were grouped together for the purpose of analyses.
Rostral and hood lengths of the beaks of cephalopods, and otoliths from fish were measured using a graticule under a binocular microscope. With the exception of herring otoliths, where widths were measured, for all other otoliths length was measured (Clarke, Reference Clarke1986; Härkonen, Reference Härkonen1986). Otoliths were separated into lefts and rights and paired where possible. Identified otoliths that were not in a condition suitable for measurement due to erosion or physical damage were assigned the average length or width of that species, from the same site and same season.
The importance of each prey category overall and at each site was determined using a number of methods: (i) minimum numbers of prey species present (cephalopods: the highest number of either upper or lower beaks; fish: the highest number of either left or right otoliths, where distinguishable, or the total number of otoliths divided by 2); (ii) the percentage number (number of times a prey species occurred expressed as a percentage of the total number of times all prey species occurred); (iii) the percentage frequency of occurrence (the number of samples containing a certain prey species expressed as a percentage of all samples containing prey); and (iv) index of importance (calculated by multiplying the % number of a prey species by the % frequency of occurrence of the same species raised to the power of 0.5) (Rogan et al., Reference Rogan, Penrose, Gassner, Mackey and Clayton2001). There were insufficient sample numbers to accurately examine seasonal differences at each of the sites.
Additionally, we reconstructed mass and length of prey species for which regression equations were available. These were calculated with and without the application of digestion correction factors following Tollit et al. (Reference Tollit, Steward, Thompson, Pierce, Santos and Hughes1997). Species-specific correction factors were available for herring (Clupea harengus), sprat (Sprattus sprattus) and plaice (Pleuronectes platessa) and species-specific digestion-grade correction factors were available for whiting (Merlangius merlangius) and sandeel species (Tollit et al., Reference Tollit, Steward, Thompson, Pierce, Santos and Hughes1997). In Tollit et al. (Reference Tollit, Steward, Thompson, Pierce, Santos and Hughes1997), whiting and sandeel correction factors are also available for specific size-ranges of fish; however, for the purposes of this study an average correction factor for each digestion grade was employed. For all other species of fish consumed no species-specific correction factors were available and so average correction factors from Tollit et al. (Reference Tollit, Steward, Thompson, Pierce, Santos and Hughes1997) were used. Reconstructed lengths and weights of prey consumed were estimated using standard published regression equations relating prey body length and weight to otolith and beak dimensions (Clarke, Reference Clarke1986; Härkonen, Reference Härkonen1986; Brown & Pierce, Reference Brown and Pierce1998).
Examination of feeding specialization
A modified Costello diagram (Costello, Reference Costello1990) was constructed for the results of scat samples. This is a graphical method used to characterize the diet variability of a predator by plotting prey mass for each prey species or group against the frequency of occurrence for the same prey on a two-dimensional graph.
Species accumulation and rarefaction curves
Prey species accumulation curves and rarefaction curves were constructed for samples collected in each site using the freeware program Estimate S, version 8.0 (Colwell, Reference Colwell2005). Species accumulation curves record the total number of prey species revealed, during the process of data collection, as sample units are added to the pool of all previously collected samples. In contrast, rarefaction curves are produced by repeatedly re-sampling the pool of N samples, at random, plotting the average number of species represented by 1, 2… N samples. Sampling is done without replacement, within each re-sampling, thus, rarefaction generates the expected number of species in a small collection of n samples drawn at random from a larger pool of N samples (Gotelli & Colwell, Reference Gotelli and Colwell2001). As collections of samples, or scats in this study, may differ not only in the number of species but also in the number of samples, ‘rarefying’ each collection to a common number of individuals, to match the size of the smallest collection allows a balanced platform for comparing species richness between the two sites in this study.
Fatty-acid profiles
Fatty-acid samples were collected using biopsy sampling from 13 animals, which were all caught off the south-west coast of Ireland as part of a tagging programme, running concurrently with this project. Fatty-acid profiles were determined by the extraction of lipids from the whole blubber samples, followed by conversion of the fatty-acids to their methyl esters, which are then characterized by gas chromatography. The lipid was extracted by the method of Folch et al. (Reference Folch, Less and Slone Stanley1957). The fatty-acid methyl esters (FAMES) were analysed by gas–liquid chromatography using a split-injection on a Trace GC-2000 gas chromatograph (Thermoquest, CE Instruments) equipped with a flame-ionization detector and fitted with a DB23 fused silica capillary column (25 m × 0.25 mm internal diameter, J&W Scientific) (Walton et al., Reference Walton, Henderson and Pomeroy2000). Over 60 individual fatty-acids were quantified for each seal blubber sample and these individual fatty-acids are expressed as a mass percentage of the total fatty acids characterized.
Statistical analysis
To test for regional differences in the diet of seals as derived from scats the average number of otoliths per scat, excluding those scats with no otoliths, was compared for a given species. Comparisons between regions were made using a non-parametric Mann–Whitney U-test.
All fatty-acid data analysis was carried out using Brodgar 2.4.5 software, and followed methods outlined by Learmonth (Reference Learmonth2006) and Zuur et al. (Reference Zuur, Leno and Smith2007). Of the 64 fatty-acids quantified for each blubber sample, the 24 fatty-acids that individually represented at least 1% of the % by weight in at least one seal profile were used for analysis. Principal component analysis (PCA) was used to examine the relationship between these 24 fatty-acids and then to select 11 representative fatty-acids, reducing the number of additive models that had to be run and the probability of increasing statistical error. Generalized additive modelling was carried out on each of the representative fatty-acids (the response variable) separately to establish which, if any, explanatory variables had a significant effect on the fatty-acid profiles of the 13 harbour seals sampled. Data from 13 animals for each explanatory variable category; sex, length, weight and season (animals were sampled in either October or April) were available. The generalized additive models were run with Gaussian distribution and cross-validation was used to select the optimal degrees of freedom for each smoother term, for each individual fatty-acid model. All the explanatory variables were included in all the initial additive models for each of the representative fatty-acids. Optimal models, with the lowest Akaike's information criterion (AIC) value for each fatty-acid, were obtained by backward selection of the explanatory variables. Regression trees were employed to support the additive modelling, as they are a further tool used to explore the relationship between a single response variable and multiple explanatory variables. Regression tree analyses calculate ‘cut-off’ or ‘threshold’ values to determine the position of the split of the individual fatty-acid values into groups based on the explanatory variable in question.
RESULTS
Diet composition
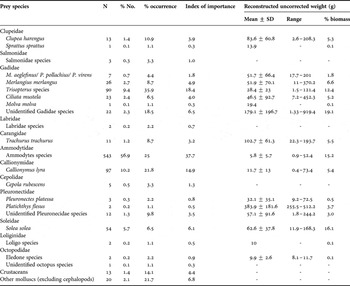
The diet of the harbour seals in the study was composed almost entirely of teleost fish. A total of 25 and 77 scats were collected from the Glengarrif site and the Ballyvaughan site, respectively. Scats contained over 1690 otoliths, 99% of which were identifiable to at least family group, representing a minimum of 915 individual fish prey (Table 1). Numerically, teleost fish represented 96% of the prey consumed by seals, while cephalopods, including squid and octopus species, other molluscs and unidentified crustaceans collectively comprised only 38 individual prey or prey occurrences, representing 4% of the diet. Numerically, sandeel species were the most important component of the diet comprising over 55% by number, followed by dragonet (Callionymus lyra), Trisopterus species and sole (Solea solea), collectively representing approximately 25% by number. The most frequently occurring prey species was Trisopterus species, which occurred in over a third (35.8%) of scat samples followed closely by sandeels, which occurred in 25% of samples. The % frequency of occurrence for Gadidae species overall was 73.9%, making them the most commonly occurring fish family in the diet.
Overall diet of harbour seals derived from scats (both sites combined) (N = 92).

Otoliths representing ten fish of a species that could not be positively identified were recovered from three scats. Despite consultation with various reference collections, laboratories and reference guides, a positive identification was not made and the otolith is tentatively labelled as belonging to a ‘red band fish’ (Cepola rubescens) belonging to the order Perciformes.
The index of importance, which incorporates the % number and the % frequency of occurrence of prey, takes both indices into account. Sandeels again dominate the diet (37.7), with over twice the index of importance of the next prey species Trisopterus species (18.4) and dragonet (14.9). Overall, cephalopod species play only a minor role in the diet with an index of importance of just 1.5.
A difference in diet of seals between sample sites was obvious. The diet composition of seals from the Clare site comprised 18 identifiable prey species, with sandeel species being the most important, followed by Trisopterus species and dragonet. The scats collected at the Cork sampling site consisted of fewer prey items, only nine identifiable prey species, the most important of which was dragonet, followed closely by Trisopterus species, herring and scad. There were no cephalopods, sandeel species, sprat, haddock/pollack/saithe or ling found in the diet of the seals in Cork. Statistically, the numbers of herring, scad and sandeel species differed significantly between sites (Mann–Whitney U-test; U = 556, P = 0.000; U = 632, P = 0.01 and U = 517, P = 0.002 respectively). Herring and scad were an important part of the diet of seals only in Cork, while sandeel species occurred solely in the diet of the seals in Clare.
Gadidae species dominated overall, comprising almost half the diet by weight (45.1%). Flatfish (which include pleuronectids and sole) and ‘other’ fish (which include dragonet and scad) also played an important role, making up 23.3% and 10.9% of the diet by weight, respectively. Clupeoids, which consisted mainly of herring, and cephalopods made up only 5.3% and 0.2% of the fresh weight of the diet, respectively. Sandeel species were the most important prey group representing 15.2% of the diet by weight. However, they occurred only in the diet of seals in Clare.
Reconstruction of prey lengths and weights with correction factors
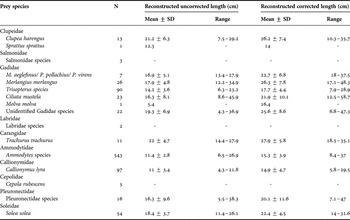
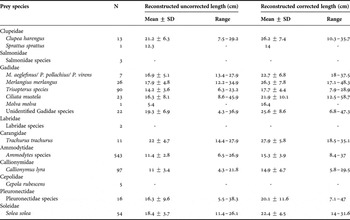
Fish lengths and weights were reconstructed, with and without the application of correction factors (CFs) (Table 2). As expected, in all cases the use of CFs resulted in a broader length-range for individual fish species. Overall mean length increased from 16.6 cm (±1.15 SE) to 21.54 cm (±1.44 SE) with the application of correction factors. It should be noted, however, that most species examined had a low total number of samples, with the exception of sandeel species, Trisopterus species and dragonet, which would impact on the length-ranges observed. Otolith length and therefore fish length were greatly influenced by the application of correction factors (Table 2). Fish lengths increased on average by 40%. Ling particularly displayed the most notable increase in body length with the application of CFs, probably due to the fact that this species has relatively small otoliths in relation to body length, with its length increasing by 205.45%, from 5.4 cm to 16.4 cm. The application of CFs increased the % fresh weight of Gadidae species by 3.7% and decreased the % fresh weight of flatfish by 4.4%, with other fish groups increasing or decreasing in importance by less than 1%.
Reconstructed prey lengths and length ranges, with and without the application of correction factors.
Feeding strategy
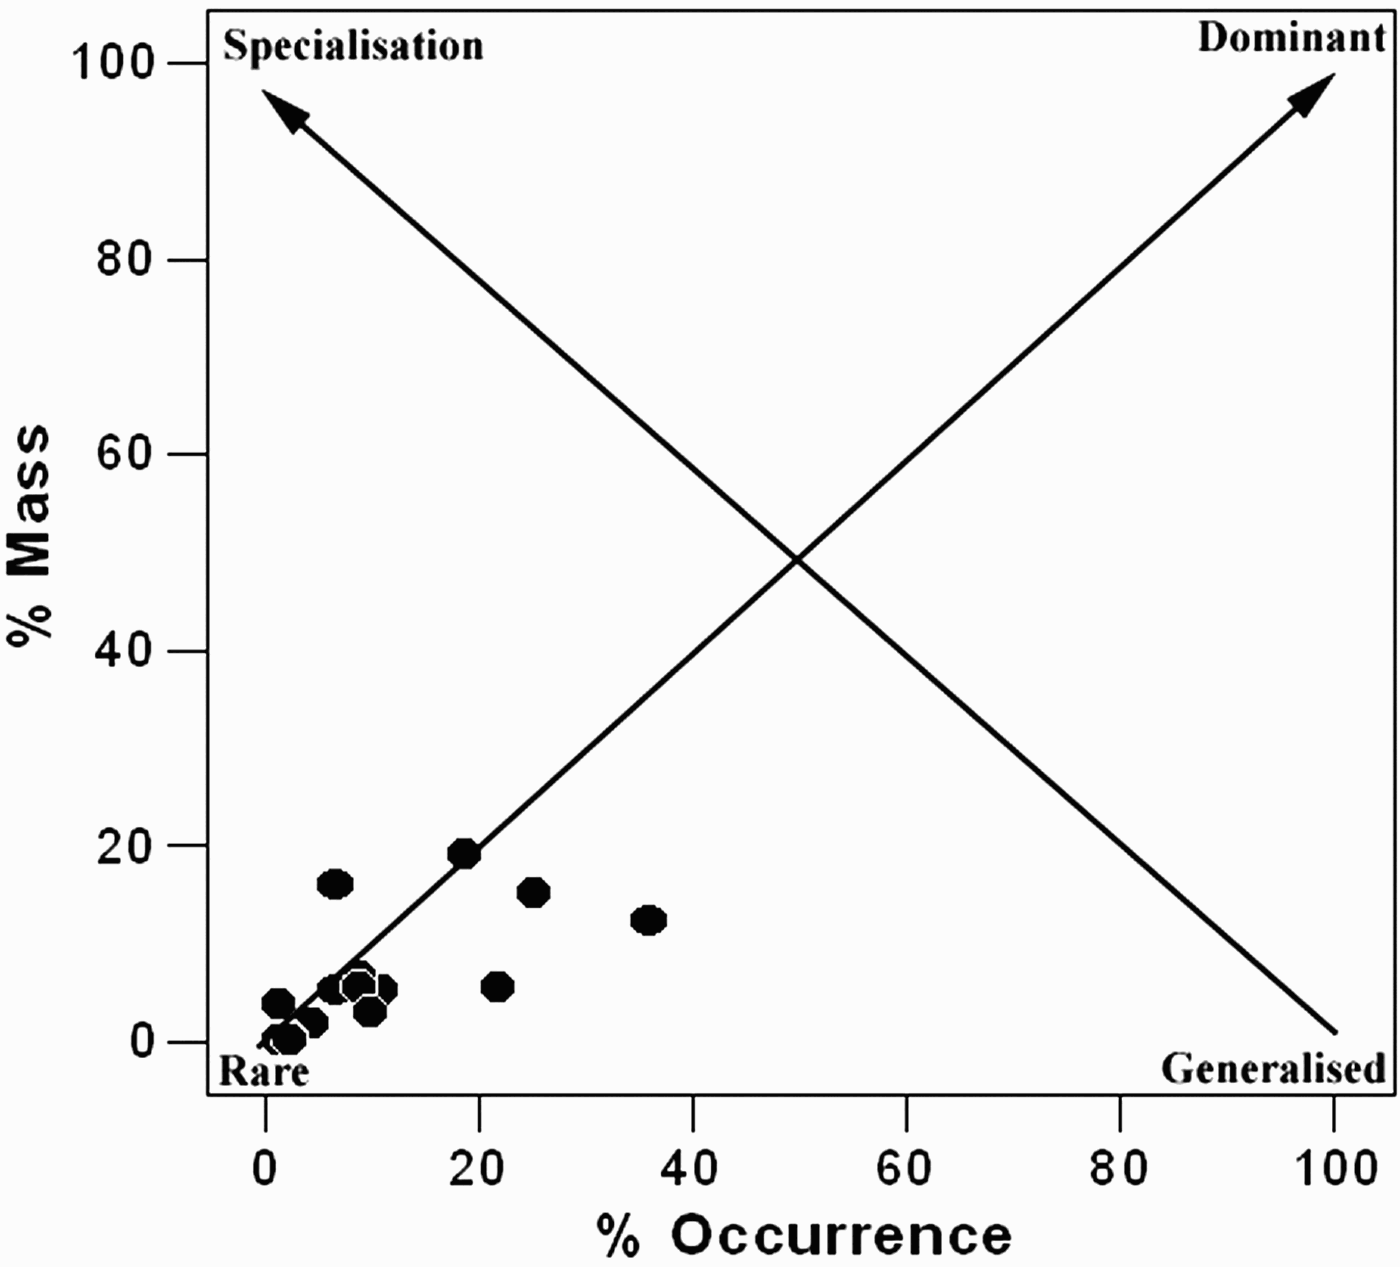
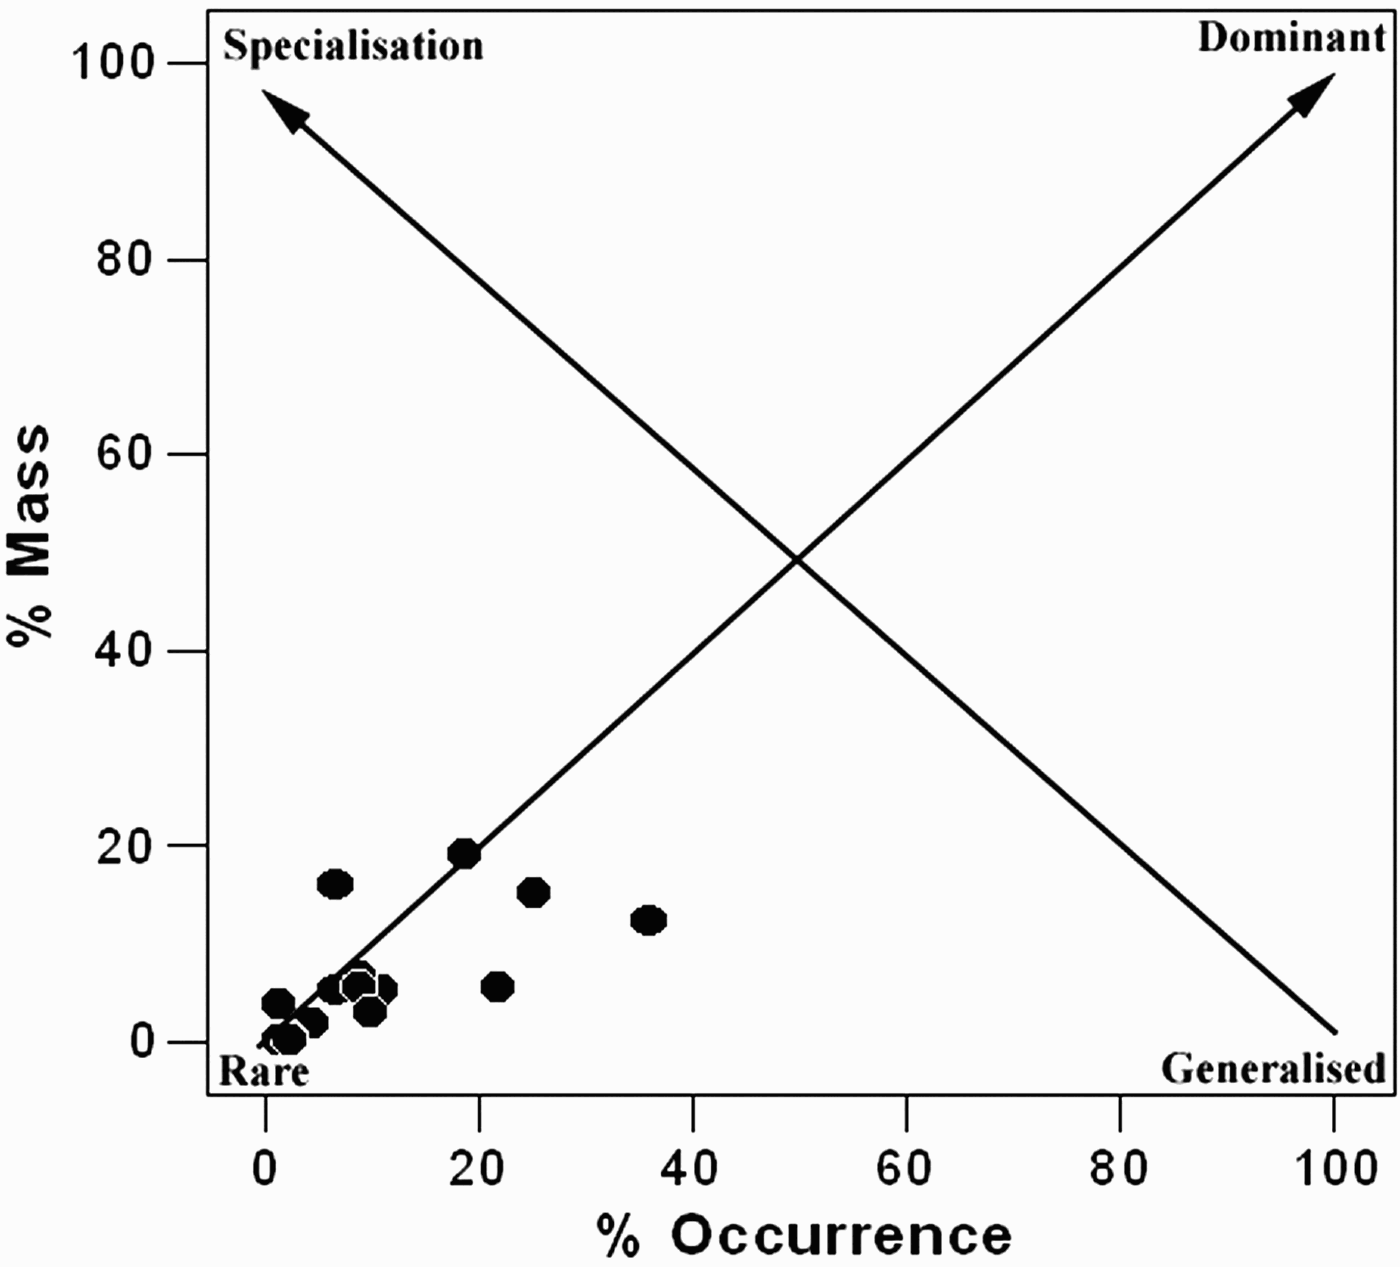
A modified Costello feeding strategy plot for all prey species encountered in scats was produced (Figure 2). In this study all prey species demonstrated a relatively low mass (none over 20%) with varying degrees of relatively low occurrence (none over 35%). These results suggest that the seals in Clare and Cork display a generalized feeding strategy. There is no apparent specialization on one prey species, although two of the most important prey species in the diet (sandeel species and Trisopterus species) occur in 25% and 36.9% of all samples respectively and represent almost 30% by mass of the diet. Conversely, 70% of all prey categories occurred in less than 10% of all samples and are therefore considered rare in the diet. Seals in this region appear to adopt a generalized feeding strategy, consuming a wide variety of prey species whenever available.
Costello feeding strategy plot of main prey items of harbour seals (arrow bottom left to top right: feeding strategy line; arrow bottom right to top left: prey importance line).
Species accumulation and rarefaction curves
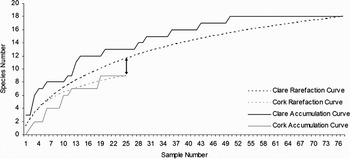
Rarefaction curves were used to determine prey species diversity on a sample site basis (Figure 3). In Figure 3 the Clare site accumulation curve reached a definite asymptote, suggesting that sufficient samples were collected to identify all prey species (in this case 18 samples), whereas the Cork site curve did not reach a prolonged stable asymptote and it is therefore probable that sampling may have been insufficient to identify all prey consumed at this site. When the larger Clare samples are rarefied to allow for a comparison of species richness in the diet of seals between sites, it is clear that diet at the Clare site (11.58 prey species) is slightly more varied than that at the Cork site (9 prey species).
Species accumulation curves and species rarefaction curves for prey species recovered from scats in Clare and Cork sites (arrow indicates comparison of species richness).

Fatty-acids
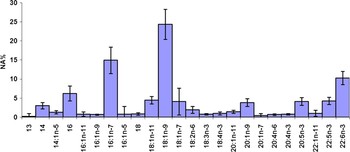
Sixty-four fatty-acids and their isomers were identified from 13 seals. The 24 fatty-acids that represented more than 1% of the % by weight in at least one seal were selected for further analysis. Saturated, monounsaturated and polyunsaturated fatty acids represented 11%, 63% and 26% of the % by weight respectively. Unsaturated fatty-acids 18:1n-9, 16:1n-7 and 22:6n-3 were the most prominent, and together represented almost half of the % by weight overall. Fatty-acids 18:1n-9, 18:1n-7, 16:1n-7 and 16:1n-5 showed the greatest variation overall with a SD over 2% (Figure 4).
Fatty-acid profile (mean normalized area percentage (±SD) of 24 fatty-acids) from the blubber of harbour seals (N = 13).

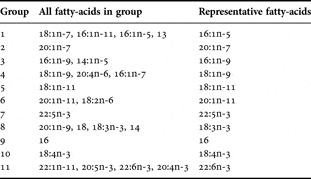
Using a PCA plot the 24 fatty-acids were separated into 11 separate groups or clusters and representative fatty-acids for each group were chosen for additive analysis (Table 3). The eigenvalues from the PCA indicate that axis one explains 37.7% of the variation in these data and axis two explains 22.5% of the variation. Together, both axes explain a total of 60.2% of the variation in the data. Fatty-acid groups 1 and 2, 3 and 4, 5 and 6 and 7, 8 and 9, 10 and 11 have vectors all pointing in a similar direction and are therefore positively correlated. Fatty-acid groups 1 and 2 have vectors pointing in opposite direction to groups 5, 6 and 7 and are therefore negatively correlated.
Grouping of 24 fatty-acids from the principal component analysis plot displaying the 11 representative fatty-acids selected.

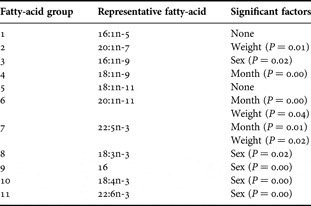
In order to ascertain which, if any, of the selected variables (weight, sex and season) had a significant effect on the fatty-acid profiles of the 13 harbour seal sampled, generalized additive modelling was carried out. Weight was found to have a significant effect on levels of fatty-acids representing groups 2, 6 and 7 (Table 4). Levels of fatty-acid 20:1n-7 initially increased with increasing weight, between 55 and 60 kg, and then fluctuated greatly with increasing weight above 60 kg. In contrast, levels of fatty-acids 20:1n-7 and 22:5n-3 decreased with increasing weight. Sex appeared to have a significant effect on the levels of fatty-acids representing groups 3, 8, 9, 10 and 11 (Table 4). Season had a significant effect on the levels of fatty-acids from groups 4, 6 and 7. Only two fatty-acid groups, 6 and 7, were significantly affected by more than one variable, both were affected by season and weight.
Summary of variables significantly affecting levels of representative fatty-acids in the optimal additive modelling.

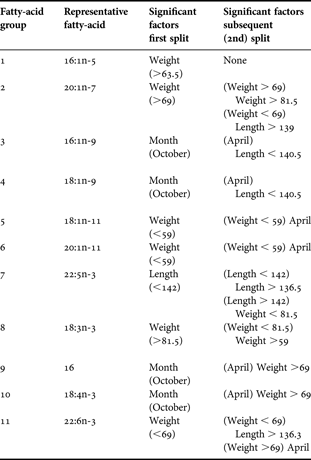
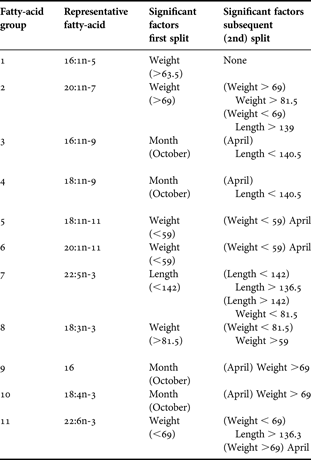
Regression trees were used to support the additive modelling as they are a further tool used to explore the relationship between a single response variable (the representative fatty-acids) and multiple explanatory variables. Weight was found to be the most important variable in the regression tree models, representing the first tree split of six fatty-acids (Table 5). Season was the most important variable in the regression tree models of three fatty-acids, while length was the most influential variable in just one fatty-acid (Table 5). Sex did not occur in the first or any of the subsequent splits of any of the fatty-acid tree models, and was therefore not considered an important variable here.
Summary of variables significantly effecting levels of representative fatty-acids in the optimal regression trees.
DISCUSSION
Harbour seal diet
This research, carried out in previously undocumented study areas in the Republic of Ireland, revealed that harbour seals consume a wide variety of prey species in relatively small amounts. A total of eighteen prey species were identified, with the diet consisting largely of sole (Solea solea), sandeel species, and Trisopterus species, collectively representing approximately 43.7% of the fresh weight consumed by harbour seals. Diet, in this study, was reconstructed solely from hard-part analysis of scat contents and the limitations of such methods are considered.
Presently, the identification of hard-parts, such as otoliths or bones, recovered from either faecal matter or digestive tracts are the methods principally used in determining the diet of harbour seals. As with other methods, this technique is not without its biases and cannot account for prey species with no hard-parts (Prime & Hammond, Reference Prime and Hammond1990). Fish with easily digested or damaged otoliths, for example salmonids, may be underrepresented, overlooked or missed totally during otolith identification. For this reason, in this study, the identification of bones was used to reduce biases associated with the total digestion of otoliths. Salmonids and Labridae species were identified solely from bone remains recovered from scats. These results were included in calculations for the numbers of prey species recovered, the frequency of occurrence and the index of importance. However, as the majority of the bones recovered from scats were damaged and as a result not measurable with any level of accuracy, results from their identification were not utilized in the determination of fish lengths and weights. As a result, some biases remain in the relative contribution of these prey items to the reconstructed diet.
Correction factors are employed in many studies (e.g. Silva, Reference Silva1999), including this one, to compensate for the partial digestion of otoliths as they pass through the digestive system. In general, the individual reconstructed size-ranges of many of the fish prey, in particular Trisopterus species and sole, even with the application of correction factors, suggests that seals are consuming mainly juvenile fish. As a result, it is difficult to determine whether or not the application of correction factors accurately estimated or overestimated the sizes of fish. Results may differ for different species of fish and for fish from different locations. However, no fish species, with the exception of ling and whiting, experienced an increase in average length of more than 36%. The % fresh weights of prey species were also affected by the application of correction factors, but to a lesser extent, with no species experiencing an increase of more than 4%. These results suggest that caution should be used when interpreting data to which correction factors have been applied. Specific correction factors for all species of fish recovered in this study were not available and average values were employed for many species (after Tollit et al., Reference Tollit, Steward, Thompson, Pierce, Santos and Hughes1997). The use of species-specific and location-specific correction factors is preferable and the estimation of specific correction factors for species of fish found in the waters off the west and south-west coast of Ireland would be important for future work in this area. Furthermore, equations used to reconstruct otolith size were from published data, which may also introduce bias, as suggested recently by Pierce et al. (Reference Pierce, Santos and Cerviño2007). In spite of these limitations, the present work provides new quantitative data on the dietary composition of harbour seals in the Republic of Ireland and can be used as a baseline for further work and to examine potential interactions with fisheries.
A further constraint inherent in scat analysis is the collection of adequate numbers of samples. In survey areas with small numbers of animals or areas that are not readily accessible to researchers, the recovery of large numbers of scats may not be possible during restricted study periods. Small sample numbers often hampers testing differences in diet between sites, years or seasons in ecological studies. For example, collecting too few scats increases the likelihood of not identifying a species that is consumed in low numbers; nonetheless, a small sample size can still provide some indication of dietary choices. While it is recognized that with a small sample size such as this it is difficult to draw definite conclusions from the statistically analysed data, at this stage, we are trying to find indications of effects on which to focus future more detailed studies.
In this study, we used accumulation curves to ascertain whether sampling was sufficient on a site basis. The ‘rarefaction’ curves provide a useful (informal) power analysis to determine if the level of sampling at each site was appropriate. Of the two sites examined, only the Clare site accumulation curve reached a definite asymptote, suggesting sufficient sample numbers (N = 50) to identify all prey species, but this was not the case at the Cork site (N = 25). The rarefaction curve also allows a comparison of species richness in the diets of seals to be examined on a comparable sample level. Seals at the Clare site appear to consume a greater variety of prey items than seals at the Cork site. This difference is possibly due to differences in prey assemblages at the two sites. Dedicated prey surveys, more information on seal foraging behaviour and their ranges at both sites are needed to substantiate this. An increased sampling effort at the Cork site, and a larger sample number, would also help to clarify the extent of this difference.
In this study, fish dominate the diet over molluscs and crustaceans, both by number and by occurrence. Bivalve molluscs occurred often within samples collected at both sites; however, it was believed that their occurrence was as a result of scat collection on the rocky habitat and was not considered to be an important part of the diet. Crustaceans were found in very small quantities and infrequently throughout all but one sample. It is possible that they are primary prey that is simply underrepresented in scats and digestive tracts, or more likely, a secondarily ingested prey. Cephalopod molluscs were also recovered infrequently in seal scat samples examined and represented only 0.2% of the entire diet by weight. Cephalopod beaks are thought to be retained in the digestive system of seals for extended periods of time and as a result it is expected they will be over-represented in reconstructed diets derived from digestive tracts. As beaks accumulated in the digestive tract may be eliminated by regurgitation rather in faecal matter, diets reconstructed solely from scat analysis, as in this study, may have an under-representation of cephalopod beaks.
Diet results obtained here are largely consistent with results from previous studies on the diet of harbour seals in other parts of their range. There is extensive overlap in the composition of fish species consumed by seals in this study, representing sites in the Republic of Ireland, and that of the only other published study of harbour seal diet carried out in Ireland, in Dundrum Bay, Northern Ireland by Wilson et al. (Reference Wilson, Pierce, Higgins and Armstrong2002). However, their relative contribution to the diet differs greatly, with whiting, haddock/pollack/saithe and flat fish such as plaice and flounder predominating in Dundrum and sandeel species, sole and Trisopterus species predominating here. Conversely, results here differ greatly from those obtained by Spitz et al. (in press) who looked at harbour seal diet at the southern limit of its European distribution. In that study, mullet (Mugilidae species), plaice (Pleuronectes platessa) and garfish (Belone belone) dominate the diet, and represent approximately 97% biomass of the overall diet. In contrast, harbour seals in this study were found to consume a wide variety of prey, with the three most predominant prey (sole, sandeel species and Trisopterus species) collectively representing only 47% of the diet biomass.
Studies in Scotland have shown seasonal variation in the diet of harbour seals. Pierce et al. (Reference Pierce, Thompson, Miller, Diack, Miller and Boyle1991) found a clear seasonal pattern in the diet of animals in the Moray Firth and Brown & Pierce (Reference Brown and Pierce1998) linked prey availability to the seasonal variation of the diet of the seals in south-east Shetland. Both studies attributed diet selectivity of the seals with the availability of prey. Unfortunately, in the present study, we were unable to accurately examine the diet on a seasonal basis due to the limited number of samples available. However, preliminary analyses suggest that there is little seasonal influence, which contradicts the results of the fatty-acid analyses and requires further study.
Interactions with fisheries
Sole, whiting, Trisopterus species, herring, sprat, scad, haddock/pollack/saithe, flounder, plaice, sandeel and ling are all caught commercially in Irish waters as food fish, for fishmeal, or by anglers. Landing values to Irish commercial fisheries from waters around Ireland were worth approximately €150 million in 2004 (FSS Stock Book, 2006) and annually the Irish seafood industry generates a total income of €702 million and employs 11,615 people (FSS Stock Book, 2007). While the majority of the prey of harbour seals in the waters off the south-west and west coasts of Ireland are not commercially important, sandeels are commercially fished for use in fishmeal production. This industrial fishery, however, is dominated by catches of blue whiting (Micromesistius poutassou) and not sandeel in Ireland (FSS Stock Book, 2006). Other prey species, which predominated in the diet of the harbour seals, were Trisopterus species, dragonet and sole. There is some overlap between the size-ranges of some fish species (e.g. sole, haddock/saithe/pollack, whiting and herring) recovered from seal scats with minimum landing sizes of commercial species as outlined in the FSS Stock Book (2007). Overall, it appears that when harbour seals consume commercially valuable species of fish, they do so in relatively small numbers and remove mainly smaller fish. An in-depth study of the availability of fish in the foraging areas of seals and a large scale and long term study of their diet is needed to better assess any potential conflict.
One area of the fishing industry in Ireland that comes into constant conflict with seals is the salmonid fishery. In this study, there is little evidence of the presence of salmonids in the diet. It is argued, as salmonids have notoriously fragile otoliths, that their presence can be overlooked, however, in this study bones were also used to identify the presence or absence of fish species. Despite the use of bones for identification purposes, salmonids occurred in only 3% of scats, suggesting that harbour seals are not targeting salmonids as a major part of their diet, and take these fish opportunistically and infrequently.
Fatty-acids
The assemblage of fatty-acids identified in this study was similar to those identified in previous studies on harbour seals in other parts of their geographical range (Iverson et al., Reference Iverson, Frost and Lowry1997; Anderson et al., Reference Anderson, Lydersen, Grahl-Nielsen and Kovacs2004). Of the twenty-four fatty-acids representing almost 93% by weight of the total number of fatty-acids identified, 70% were either primarily from dietary origin or can be synthesized by the marine animal itself and are highly influenced by the diet (Iverson et al., Reference Iverson, Field, Bowen and Blanchard2004; Learmonth, Reference Learmonth2006). They included fatty-acids 18:1n-9, 16:1n-7 and 22:6n-3, which together represented approximately half of the total % by weight.
In the present study the explanatory variable, weight, was shown to be positively correlated with fatty-acids that are influenced by diet, 16:1n-7 and 20:4n-6. Additive modelling and regression tree analysis indicated that weight had a significant effect on at least one of the representative fatty-acids and that it was one of the most influential explanatory variables. Results loosely concurred with work carried out on grey seals by Ridoux et al. (Reference Ridoux, Spitz, Vincent and Walton2007), which showed that variation between seal fatty-acid profiles could be explained by variation in the seals' body masses. It is probable that an increase in body weight may be associated with an increase in blubber thickness, which itself has been associated with dietary fatty-acid increase in other marine mammals (Learmonth, Reference Learmonth2006).
Both additive modelling and regression tree analysis indicated that the level of individual fatty-acid was, to some extent, influenced by when the samples were collected (October or April). Location has been shown to be an influential factor in the composition of harbour seal and grey seal fatty-acid profiles (Iverson et al., Reference Iverson, Frost and Lowry1997; Walton et al., Reference Walton, Henderson and Pomeroy2000; Ridoux et al., Reference Ridoux, Spitz, Vincent and Walton2007). We could not ascertain if this was the case in the present study as all blubber biopsies came from seals captured in the same location in south-west Ireland.
This baseline study of the fatty-acid signatures of harbour seals is the first of its kind to be carried out in the Republic of Ireland. Preliminary results indicate the effects factors such as seal size and sex as well as season, have on the fatty-acid profiles of these animals. Such information is vital to the overall understanding of the foraging ecology of the species in Irish waters. An increase in seal fatty-acid sample numbers and locations along with corresponding diet analysis using scats is recommended. Although Iverson et al. (Reference Iverson, Field, Bowen and Blanchard2004) have outlined a method called quantitative fatty-acid signature analysis (QFASA) to determine quantitatively dietary constituents from blubber fatty acids, the procedure still requires further feeding trials for calibration and optimization before it can be applied to wild populations.
CONCLUSIONS
This work presents the first quantitative and qualitative study of the diet of harbour seals in the Republic of Ireland. Examination of the scats collected during this study indicates that harbour seals in Ireland are opportunistic, generalist feeders, consuming a wide variety of prey, probably in relation to its availability, and with a low potential overlap with commercial fisheries. In future studies, the application of QFASA to seal blubber samples and those of their potential prey within their foraging area would enable a quantitative evaluation of the diet, augmenting these more traditional approaches to dietary analysis such as scat and stomach content analysis and yield valuable long term information on the foraging ecology of these animals. This current combination of information provides baseline data for further dietary and ecosystem studies and contributes valuable information to the assessment of seal–fisheries interactions.
ACKNOWLEDGEMENTS
Thanks for the assistance provided by staff of the National Parks and Wildlife Service of the Department of the Environment, Heritage and Local Government. Many thanks to the following who assisted in the field with seal captures and sample collection: Clare Heardman, Mark Jessop, Mick Mackey, Bernie McConnell, Declan O' Donnell, David Thompson, Allen Whitaker, Michael Carroll, Mike Sturt. Thanks also to Jane Gilleran and Dr Don Cotton for information on scat sampling sites. We are grateful for the comments and suggestions received from two anonymous referees, which improved this manuscript. The study was funded by the Marine Institute, Ireland, under the Strategic Marine RTDI Programme 2005.