INTRODUCTION
In the Philippines, Linckia laevigata, together with other marine species, is exploited for the marine ornamental and aquarium trade on a local and international scale. The Visayan seas are one of the biggest and most productive fishing grounds and are also a prime collection site for marine ornamental products in the Philippine Archipelago (PA) (Floren, Reference Floren2003). The Philippines are the second largest exporter of marine invertebrates, after Indonesia. Linckia laevigata is the most commonly exported sea star for aquarium trade, which accounted for 3% of the total international trade in invertebrates. The main importing countries from 1998–2003 were the USA, European Union and other Asian countries such as Japan, Hong Kong and Taiwan (Wabnitz et al., Reference Wabnitz, Taylor, Green and Razak2003). Five Visayan islands are identified as major shell collection sites (Cebu, Bohol, Negros, Masbate and Samar; Floren, Reference Floren2003) and are also possible sites for the collection of L. laevigata. The blue sea star is not included in the list of threatened and endangered species, thus no direct efforts on protection are imposed.
The marine ornamental fisheries need to be managed in such a way that they are biologically sustainable. Management tools, such as marine protected areas (MPAs), are considered important to reduce exploitation and to enhance fish catch and biodiversity for the sustainable use of marine resources (Palumbi, Reference Palumbi, Bertness, Gaines and Hixon2001). Suggested conservation efforts should be focused on establishing interconnected MPA networks to protect threatened populations and areas of rich marine biodiversity. It is essential that life history and dispersal capability of target species are understood and taken into consideration in designing the MPA networks (Palumbi, Reference Palumbi2003; Kochzius & Nuryanto, Reference Kochzius and Nuryanto2008; Timm & Kochzius, Reference Timm and Kochzius2008; Timm et al., Reference Timm, Planes and Kochzius2012). Knowledge on the phylogeographic structure of taxa is also important to define conservation priorities (Féral, Reference Féral2002). Connectivity among populations is an important factor for natural processes, such as metapopulation and community dynamics, community structure, and genetic diversity, but also plays an important role for the resilience of populations to anthropogenic impacts. The dispersal capability of a species coupled with oceanographic processes influences connectivity among marine populations (Cowen et al., Reference Cowen, Gawarkiewicz, Pineda, Thorrold and Werner2007).
Understanding the genetic population structure of a species can give insight into the connectivity of populations. A long pelagic larval duration (PLD) gives high probability of larval exchange among populations, leading to high gene flow and low genetic structuring among populations. Conversely, a short PLD limits gene flow and leads to genetic differentiation among populations (Bossart & Prowell, Reference Bossart and Prowell1998; Hedgecock et al., Reference Hedgecock, Barber and Edmands2007).
Past and present oceanographic and geological processes clearly influence the genetic structure of marine populations, e.g. in the Indo-Malay Archipelago (IMA). During Pleistocene glaciations the sea-level dropped by up to 120 m, exposing the shallow shelf areas of the region. This process formed land bridges and reduced shallow water habitats by exposing the Sunda and Sahul shelves, narrowing the Balabac Strait between Palawan, Borneo and Sulawesi, restraining water mass exchange among the South China Sea and Pacific Ocean as well as the Indian Ocean (Voris, Reference Voris2000). Studies on the population structure of the giant clams Tridacna crocea (Kochzius & Nuryanto, Reference Kochzius and Nuryanto2008) and T. maxima (Nuryanto & Kochzius, Reference Nuryanto and Kochzius2009), the anemonefish Amphiprion ocellaris (Timm & Kochzius, Reference Timm and Kochzius2008; Timm et al., Reference Timm, Planes and Kochzius2012) and the mushroom coral Heliofungia actiniformis (Knittweis et al., Reference Knittweis, Krämer, Timm and Kochzius2009) showed a complex genetic population structure, characterized by genetic breaks between the western, central and eastern IMA.
The PA is part of the Coral Triangle (CT) in the IMA, which is the area of the highest marine biodiversity. The PA is a biodiversity and endemicity hotspot (Roberts et al., Reference Roberts, McClean, Veron, Hawkins, Allen, McAllister, Mittermeier, Schueler, Spalding, Wells, Vynne and Werner2002) and the central PA shows a higher concentration of marine shore fishes than other areas in the IMA (Carpenter & Springer, Reference Carpenter and Springer2005). Despite this high biodiversity, studies on the genetic population structure and gene flow in marine taxa of the PA are rather rare. The few studies conducted investigated L. laevigata and T. crocea in Palawan (South China Sea and Sulu Sea; Magsino et al., Reference Magsino, Ravago and Juinio-Meñez2002; Juinio-Meñez et al., Reference Juinio-Meñez, Ravago-Gotanco, Magsino and Yu2003), T. crocea at the Western Pacific coast of the Visayas (Ravago-Gotanco et al., Reference Ravago-Gotanco, Magsino and Juinio-Meñez2007), the anemonefish Amphiprion clarkii in Cebu (Pinsky et al., Reference Pinsky, Montes and Palumbi2010), rabbitfishes along the eastern coast (Magsino & Juinio-Meñez, Reference Magsino and Juinio-Meñez2008) and the sea urchin Tripneustes gratilla (Malay et al., Reference Malay, Junio-Menez and Villanoy2000). Hence, information on connectivity of marine population within the PA and their connectivity to other regions in the IMA is limited.
The asteroid L. laevigata is widely distributed in the Indo-West Pacific (IWP), from Eastern Africa across South-east Asia and Australia to Samoa and Fiji. It is a conspicuous coral reef associated benthic species from the family Ophidiasteridae. The adults are sedentary and have a limited dispersal potential, because they belong to the slow-moving macrobenthos, creeping in corals and rocky crevices and migrating between reef patches for grazing on incrusted microscopic organisms and fine detritus. Linckia laevigata is a broadcast spawner and has a PLD of 22 days (Yamaguchi, Reference Yamaguchi1977), potentially enabling large-scale dispersal by ocean currents.
This view of large-scale dispersal in L. laevigata is supported by genetic studies in the Great Barrier Reef (Williams & Benzie, Reference Williams and Benzie1993) and the central IMA (including Cebu, Visayas; Kochzius et al., Reference Kochzius, Seidel, Hauschild, Kirchhoff, Mester, Meyer-Wachsmuth, Nuryanto and Timm2009), showing panmixia over distances of more than 1000 km. Only on an ocean-wide scale, could a significant differentiation between populations of the Indian and Pacific Oceans be detected (Williams & Benzie, Reference Williams and Benzie1997; Crandall et al., Reference Crandall, Jones, Muñoz, Akinrombi, Erdmann and Barber2008; Kochzius et al., Reference Kochzius, Seidel, Hauschild, Kirchhoff, Mester, Meyer-Wachsmuth, Nuryanto and Timm2009). However, investigations on a much smaller scale in Palawan (PA) revealed a low but significant differentiation (Juinio-Meñez et al., Reference Juinio-Meñez, Ravago-Gotanco, Magsino and Yu2003), indicating that probably local oceanographic and geographic conditions can limit connectivity among populations. In the Visayas, other taxa such as the anemonefish A. clarkii (Cebu) and the giant clam T. crocea (Eastern Philippine seaboard) also show restricted gene flow (Ravago-Gotanco et al., Reference Ravago-Gotanco, Magsino and Juinio-Meñez2007; Pinsky et al., Reference Pinsky, Montes and Palumbi2010).
In order to elucidate the pattern of connectivity within the Visayas and of this region to the IMA, this study investigates the genetic population structure of L. laevigata. In order to compare the results with a previous study on connectivity in the IMA (Kochzius et al., Reference Kochzius, Seidel, Hauschild, Kirchhoff, Mester, Meyer-Wachsmuth, Nuryanto and Timm2009), the analysis is based on partial sequences of the mitochondrial cytochrome oxidase subunit I gene (COI).
MATERIALS AND METHODS
Sample collection
Samples were collected from five sites around Samar and Leyte (Eastern Visayas), representing the Pacific side and the waters among the islands (Figure 1 and Table 1). This area is facing the fast flowing western boundary currents that split from the North Equatorial Current (NEC): the Kuroshio to the North and the Mindanao current to the South (Qu & Lukas, Reference Qu and Lukas2003; Qiu & Chen, Reference Qiu and Chen2010). As the NEC bifurcates at the Philippine coast, it significantly contributes to regional water mass transport into the Samar Sea, Gulf of Leyte, and Camotes Sea through the San Bernandino Strait in the North of Samar and Surigao Strait between Leyte and Mindanao in the South (Figure 1; Wyrtki, Reference Wyrtki1961).
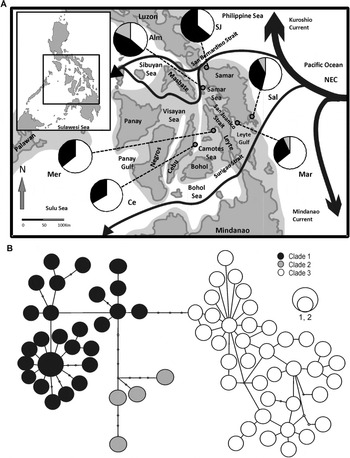
(A) Map of the Visayas (Philippines) showing the sample sites (for abbreviations see Table 1) as well as major ocean currents (Wyrtki, Reference Wyrtki1961) (NEC: North Equatorial Current). Pie charts represent the portion of clades at the different sampling sites as defined in the haplotype network. Pleistocene maximum sea-level low-stand of 120 m is indicated by the light grey area (Voris, Reference Voris2000). (B) Network of mitochondrial cytochrome oxidase I gene haplotypes. Data for Cebu are taken from Kochzius et al. (Reference Kochzius, Seidel, Hauschild, Kirchhoff, Mester, Meyer-Wachsmuth, Nuryanto and Timm2009). Large circles represent haplotypes and lines are mutational steps. Small circles between connecting lines indicate missing intermediate haplotypes.

Sample sites, number of sequence (n), number of haplotypes (Nhp), haplotype diversity (h) nucleotide diversity (π), Tajima's D, Fu's Fs, sum of square deviation (SSD), and Harpending's raggedness index (HRI) for Linckia laevigata in the Eastern Visayas, Philippines. Data for Cebu are taken from Kochzius et al. (Reference Kochzius, Seidel, Hauschild, Kirchhoff, Mester, Meyer-Wachsmuth, Nuryanto and Timm2009).

*0.05 ≥ P ≥ 0.01; **0.01 > P ≥ 0.001; ***P < 0.001; ns, not significant.
Tissue samples were taken by cutting off about 1 cm of the tip of an arm from 124 L. laevigata specimens. Sampling is not lethal and the starfish can regenerate the lost tissue. Among the three observed colour morphs (blue, orange and violet) only the blue morph was sampled and analysed, because species boundaries in Linckia are difficult to define (Williams, Reference Williams2000) and genetic studies indicated that colour variation is congruent to genetic variation (Williams & Benzie, Reference Williams and Benzie1998). Collected samples were preserved in absolute ethanol and stored at 4°C.
DNA extraction, amplification and sequencing
DNA from tissue samples was extracted using the NucleoSpin® Tissue extraction kit (Macherey Nagel) following the manufacturer's protocol. Amplification of the COI fragment was conducted with the universal DNA primers described by Folmer et al. (Reference Folmer, Black, Hoeh, Lutz and Vrijenhoek1994) through PCR in a 50 µl reaction volume. The PCR reaction contained 2 µl DNA template, 10 mM Tris-HCl (pH 9), 50 mM KCl, 0.2 mM dNTPs, 2 µl BSA (2 mg mL−1), 1U Taq polymerase, 0.4 µM of each primer and 1.5–2 mM MgCl2. PCR was conducted with a temperature profile of 94°C for 5 min, followed by 35 cycles of 1 min at 94°C, 1.5 min at 45°C and 1 min at 72°C. Final extension was conducted at 72°C for 5 min (Kochzius et al., Reference Kochzius, Seidel, Hauschild, Kirchhoff, Mester, Meyer-Wachsmuth, Nuryanto and Timm2009). Sequencing of both strands was done using the DyeDeoxy terminator chemistry (PE Biosystems) and an automated sequencer (ABI PRISM 3100, Applied Biosystems).
For the analysis of the genetic population structure in the Visayas, COI sequence data of a previous study (Kochzius et al., Reference Kochzius, Seidel, Hauschild, Kirchhoff, Mester, Meyer-Wachsmuth, Nuryanto and Timm2009) from Cebu were utilized. In order to infer connectivity of the Visayas to the IMA, this dataset was compared to COI sequences of 21 populations from the IMA (Table 2; Kochzius et al., Reference Kochzius, Seidel, Hauschild, Kirchhoff, Mester, Meyer-Wachsmuth, Nuryanto and Timm2009).
Samples sites with COI sequences from Kochzius et al. (Reference Kochzius, Seidel, Hauschild, Kirchhoff, Mester, Meyer-Wachsmuth, Nuryanto and Timm2009) that were included in the study on gene flow in the Indo-Malay Archipelago. CIMA, Central Indo-Malay Archipelago; EIO, Eastern Indian Ocean; WP, Western Pacific.

Genetic diversity
The software ChromasPro (version 1.5; Technelysium) was used to edit the sequences. The alignment was done with ClustalW (Thompson et al., Reference Thompson, Higgins and Gibson1994) as implemented in the programme BioEdit (version 7.0.9; Hall, Reference Hall1999). The sequences were translated into amino acid sequences using the programme Squint Alignment Editor (version 1.02; Goode & Rodrigo, Reference Goode and Rodrigo2007) to ensure that functional mitochondrial DNA was obtained and not a nuclear pseudogene. The sequence dataset was reduced to haplotypes with the programme DNA Collapse (FaBox; Villesen, Reference Villesen2007). Genetic diversity was analysed by calculating haplotype (Nei, Reference Nei1987) and nucleotide diversity (Nei & Jin, Reference Nei and Jin1989) with the programme Arlequin (version 3.5; http://cmpg.unibe.ch/software/arliquin3.5; Excoffier & Lischer, Reference Excoffier and Lischer2010).
Historical demography
The programme Arlequin was used to test the hypothesis of neutral evolution of the marker, using the Tajima's D test (Tajima, Reference Tajima1989) and Fu's Fs (Fu, Reference Fu1997). Mismatch distribution analysis and model of sudden population expansion (Rogers, Reference Rogers1995) was tested by estimation of sum of square deviation (Rogers & Harpending, Reference Rogers and Harpending1992) and Harpending's raggedness index (Harpending, Reference Harpending1994).
Genetic population structure
The programme Arlequin was used to conduct the analysis of molecular variances (AMOVA; Excoffier et al., Reference Excoffier, Smouse and Quattro1992) to test for significant population structure. PAUP (version 4.0b10; Swofford, Reference Swofford1998) and Modeltest (version 3.7; Posada & Crandall, Reference Posada and Crandall1998) were utilized to determine the appropriate evolutionary model and gamma shape parameter for the dataset used in statistical analysis: Kimura two parameter model (K2P) with a gamma value of 0.365. A hierarchical AMOVA was conducted to elucidate genetic variance among groups of populations, considering the oceanography and geography of the IMA. A haplotype network was calculated with the programme TCS (version 1.21; Clement et al., Reference Clement, Posada and Crandall2000).
RESULTS
Genetic diversity
A COI sequence alignment of 626 bp from 124 specimens of L. laevigata collected from five sample sites in the Visayas was obtained (Table 1). Among 124 samples, 81 haplotypes were observed, showing 51 polymorphic sites (8.2%) and 53 substitutions. The lowest number of haplotypes was observed in Merida and the highest in San Jose. Substitutions included 41 transitions and 12 transversions. Genetic diversity within each population showed a high level of haplotype and nucleotide diversity. Haplotype diversity was homogeneous for the entire dataset at a range of 0.98–0.99, whereas nucleotide diversity ranged from 1.4% in Merida to 2% in Almagro with an average of 1.6% (Table 1).
Historical demography
Based on the result of the Tajima's D test, the null hypothesis of neutral evolution of the COI marker could not be rejected for all sample sites, except for San Jose. However, Fu's Fs rejected the null hypothesis of neutral evolution at al samples sites (except Cebu), which could also indicate population expansion. Population expansion was supported by a mismatch distribution analysis and Rogers’ test of sudden population expansion (Table 1).
Genetic population structure
Since the published sequences by Kochzius et al. (Reference Kochzius, Seidel, Hauschild, Kirchhoff, Mester, Meyer-Wachsmuth, Nuryanto and Timm2009) were shorter than the one obtained in this study, the sequence alignment had a length of 473 bp, resulting in a reduced number of haplotypes. The haplotype network of L. laevigata from the Visayas shows the evolutionary relationship among the 69 haplotypes, which can be divided into three clades (Figure 1B). Clades were separated by three to four mutational steps and clade 1 is characterized by a star-like structure. Clade 1 and 3 were present in all sites and the latter was dominant at the majority of sample sites: Cebu, Merida, Marabut and Salcedo, whereas clade 1 showed a higher percentage in San Jose and Almagro. Clade 2 occurs only in Marabut, Salcedo and Almagro.
Analysis of molecular variance revealed genetic homogeneity among L. laevigata populations in the Visayas, with a ΦST-value of 0.009 (P > 0.05). The hierarchical AMOVA including sequences from Kochzius et al. (Reference Kochzius, Seidel, Hauschild, Kirchhoff, Mester, Meyer-Wachsmuth, Nuryanto and Timm2009) revealed the highest significant ΦCT-value (0.083; P = 0.004) for the following grouping: Eastern Indian Ocean, Central Indo-Malay Archipelago (including Visayas) and Western Pacific (Table 2).
DISCUSSION
Genetic diversity
The populations of L. laevigata sampled from sites in the Visayas showed a high genetic diversity. Levels of haplotype and nucleotide diversity (0.98–0.99; 1.4–2.0%) are comparable to the previous studies on L. laevigata conducted in the IMA using the same genetic marker (Crandall et al., Reference Crandall, Jones, Muñoz, Akinrombi, Erdmann and Barber2008; Kochzius et al., Reference Kochzius, Seidel, Hauschild, Kirchhoff, Mester, Meyer-Wachsmuth, Nuryanto and Timm2009). Similar values for COI haplotype diversity were observed in other invertebrates in the IWP, e.g. the starfish Protoreaster nodosus, the shrimp Periclimenses sorror, the ectoparasitic snail Thyca crystallina and the giant clams Tridacna crocea and T. maxima (Crandall et al., Reference Crandall, Jones, Muñoz, Akinrombi, Erdmann and Barber2008; DeBoer et al., Reference DeBoer, Subia, Ambariyanto, Kovitvongsa and Barber2008; Kochzius & Nuryanto, Reference Kochzius and Nuryanto2008; Nuryanto & Kochzius, Reference Nuryanto and Kochzius2009; Kochzius et al., Reference Kochzius, Seidel, Hauschild, Kirchhoff, Mester, Meyer-Wachsmuth, Nuryanto and Timm2009). However, nucleotide diversity was usually higher in L. laevigata than in the other taxa mentioned.
Historical demography
While the results of Tajima's D neutrality test rejected the null hypothesis of neutral evolution at only one sample site, Fu's Fs rejected it for all of them, except Cebu. This could indicate purifying selection or demographic expansion of L. laevigata populations in the study area. A mismatch distribution analysis and Rogers’ test of sudden population expansion (Rogers & Harpending, Reference Rogers and Harpending1992; Rogers, Reference Rogers1995) suggested that the population passed through a demographic expansion. This change in population size could be explained by Pleistocene glacial cycles, which caused changes in sea-level. In this period, a large area of the shelf in the PA was exposed. All the Visayan Islands were connected by land bridges with each other, as well as to Luzon in the North and Mindanao in the South (Figure 1;Voris, Reference Voris2000), thus reducing the habitat area. In the interglacial period, the rising sea-level opened an opportunity for new habitats to be colonized, which enabled growth of the reduced populations. This was also observed in populations of L. laevigata (Kochzius et al., Reference Kochzius, Seidel, Hauschild, Kirchhoff, Mester, Meyer-Wachsmuth, Nuryanto and Timm2009) and other species in the IMA, e.g. giant clams (Kochzius & Nuryanto, Reference Kochzius and Nuryanto2008; Nuryanto & Kochzius, Reference Nuryanto and Kochzius2009), anemonefish (Timm & Kochzius, Reference Timm and Kochzius2008; Timm et al., Reference Timm, Planes and Kochzius2012) and the parasitic snail Thyca crystallina (Kochzius et al., Reference Kochzius, Seidel, Hauschild, Kirchhoff, Mester, Meyer-Wachsmuth, Nuryanto and Timm2009).
Genetic population structure
The populations of L. laevigata in the Visayas did not show significant population structure. This suggests high gene flow among the sample sites, due to the high dispersal capability of the species. Preceding studies on L. laevigata have shown a shallow genetic population structure in the IWP based on RFLP data (Philippines, Indonesia and Western Australia; Williams & Benzie, Reference Williams and Benzie1997) and in the IMA using COI sequences (Crandall et al., Reference Crandall, Jones, Muñoz, Akinrombi, Erdmann and Barber2008; Kochzius et al., Reference Kochzius, Seidel, Hauschild, Kirchhoff, Mester, Meyer-Wachsmuth, Nuryanto and Timm2009). Other studies on invertebrates in the PA based on allozyme variation revealed homogeneity as well as fine scale genetic differentiation in the sea urchin Tripneustes gratilla (Malay et al., Reference Malay, Junio-Menez and Villanoy2000) and the giant clam T. crocea (Ravago-Gotanco et al., Reference Ravago-Gotanco, Magsino and Juinio-Meñez2007), which has a PLD of only 9 days. A study on the anemone fish Amphiprion clarkii based on microsatellite loci did not reveal a significant genetic structure among populations from Cebu and Leyte (Pinsky et al., Reference Pinsky, Montes and Palumbi2010). The long PLD of L. laevigata of about 4 weeks (Yamaguchi, Reference Yamaguchi1977) probably facilitates substantial gene flow and the lack of population structuring. For fish and invertebrate species having a planktonic phase of more than 2 days, over 50% of the variation in genetic dispersal estimates can be explained by the PLD (Kinlan & Gaines, Reference Kinlan and Gaines2003).
The haplotype distribution illustrates strong mixing in the region. Clades 1 and 3 were observed in all stations with highest frequencies. The region in the East is characterized by offshoots of the large bifurcating NEC, which significantly contribute to the inflow into the Visayan seas through the San Bernardino Strait in the North of Samar and Surigao Strait in the South of Leyte (Qu & Lukas, Reference Qu and Lukas2003). Fast flowing tidal currents in San Bernardino Strait and Surigao Strait are connected with several passages to feed the water exchange in the region (Wyrtki, Reference Wyrtki1961). These water transports could facilitate dispersal of propagules, which give rise to high genetic affinity of distant sample sites. The Visayas are composed of several adjacent islands, which possibly provide a more or less continuous habitat that is important for recruitment success. However, clade 2 was only found in the eastern part of the Visayas and did not occur in the central part (Cebu and Merida), indicating some differentiation. It is possible that the sample size was not sufficient to detect a significant genetic differentiation in the AMOVA. Further sampling would be necessary to verify if there is indeed a separation of populations from the central and eastern part of the Visayas.
The general structure of the haplotype network for populations of the Visayas was concordant with that of populations from the IMA (Kochzius et al., Reference Kochzius, Seidel, Hauschild, Kirchhoff, Mester, Meyer-Wachsmuth, Nuryanto and Timm2009), showing two major clades. This could be due to ancestral haplotype clades that had the opportunity for long-distance dispersal over several generations and therefore tend to be frequently occurring at large geographic range (Barber et al., Reference Barber, Erdmann and Palumbi2006). A star-like structure with a haplotype in a central position and radiating connections to other haplotypes is a characteristic of an ancestral haplotype (Horne et al., Reference Horne, Van Herwerden, Choat and Robertson2008), which is evident in the present study. Since clade 2 occurs at only three sites in relatively low frequency, these haplotypes might have evolved recently. However, it is also possible that these haplotypes originate in the Pacific to the east of the PA and are transported by the NEC. This clade was not detected in the previous study (Kochzius et al., Reference Kochzius, Seidel, Hauschild, Kirchhoff, Mester, Meyer-Wachsmuth, Nuryanto and Timm2009).
The significant structuring of populations in the IMA (including Visayas) and EIO is consistent with previous findings (Kochzius et al., Reference Kochzius, Seidel, Hauschild, Kirchhoff, Mester, Meyer-Wachsmuth, Nuryanto and Timm2009). The populations from the Visayas and IMA have a high affinity, which is supported by the higher ΦCT-value of the grouping that includes the Visayas in the group of the central IMA. This suggests high connectivity of the Visayas and the central IMA. A similar pattern was also observed in the black tiger prawn, showing no significant structure among western Pacific populations (Penaus monodon; Duda & Palumbi, Reference Duda and Palumbi1999).
The long PLD and prevailing hydrographic and geographic characteristics of the region explain the low level of genetic differentiation. The major drivers of water transport in this region are the seasonal surface water currents that are induced by monsoon winds and the Indonesian Throughflow (Wyrtki, Reference Wyrtki1961; Carpenter & Springer, Reference Carpenter and Springer2005), facilitating dispersal. Since these waterways were greatly reduced during Pleistocene sea-level lowstand (Voris, Reference Voris2000), mixing of clade 1 and clade 3 might have only re-occurred after the rise of the sea-level. According to Kochzius et al. (Reference Kochzius, Seidel, Hauschild, Kirchhoff, Mester, Meyer-Wachsmuth, Nuryanto and Timm2009), clade 1 can be assigned to the Indian Ocean, whereas clade 3 originates in the Pacific Ocean.
Conservation and management implications
In order to protect a part of the L. laevigata population from exploitation, the establishment of a MPA network in the Visayas is recommended, because the extent of connectivity and potential of re-colonisation from other regions of the IMA is not quantified. Such MPAs can serve as a source for new recruits in other areas of the Visayas, where L. laevigata is collected for the marine ornamental trade. Since L. laevigata shows high connectivity in the central Visayas, no special requirements for the spatial design of a MPA network have to be considered. Since some populations in the eastern Visayas show a higher genetic diversity in regard to clades (Almagro, Marabut and Salcedo), the establishment of MPAs in this region should be prioritised to protect the adaptive potential of L. laevigata in the Visayas.
ACKNOWLEDGEMENTS
We thank the institutions and individuals that have made this study possible: Office of the Municipal Agriculturist, Marabut, Western Samar; Office of the Municipal Agriculturist, Merida, Leyte; Carangian Fisherfolks Development Cooperative, San Jose, Northern Samar; Mr Emilio Cebu, Office of Provincial Agriculturist, Catbalogan, Western Samar; Marine Laboratory Institute of Tropical Ecology, Visayas State University, Baybay, Leyte, Philippines for support during sampling.
FINANCIAL SUPPORT
We thank VLIR-OUS for providing a ICP scholarship to D.S.R.A; and Vrije Universiteit Brussel (OZR2068BOF) for financial support.