Introduction
In 1996–97,Footnote † the Australian Government announced the Residential Aged Care Structural Reform package that included a range of initiatives to reform and restructure the residential aged care industry. Key components were the merging of the nursing home and hostel sectors, and the introduction of income-tested fees and entry contributions for nursing home residents. As well, a single classification scale and funding tool and accreditation and building certification systems were proposed. The Government considered that the reforms would deliver a better standard of care, and ensure that the residential care is affordable ‘for both individuals and for the community by asking those with a capacity to pay to make a contribution to their care and accommodation’ (Commonwealth Department of Health and Family Services, 1997: 159). Reform was considered necessary as the existing system was thought ‘to be incapable of responding effectively and efficiently to the changing needs of older Australians and the aged care industry’ (Gray, Reference Gray2001: 3). The purpose of this study is to evaluate whether the introduction of the fees and charges impacted on the average net price paid by residents.
Justification for the new fees and charges came from a recommendation by the National Commission of Audit (Howe, Reference Howe1998). The Commission considered that the demographic change expected in Australia over the next 50 years was likely to increase pressure on government spending, and thus proposed the phased introduction of ‘means-linked user charges and entry contributions for all of the aged residential sector’ (National Commission of Audit, 1996: 319). The Commission suggested that such measures would moderate the community’s future expectations of government assistance and more equitably share the cost of age-related services across the public and private sectors.
A further factor driving the proposed introduction of entry contributions for high-level care residents was a perceived crisis in capital investment in the nursing home sector. Before 1997, nursing home residents were not required to contribute to their accommodation costs, and although capital grants were available from the Commonwealth, in general, they were offered for a strictly limited range of works, mostly in relation to meeting building and fire safety regulations (Gray, Reference Gray2001: 82). As part of a broad review of the industry in the early 1990s, Gregory concluded that the funding system had failed to provide sufficient incentives for the maintenance and replenishment of the nursing home capital stock over time, and that there was a need for substantial improvement in the buildings. He estimated that an investment of $125 million was required to upgrade and subsequently maintain the quality of non-government homes (Department of Health Housing Local Government and Community Services, 1993; Department of Human Services and Health, 1994).
Before the changes, all nursing home residents paid the same price for their care and, as indicated, were not required to contribute to the cost of their accommodation. After reform, newly admitted permanent nursing home/high-level care residents could be charged the amounts based on their assessed capacity to pay. Where a new resident was determined as eligible to pay the new fees and charges, the Government reduced the subsidy it paid for the service providers on behalf of that resident. Conversely, where the resident was not required to pay a higher price, the Government compensated providers through the payment of supplementary benefits. It is clear that the aim was to increase the price that some residents paid while reducing the contribution by the Government on behalf of those residents. Although the sector continued to be primarily financed by government subsidies, the changes represent the introduction of a targeted user-pays approach to funding nursing home service provision.
Aspects of the proposed reforms caused extensive debate and angst in the community, and changes were made within weeks of being implemented on 1 October 1997. The most controversial feature was the requirement that newly admitted nursing home residents could be asked to pay an accommodation bond. There was no upper limit for the amount of the bond, but residents had to be left with assets of at least 2.5 times the amount of the basic age pension (Department of the Parliamentary Library, 1997). Providers were able to draw down a maximum amount per year from the bond ($2,600 per year for a maximum of five years), accrue the interest on the balance, and were to return the remainder to the resident or their estate on separation (Moylan, Reference Moylan1996). The scheme was to replace the Government’s capital funding programme, apart from an allocation of $10 million per year designated for special circumstances (e.g. facilities located in rural and remote areas; Department of Health and Ageing, 1996). It was estimated that the bonds would generate an annual income of approximately $130 million per year by the third or fourth year (Moylan, Reference Moylan1997). The initiative paralleled the approach that had been used in the hostel sector since 1989, where providers had been able to charge some residents, depending on their assets, an entry contribution. It has been argued that these funds enabled hostels to undertake capital-works programmes that allowed them to provide accommodation that was, in general, physically superior to that offered in nursing homes (Courtney et al., Reference Courtney, Abbey and Abbey2004).Footnote 1
There was a widespread opposition and resistance to the bonds, and it was suggested that in many cases, the family home may have to be sold in order to raise the required capital. Bonds in excess of $100,000 were reported. Following intense media coverage, vehement public opposition and a fall in popularity, from 6 November 1997, the Government replaced the bonds with a system of more modest, capped, daily accommodation charges (Department of the Parliamentary Library, 1997; Jones, Reference Jones1998; National Aged Care Alliance, 2002; Courtney et al., Reference Courtney, Abbey and Abbey2004).
The aim of this study is a positive, rather than normative, analysis of the impact of the changes to the pricing arrangements. Specifically, the objective is to determine whether the changes impacted on the average price paid. An increase in the average price paid after reform would indicate that at least a proportion of residents were paying higher prices than what was being paid, previously. To assess this, an intervention analysis has been conducted, and trends in the price pre- and post-reform are compared. Although the focus of the study is on the impact on prices paid, some broader implications of the changes are also considered.
Before outlining further details of the policy, it is useful to describe the amalgamation of nursing home and hostel sectors as this helps to clarify the terminology used in this study and some data issues. Before 1997–98, hostel and nursing home facilities were administrated and existed as separate entities, although some may have been co-located and/or co-owned. The feature that differentiated them was the population groups they each primarily catered for, that is, nursing homes provided care for frail aged people with high-care needs, whereas hostels provided for those requiring a lower level of personnel care or attention. As part of the 1997–98 reforms, the services were merged administratively and have since been jointly referred to as ‘residential aged care services’ (RACSs).
For funding purposes, RACS residents are classified in regards to their level of dependency. The ‘Residential Classification Scale’ (RCS), introduced as part of the reforms, is used to classify residents into one of the eight RCS categories in regards to their level of dependency. Those classified into RCS categories 5 to 8 are referred to as ‘low-level care’ residents, whereas those in categories 1 to 4 are referred to as ‘high-level care’ residents. Although there is no direct link between the RCS categories and the systems previously used by nursing homes and hostels to categorise residents, those in RCS categories 1 to 4 ‘have commonly been roughly aligned with nursing home care under the previous system and RCS categories 5 to 8 with hostel care’ (Australian Institute of Health and Welfare (AIHW), 2002a: 5). As such, this study is concerned with the average price paid by nursing home residents up to 1996–97, and that paid by high-level RACS residents from 1997–98. For convenience, the terms ‘nursing home’ and ‘RACS’ and ‘nursing home resident’ and ‘high-level care RACS resident’ are used interchangeably in this study.Footnote 2
It is important to note that the amalgamation of the sectors caused a discontinuity in the data typically used to describe/analyse the industry. That is, from 1997–98, many data relate to either all RACSs or all RACS residents, rather than just high-, or low-level care facilities or residents. The impact of this can be seen in the following. Data on the number of services and places/beds have been reported since 1997–98 in regards to all RACSs, whereas previously they were reported separately for nursing homes and hostels. As such, as of June 1997 (i.e. pre-reform), there were 1466 nursing homes providing 74,233 beds (or 48 per 1000 people aged 70 years and above; AIHW, 1998), but as of June 1998, there were 3015 RACSs providing 139,917 places (or 87 RACS places per 1000 people aged 70 years and above; AIHW, 1999). Other data series are similarly affected.
The Australian nursing home industry, past policies and price estimates
This section provides background on a number of issues. First, a brief overview of the industry is presented. Second, the policies that have determined the prices paid by residents over recent decades are described. Next, further details on the fees and charges introduced are given, and the impacts on the prices paid are calculated. Last, the effect of the changes on the average price paid is hypothesised.
Australia’s nursing home industry was established in 1963 following an amendment to the National Health Act 1953 that resulted in the Commonwealth Government paying institutions, designated as ‘approved nursing homes’, a benefit of 20 schillings per day on behalf of each resident. At the time, there were 902 homes (June 1963) providing 25,535 beds. In terms of ownership, 63% of beds were in privately owned facilities. The government and non-government sectors contributed approximately equally to funding with the Commonwealth providing 45% of expenditure in 1963–64, state and local governments 10% and individuals 43% (Commonwealth Director-General of Health, 1964; Deeble, Reference Deeble1967; Commonwealth Department of Health, 1969).Footnote 3
Currently, the Commonwealth Government is the primary funder of these services providing over 75% of expenditure for high-level care residents in 2005–06. Residents contributed 20%, whereas state and territory governments contributed <4%(AIHW, 2007a). Of non-governmental funding sources, fees and charges paid by residents accounted for nearly 98%. In terms of service provision, as of June 2008, there were 2830 mainstream RACSs providing 87.7 (high and low care) places per 1000 people aged 70 years and above (AIHW, 2009). In all, 33% of these places were provided by private for-profit organisations, 60% by religious, charitable or community-based organisations and 7% by state, territory or local governments (Steering Committee for the Review of Government Service Provision (SCRGSP), 2009).
Various policies have been implemented over recent decades to influence or control the price paid by nursing home residents. When the Commonwealth commenced subsidising the care of residents in 1963, there were no regulations as to what the homes could charge, and it was not until 1973 that initiatives to control prices were introduced. A system of ‘standard fees’ that covered the majority of prices charged at the time was established (Commonwealth Department of Health, 1981). Residents were required to pay a ‘standard patient contribution’, which was 75% of the single age pension plus the supplementary social services allowance.Footnote 4 The Commonwealth’s subsidy plus the patient’s contribution equalled the standard fee. Residents of homes charging the standard fee were required to pay no more than the standard contribution, whereas those in homes that charged more than the standard fee were required to pay the difference between the fee charged and the Government’s subsidy.
This system was operated from 1973 to 1991, but was simplified from the late 1980s, and from July 1991, all residents (except for a small minority who elected to occupy ‘exempt beds’)Footnote 5 paid the same price, that is, 87.5% of the single age pension plus rent assistance. This was the policy operating at the time when the 1997–98 reforms were implemented. The following text details the new charges and has been adapted from The Residential Care Manual (Commonwealth Department of Health and Ageing, 2002; Australian Government Department of Health and Ageing, 2005). Further details are available at http://www.health.gov.au/internet/wcms/publishing.nsf/Content/ageing-manuals-rcm-rcmindx1.htm-copy2.
First, from 1997–98, service providers were entitled to charge incoming permanent high-level care resident’s prices that depend on the resident’s income and assets. The Government continued to pay providers a subsidy on behalf of each resident, but adjusted this on the basis of whether or not the resident was liable for a particular fee or charge, and the maximum amounts of these fees and charges the resident was eligible to pay. As such, the Government’s contribution for individual residents became inversely related to the price that resident could be asked to pay. Existing residents were not required to pay the new fees.
More specifically, from October 1997, all residents have been charged a basic daily ‘care fee’, the amount of which is determined by the ‘resident’s contribution’ plus the (newly introduced) ‘income-tested fee’. There are two rates for the resident contribution, a pensioner rate (which is 85% of the base rate of the single age pension) for those receiving a part or full age pension,Footnote 6 and a higher non-pensioner rate. In regards to the income-tested fees, part and non-pensioners who entered an RACS for permanent care from March 1998, with income above specified thresholds, were potentially liable. Those eligible to pay could be charged up to 25 cents for each dollar of private income above an income test-free area, up to a maximum amount. The maximum care fee that a non-pensioner resident could be charged was/is limited to being three times the care fee that a resident receiving a full age pension (and therefore not required to pay income-tested fees) can be charged.
The rent allowance payment was not used in the calculation of the price to be paid from 1997–98. The Government ceased paying rent assistance to pensioners residing in RACS and instead increased the subsidy paid to providers (Costello et al., Reference Costello, Newman, Moylan and Scott1996). The impact of this is discussed in later sections.
In addition to care fees, for the first time, nursing home residents could be asked to contribute to the cost of their accommodation. Following the five-week period during which the accommodation bonds were able to be charged (i.e. 1 October 1997 to 5 November 1997), those entering permanent high-level care (from 6 November 1997) and assessed as having assets in excess of a minimum asset threshold level (of 2.5 times the annual single age pension) at the time of their admission could be asked to pay a daily accommodation charge. The amount of the charge depended on the value of their assets. Those with assets between 2.5 and 4 times the single age pension could be asked to pay the charge at a reduced rate. Such residents are referred to as ‘assisted residents’. Those with assets below the minimum permissible threshold could not be charged and are referred to as ‘concessional residents’. Those with assets above the threshold could be charged the maximum amount. All those asked to pay must be left with a minimum level of assets.
As an initial step in assessing the impact of the changes, some possible out-of-pocket prices that residents with varying levels of income and assets may have faced after the reform are calculated. The following are from (or have been derived from) a schedule of residential care fees and charges as of September 2007 (Australian Government Department of Health and Ageing, 2007).Footnote 7 As many different prices are possible (as sliding scales are used to determine the amounts that the service providers are entitled to charge), only some minimum and maximum prices are presented.

In general, P1 represents the minimum daily price for residents.




P 5 represents the maximum daily price that a resident could be charged as of September 2007. It equates to three times the minimum care fee, P 1, plus the maximum accommodation charge permissible at the time.


In comparing these amounts and accounting for the change to the rent allowance payment from 1997–98, for some residents the relative price is slightly less than what it would have been under the pre-reform arrangements (e.g. P 1 compared with P 7), whereas for others it is more than threefold greater (e.g. P 5 compared with P 7). Clearly, the policy has diverse financial implications for different residents. Also of note, after the reforms, the Commonwealth did not set the price providers are to charge residents, it only determined the maximum amount a resident can be charged. Thus, despite knowing the maximum amount that a provider is entitled to charge, it is not known whether such amounts were/are charged.
Whether or not the change in policy caused an increase in the average price will have depended on a number of factors including the proportions of residents paying relatively higher and relatively lower prices, the financial status of new residents,Footnote 8 the rate at which new residents are admitted, the period of time since the reforms and the motivations and behaviour of service providers and existing and potential residents. Thus, predicting the impact on the average price is not a straightforward task. If demand by those paying the higher prices is elastic and/or if only those paying the slightly lower (relative) prices use the services, then it is possible that there may have been a small (relative) decrease in the price after the reform (e.g. P 1 compared with P 7). However, if demand by those paying the higher prices is inelastic (as it may be for those with high-care needs), the outcome depends on the balance between the higher prices paid by some and a slightly lower price paid by others. Given the substantially higher prices that some residents may have been required to pay (e.g. P 5), and the fact that the proportion of residents paying higher prices is likely to have increased over time as new residents eligible to pay the new fees replace those admitted before the reforms, it is reasonable to suggest that the policy may have contributed to an increase in the average price paid. By considering this, it has been assumed that providers charged residents the maximum amounts of the fees and charges permissible.
However, it is difficult to anticipate when the policy may have affected the price, that is, immediately or after a delay, and/or if the impact was in the form of a one-off increase in the level of the price or a more gradual change in the price over time. These matters are now assessed empirically.
Estimation methods
Intervention analysis, a technique developed by Box and Tiao (Reference Box and Tiao1965, Reference Box and Tiao1975), generalises Box and Jenkins’ (Reference Box and Jenkins1970) univariate methodology by allowing the time path of the variable of interest to be influenced by an independent or exogenous variable (Enders, Reference Enders2004: 239). The technique has also been referred to as an impact assessment, impact analysis and an interrupted time series analysis. The model evaluated is composed of two components. First, an intervention component is determined, which is the hypothesised impact of the event modelled through the use of a dummy variable or linear term. The second component is a stochastic or noise component, which is a plausible ‘autoregressive moving average’ (ARMA) or ‘autoregressive integrated moving average’ (ARIMA) representation of the time series data on the variable of interest. Once the best-fitting ARMA/ARIMA process is established, the full model is estimated. A general specification of an ARIMA (p, d and q) intervention model (adapted from Enders (Reference Enders2004: 241–242) and Worthington and Valadkhani (Reference Worthington and Valadkhani2005)) has the form

where yt is the time series of interest; Δdyt represents the dth difference of yt (where ‘d’ indicates the number of times the data are differenced to obtain a stationary time series); μ is a constant; Ap(L) and βq(L) are polynomials in the lag operator ‘L’ of orders ‘p’ and ‘q’ (with the ‘p’ and ‘q’ parameters, the number of autoregressive (AR) and moving average (MA) components, respectively); Dt is the intervention variable; ‘c’ is a coefficient to be estimated, measuring the size of the impact; and, εt is a white noise process.
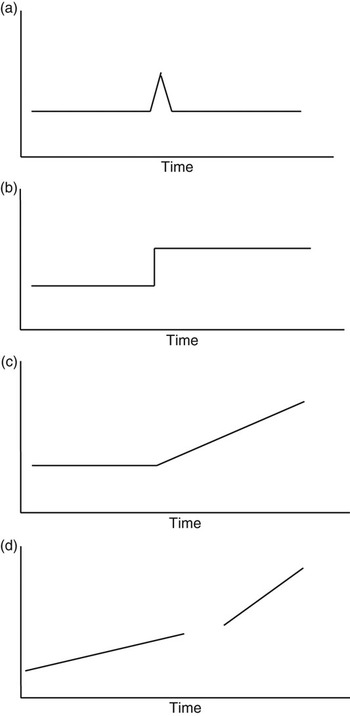
As the nature of the hypothesised impact on price is uncertain, four possibilities have been assessed through the use of four different intervention variables. That is, Model 1 includes a pulse function dummy variable (as the intervention component) to test for a temporary one-period change in the mean of the net price after the reform. Model 2 includes a step function dummy variable to evaluate whether the policy resulted in a permanent and constant change in the mean of the price. Models 3 and 4 test for constant linear changes in the price by the inclusion of linear terms, with Model 4 testing for a more gradual change than Model 3. The hypothesised impacts are illustrated in Figure 1 as a, b and c, respectively.
Hypothesised intervention impacts. (a) A temporary response, pulse function indicator; (b) a permanent response, step function indicator; (c) a constant linear response; (d) a change in the trend. Source: adapted from Box and Tiao (Reference Box and Tiao1975). Reprinted and adapted with permission from The Journal of the American Statistical Association. Copyright 1975 by the American Statistical Association. All rights reserved.

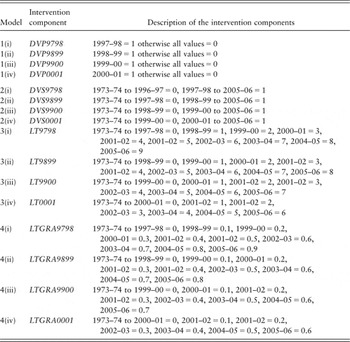
To allow for the possibility that there was a delay before the policy affected the average price (given that only some residents admitted after reform potentially had to pay the higher fees), four versions of each model have been estimated. The first version (of each model) tests for the impact to have occurred in the year in which the policy was implemented, that is, 1997–98. Three further versions of each model are estimated with the intervention component progressively lagged (i.e. Dt −1, Dt −2 and Dt −3). The intervention components used are given in Table 1.
Intervention components

DVP = dummy variable pulsed; DVS = dummy variable step; LT = linear trend; LTGRA = linear trend gradual.
The specifications for the models including LT9798 and LTGRA9798 are such that the origin of the impact was 1997–98.
The intervention analysis technique has strengths and weaknesses. First, it provides for flexibility in the modelling of the hypothesised impact (Pyle and Deadman, Reference Pyle and Deadman1993), and as such has been used to assess the impact of various events including the impact of the abolition of capital punishment on homicide rates (Deadman and Pyle, Reference Deadman and Pyle1993), the nuclear reactor accident in Chernobyl on tourism in Sweden (Hultkrantz and Olsson, Reference Hultkrantz and Olsson1997) and changes to the financial incentives on the use of psychiatric services (Doessel et al., Reference Doessel, Scheurer, Chant and Whiteford2007). However, the models are not based on economic theory and therefore provide no insight into the causal structure that may underlie the effect of the intervention (Hibbs, Reference Hibbs1977). A particular direction of causality is assumed (Enders et al., Reference Enders, Sandler and Cauley1990) and the technique relies on the assumption that the structure of the time series remains unchanged after the intervention, apart from the anticipated change modelled by the intervention term (Abraham, Reference Abraham1987). Last, the approach is susceptible to errors of inference as the impact may be due to an omitted variable that covaries with the intervention rather than being due to an event (as hypothesised; Hibbs, Reference Hibbs1977).
An analysis of the trend in the price before and after the policy’s implementation has also been conducted. This tests the hypothesis that there are two rates of linear change in the price, one pre- and one post-reform. The scenario is illustrated in Figure 1 (d), and to assess this, the following model is estimated:

where yt is the time series of interest; μ represents a constant; Et is a factor representing the intervention; Tt is a continuous linear regressor referred to as time; ETt is an interaction term between the intervention and time; βi s are coefficients to be estimated; and, εt is a white noise process.
This analysis differs from the intervention analysis in two ways. First, the time series pattern in the data is modelled using an unweighted least squares regression rather than through the inclusion of AR and/or MA terms. Second, as the aim of the analysis is to compare trends in the price before and after the reforms, the data are used in the model in levels. In contrast, in the intervention analysis trends in the data are removed so that the analysis assesses more specifically the impact of the changes. The coefficient of the interaction term (ETt) indicates whether the policy may have contributed to a change in the trend in the price after the reform. However, to understand the variables used, a confounding data issue is now described.
No time series data on the prices paid by nursing home residents are available. As such, estimates have been calculated using various data sets including AIHW data on expenditures by individuals on nursing home/high-level RACS services. However, in 1999–00, the AIHW changed the data source it used to determine these expenditures.Footnote 9 This has implications for the analysis as price estimates before and after 1999–00 may not be comparable. It is conceivable that the change in data source changed the level of the price from 1999–00, but it is unlikely that it changed a trend in the price. Thus, a finding in the intervention analysis of a change in price in or from 1999–00 is susceptible to errors of influence as effect from the policy and the effect from the change in data source cannot be differentiated, statistically.
To account for this truncated data sets (or time periods) have been used in the trend analysis. That is, data from 1990–91 to 1996–97 have been used as the pre-intervention observations, and data from 1999–00 to 2005–06 as the post-intervention data. Observations for 1997–98 and 1998–99 have been excluded so that all post-reform data can be deemed to be comparable (which would not be the case if data for 1997–98 onwards were analysed). As such, the intervention term Et is a dummy variable with the value of 0 for the pre-intervention period and 1 for the post-intervention period, the linear time trend Tt has the values 1, 2, 3, 4, 5, 6, 7, 10, 11, 12, 13, 14, 15 and 16 (values 8 and 9 are not used as they would correspond to data points for 1997–98 and 1998–99), and the interaction term ETt takes the value of 0 for the first seven observations and subsequently, 10, 11, 12, 13, 14, 15 and 16. By structuring the variables in this way, if the coefficient of ETt is significant, it is judged that the policy rather than the change in data source may have been the more-likely cause, Ceteris paribus. Only seven pre-reform observations are used as this allows trends over equal periods of time to be compared.
Price data and pre-estimation tests
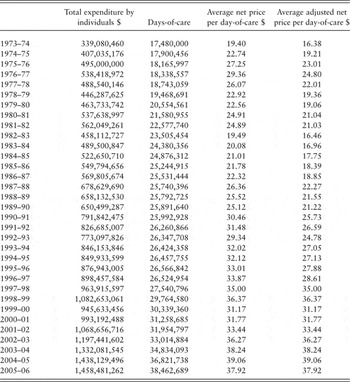
Two price data series, netprice and netpriceadj, from 1973–74 to 2005–06 are analysed. These have been constructed from data on expenditures by individuals on nursing home care and accommodation, and from estimates of the number of days-of-care provided by nursing homes.Footnote 10 Only estimates for 1973–74 onwards are used (in the intervention analysis), so that the pre-intervention period only includes years in which the Government was involved in determining prices that the residents could be charged.
The netpriceadj data have been constructed to account for the change in the rent allowance payment after the reform. As this allowance was no longer used in the determining the prices that the residents paid, irrespective of other effects from the reforms, removing the rent allowance from the calculation of the prices will reduce the estimate of the price paid, Ceteris paribus.Footnote 11 As this was more an administrative change rather than an initiative to alter the contribution by residents, its impact is not of specific interest in this study. Thus, the netpriceadj data have been derived to negate the impact of this on the price estimates. The netpriceadj data consist of the netprice data for 1973–74 to 1996–97 adjusted to exclude estimates of the amount the rent allowance added to the net price and netprice data for 1997–98 onwards. Data used in calculating the price estimates and the two price data series are given in Table 2.
Annual data on expenditure by individuals, days-of-care and netprice and netpriceadj estimates, 1973–74 to 2005–06, constant dollars (2005–06 prices)

Expenditures were converted from current to constant dollars (2005–06 prices) using the implicit price deflator for gross domestic product (Australian Bureau of Statistics, 2007). Unless otherwise indicated, further dollar values reported in the study are in constant dollars (2005–06 prices).
Sources: See text.
To avoid making spurious inferences, when analysing time series data, it is standard practice to assess the time series properties of the data before estimating the model. Results of unit-root tests indicate that both price data series are non-stationary in levels but stationary in first-differences, that is, they are [I(1)]. Accordingly, first-differences of the data and the intervention terms are used in the intervention analyses.Footnote 12
To determine the more-preferred ARIMA models, the Box–Jenkins approach to determine the time series models of the univariate data was used. That is, the correlograms of the pre-reform price data (in first differences) were examined. Initially, noise models appeared as possible specifications and were estimated. To assess the adequacy of these, each was successively over-fitted by the inclusion of an (extra) AR term, an (extra) MA term and an (extra) AR and MA term. On comparing the alternatives an ARIMA (0,1,1) specification was selected as the more-preferred option for both data sets. Results of the unit-root tests and the estimations of the preferred ARIMA models are not presented, but are available from the author.
Estimation results
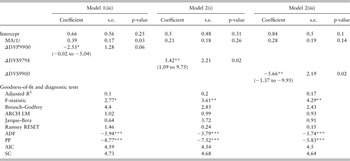
Only results for the netpriceadj data are presented as these are preferred, as it is judged that they allow for a more precise evaluation of the impact of the reforms on average prices. Results of models indicating that the policy was associated with a statistically significant impact on the netpriceadj are presented in Table 3. Results for the netprice data are available from the author.
Estimation of the intervention analysis models for the Δnetpriceadj data

MA = moving average; DVP = dummy variable pulsed; DVS = dummy variable step; ARCH = autoregressive conditional heteroscedasticity; LM = lagrange multiplier; ADF =augmented Dickey–Fuller unit root test; PP = Phillips–Perron unit root test; AIC = Akaike information criterion; SC = Schwarz information criterion.
‘Δ’ Indicates first-differences; the intervention terms are defined in Table 1; 95% confidence intervals are beneath the predicted prices values in parentheses; and ***, ** and * indicate statistical significance at 1%, 5% and 10%, respectively. The adjusted R 2 is the coefficient of determination adjusted for degrees of freedom. The F-statistic tests the hypothesis that all coefficients are zero. The Breusch–Godfrey LM statistic tests for serial correlation in the errors (with serial correlation in the first two lags assessed). The ARCH LM tests for autoregressive conditional heteroscedasticity in the residuals (with heteroscedasticity in the first lag assessed). The Jarque–Bera statistics is a χ 2 test for normality of the residuals. The Ramsey Regression Specification Error Test (RESET) is an F-test for specification error. The AIC and SC are criteria used in model selection. Eviews 6 was used in these estimations.
Significant outcomes for the netpriceadj data were found for Model 1(iii), indicating a temporary decrease in the adjusted price in 1999–00, and for Models 2(i) and 2(iii), indicating an increase in the adjusted price from 1997–98 and a decrease from 1999–00, respectively. By using standard statistical criteria to determine a statistically more-preferred model, Model 2(iii) would be selected on the basis of information criteria, whereas Model 2(i) has a higher adjusted R 2 value. However, given the data issue that may confound results indicating an effect in 1999–00, little confidence can be placed in the results of Models 1(iii) and 2(iii). The results of Model 2(i) are therefore preferred and indicate that the policy was associated with an increase in the average price from 1997–98 of $5.42 per day (95% CI $1.09 to $9.75).
It is useful to consider the analysis by taking a step back from the results of individual equations. As outlined, four models were estimated to test for different effects after reform, and different versions of the models were estimated to allow for delays in the impact. In relation to the netpriceadj data, statistical evidence of an impact was found in relation to Models 1 (which tested for a temporary change) and 2 (which tested for a permanent change in the price). The analysis did not find evidence of a linear change in the price after the reform as assessed for by Models 3 and 4. Significant effects were found in relation to 1997–98 (the year the policy was implemented) and 1999–00. However, there is inconsistency in terms of the direction of the impact with results indicating an increase in the average price in 1997–98 and a decrease in 1999–00.
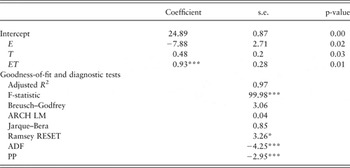
The results of the trend analysis of the netpriceadj data are presented in Table 4. They show that since 1999–00, the rate of increase in the price is greater than what it was before the reform. The average price is estimated to have increased by 48 cents a day per year (95% CI: 19–77 cents) between 1990–91 and between 1996–97, and by $1.42 a day per year (95% CI: 97 cents – $1.87) from 1999–00 to 2005–06.
Estimation of the trend in the netpriceadj data, pre- and post-intervention

ARCH = autoregressive conditional heteroscedasticity; LM = lagrange multiplier; ADF =augmented Dickey–Fuller unit root test; PP = Phillips–Perron unit root test.
As for Table 3 and see the text for explanations of the E, T and ET abbreviations.
A model including a second-order time effect was also estimated to test the possibility that prices have increased over time in a non-linear way. The effect was found to be non-significant. (These estimations are not presented but are available from the author.) Residuals from all equations are well-behaved.
Discussion and conclusion
Gruber and Wise (Reference Gruber and Wise2001: 1) have described the population-ageing phenomenon as the ‘single most important long-run fiscal issue facing the developed world’. Indeed, Torrey (Reference Torrey1982) suggested that in the future, the traditional economic trade-off between guns and butter may well be better characterised as a trade-off between guns and canes. Where governments control and subsidise the provision of aged care services as in Australia, decisions will have to be made in regards to what services to provide and how to fund them. To contain costs in the face of growing demand and rising expenditures, many governments have introduced or expanded the use of a user-pays approach to funding service provision. Past economic analysis of Australia’s aged care industry has been limited apart from the significant contributions by Gregory in the 1990s (see e.g. Commonwealth Department of Health Housing and Community Services, 1991; and Commonwealth Department of Health Housing Local Government and Community Services, 1993) and more recently by Hogan (Reference Hogan2004). This study seeks to contribute to the analysis of the sector by evaluating the effect of a policy that introduced a targeted user-pays approach to funding high-level RACSs in Australia.
Interpretation of the results of the intervention analysis of the netpriceadj data is not straightforward, given the inconsistent findings across the models. Although the weight of the statistical evidence points towards a decrease in the average price in 1999–00, this result is rejected for a number of reasons. First, it would seem illogical that the reforms would have brought about a decrease in the price two years after the policy was implemented, if it had not done so in the two years immediately after the reform. As well, the finding of a substantial decrease runs counter to the aim of the policy and to the changes implemented. Thus, it is judged that the change in data source was the more likely cause of the price decrease in 1999–00 rather than the reforms.
However, the analysis did find some evidence that the reforms were associated with an increase in the average price of more than $5 per day, from the year the policy was implemented. Such results accord with the policy’s objectives and the magnitude of the increase seems reasonable given the price estimates presented previously (i.e. P 1, P 2 etc.). The result indicates that some residents were paying relatively greater prices than what they would have, if the reforms had not been introduced. In addition, the finding implicitly indicates that the Government’s contribution on behalf of these residents will have reduced.
The finding of an increase in price from 1997–98 rather than a subsequent year can perhaps be explained by the frail health status of those using the services and consequently, the rate at which new residents are admitted to these facilities. Data for 1996–97 show that the average length of stay for 30% of residents was less than 12 months (AIHW, 1998). It is, therefore, likely that a relatively substantial proportion of residents in 1997–98 were admitted after the reforms were implemented. The results, therefore, suggest that a sufficient number of them must have paid the new fees and charges at amounts that caused an increase in the average price paid.
The trend analysis provides further evidence as to the possible impact of the policy. That is, while the price was increasing both before and after the changes, the rate of increase was greater after the reform. It is presumed that the reforms may have contributed to this outcome. However, the limitations of the analyses need to be acknowledged as they constrain the confidence with which the results can be considered.
First, the price data are estimates of the average price paid. Although it is difficult to judge the impact of this, the results should be interpreted with this in mind. Second, the relative lack of observations (especially after the reform) is an issue common to many time series analyses. The evolving nature of the policy (with the changes designed to only impact on some of those admitted after the reform) may have further compromised the limited post-reform data available. A reanalysis when additional post-reform observations are available may improve the robustness of the results. Third, although the results suggest that the new fees and charges may have increased the price from 1997–98, other variables may have been the cause. For instance, it is possible that factors determining the age pension could be the reason for the increase in price rather than the policy. Last, and although not a limitation, it must be remembered that this study has evaluated the impact on the average price paid. Thus, effects for individuals are masked.
The Australian Government’s broad objectives for delivering aged care services are efficiency, quality, equity and sustainability (Hogan, Reference Hogan2004: 10). Although the focus of this study is the impact on prices, it is useful to consider some of the broader implications of the policy. The reasons for this are both economic and social. First, the demand and supply of residential aged care services in Australia does not take place in a standard ‘economic’ market, and as such, factors that routinely determine market outcomes may or may not be as important. Second, access to services by frail aged people with high-care needs may be considered as a defining characteristic of a society’s values. Policies that may directly or indirectly impact on their access warrant our attention.
Residential aged care services in Australia are heavily regulated in regards to quality, quantity and price (Hogan, Reference Hogan2004: 79). Hogan suggests that aged care services are prone to market failure due (partially) to the substantial information asymmetries that exist between consumers and providers of nursing home services. Factors contributing to the imbalance include the impaired physical and/or cognitive capabilities of those seeking care, their (often) limited financial resources, a possible lack of family support, the frequently urgent nature of their admission and the relative infrequency with which they and/or their family would make such a ‘purchasing’ decision (Fraundorf, Reference Fraundorf1977; Weisbrod and Schlesinger, Reference Weisbrod and Schlesinger1986; Department of Health Housing Local Government and Community Services, 1993; Hirth, Reference Hirth1999; Hogan, Reference Hogan2004). Also, relevant information about the quality of care provided may not be readily observable and may only be established after the decision has been made to ‘consume’ the services. And, after having purchased and experienced the services, residents may still be disadvantaged as having accepted a ‘particular price-quality’ offering, they become locked into future consumption because of the high transaction costs involved with changing operators (Hogan, Reference Hogan2004: 239). Such characteristics do not concur with the idea of consumer sovereignty. Indeed, Fraundorf (Reference Fraundorf1977: 604, 607) has suggested that ‘there would seem to be no other subgroup of the population legally free to make decisions that falls as far short of the requisites of homo economicus as does the group comprised of nursing home patients’.
Because of the vulnerability of residents, the Australian Government has intervened extensively in both the provision and consumption of these services over many years. For instance, it has been the primary regulator and funder of the services for decades. Apart from intervening in regards to the welfare of residents, the Government has also intervened to constrain costs and to match services provided to the needs of residents (and potential residents). Specifically, it has controlled the supply of places since the mid-1970s,Footnote 13 and has determined ‘who’ is able access the services. That is, it introduced a gatekeeper system (i.e. Aged Care Assessment Teams) in the mid-1980s to ensure that only those determined as ‘eligible’ (i.e. met various need-related criteria) are able to use the services. Given the characteristics of those accessing the services and the regulations that pervade the industry, it is useful to consider the broader impacts from the changes to the price.
For those assessed as having the capacity to pay a higher price, the issue is one of affordability and choice. Given the criteria used to determine capacity to pay, it would seem reasonable to assume that those assessed as having the capacity would technically have the financial means to do so. Standard demand theory predicts a decrease in demand/utilisation in response to higher prices, but a small literature has produced mixed evidence. Studies by Chiswick (Reference Chiswick1976), Scanlon (Reference Scanlon1980) and Lamberton et al. (Reference Lamberton, Ellingson and Spear1986) reported significant price elasticities ranging from 0.76 to 2.3. In contrast, Reschovsky (Reference Reschovsky1996: 26) determined that ‘for the most part, the price of nursing home care, income and wealth … are not found to be associated significantly with demand’. Of note is that these studies were based on US populations where pricing arrangements and the availability and cost of alternatives may have little in common with the situation in Australia. Interestingly, Reschovsky (Reference Reschovsky1998) has subsequently evaluated the effect of a person’s level of disability on demand and reported price elasticities of 0.36 for those with higher levels of disability and 1.92 for those with less disability. He argued that as a person’s level of disability/dependence increases the financial and time burdens placed on family members may become untenable and thus, that price is less likely to be (as) important at higher levels of disability.
Given the care needs of those eligible to seek nursing home care, it was perhaps predictable that the results would indicate that the higher prices for those with an assessed capacity to pay may not have substantially reduced their use/demand, as implied by the finding of an increase in the average price paid. Those facing the new fees and charges may have had little option but to accept them as alternative care arrangements may not have been feasible. Such an outcome tallies with Reschovsky’s (Reference Reschovsky1996: 26) comment that nursing home care may be the care option of the ‘last resort’.
One outcome the policy is likely to have created (irrespective of the market structure) is an incentive for ‘wriggling’ behaviour.Footnote 14 When governments levy taxes, economic agents have an incentive to alter their financial affairs to reduce their potential financial liability. Such actions result in welfare costs, referred to as the excess burden of taxation. Undoubtedly, the policy provides an incentive for existing and potential residents to rearrange their financial affairs to reduce the price they would otherwise be required to pay. The extent and cost of such behaviour resulting from this policy are unknown.
For those not required to pay a higher price, concerns were raised before the implementation of the reforms about the possible impact on their access to care. The apprehension was that ‘financially disadvantaged people would have difficulty securing care places when providers could access additional funds through the admission of residents with greater means to contribute to their care’ (Gray, Reference Gray2001: 48). Cognisant of this the Government intervened and implemented various measures (as part of the reforms) to protect access for those on low incomes.
First, the Government structured the subsidy it paid to service providers to remove incentives that providers may have ‘to seek financially better-off residents’ by making the total income to providers from subsidies and care fees the same for all residents at a given level of dependency (Commonwealth Department of Health and Aged Care, 1999: 42). As stated previously, the Government compensated providers for residents not required to pay an accommodation charge at the maximum rate (i.e. concessional and assisted residents) through the payment of supplements. As well, to encourage the admission of concessional and assisted residents, the Government varied the rate at which it paid the supplements on the basis of the number of concessional or assisted residents the facility had provided care for since the reforms. In addition, regulations to protect access for those designated as having special needs, which includes financially disadvantaged people, were strengthened, with providers expected to meet regionally based target ratios for the number of concessional and/or assisted residents.
In a review of the reforms, Gray (Reference Gray2001: 50) concluded that ‘the Government’s concessional resident policy has achieved the objective of maintaining equitable access to residential care for financially disadvantaged people’. He based his conclusion on data from October 1997 to June 2000 in regards to the per cent of homes reaching regional targets, and the per cent reaching a concessional resident ratio of 40% or more. He noted that since 1998, all regions had met their regional target and that nearly 50% of all residents admitted since the reforms had been concessional residents. However, he qualified his analysis by acknowledging that it was difficult to compare the situation for financially disadvantaged people before and after the reform due to data issues. Although more recent data are available with which to consider issues of access, these are also constrained. For example, in 1996–97 over 85% of those admitted for permanent nursing home care and 63% of permanent residents received a government pension (AIHW, 1998). In 2006–07, 86% of those admitted (to an RACS) and 88% of residents were in receipt of a pension (AIHW, 2008). Even though the post-reform data relate to both high- and low-care residents and the situation for just high-care residents cannot be determined from the data, the per cent do not suggest any substantial decrease in access for those on low incomes.
Interestingly, a different picture is evident if post-reform data on the per cent of new admissions classified as concessional or assisted are reviewed. The per cent of new admissions so classified decreased from 56% in 1998–99 to 36% in 2006–07 (SCRCSSP, 2000; SCRGSP, 2008). Although this may indicate a substantial decrease in the admission of financially disadvantaged people, changes in how the data have been determined may also have contributed to the finding.Footnote 15 Given the inconsistencies in the available data, continued monitoring of the impact of the reforms on access to care for those with differing incomes is required.
A further issue is the impact of the reforms on the viability of the industry. If the higher prices reduced the demand for residential care the viability of some providers may have been at risk. Gray (Reference Gray2001) examined a number of factors to assess this, comparing the capital income estimated to be available for 1998–99 to 2007–08 from user charges and government grants, to the amount estimated to be required for that period. He also analysed the demand for new places by providers and investment in the industry after the reform. He concluded that in general, the industry was viable under the new arrangements, but some homes may require extra assistance.Footnote 16
Given the motivation for the new fees and charges, it is also relevant to assess whether the funding after the reform is more equitability shared across the public and private sectors, and whether the changes have enhanced the sustainability of the funding arrangements. Such issues are beyond the scope of this analysis, but it is interesting to note that the proportion of funds from the public sector has not diminished over the past decade. In 1996–97, the government sector provided 77.8% of recurrent expenditure and individuals provided 22% (AIHW, n.d.). By 2005–06, the shares were 79.3 and 20.3% respectively (AIHW, 2007a: 44).Footnote 17 Also noteworthy is a relatively small initiative introduced in 2004 to further extend the private sector’s contribution.Footnote 18 Such an action may be indicative that the Government considers that from its perspective, the current arrangements are unsustainable in the longer term.
Given the impacts ageing populations are likely to have in the future, the issue of funding aged care services is topical and likely to grow in political, social and economic importance over the coming decades. It is, therefore, important that policy initiatives such as the one analysed here are evaluated to determine whether the objectives were achieved, and to assess outcomes for those affected directly or indirectly. This analysis suggests that the Government may have succeeded to some extent in increasing the private sectors’ financial contribution to the services through increasing the price paid by some residents. Although this corresponds with the policy’s objective, the robustness of the result is tempered by limitations of the data. Although some distributional issues were identified, this study has not specifically assessed whether the policy affected the demand for care by those facing higher prices using a structural modelling framework. Such an analysis would be useful as it could have policy relevance for the demand for substitute services and for the care needs of those in institutional care. Greater knowledge on such issues is required if societies are to cope well with the demands of ageing populations. Additionally, a more specific analysis of the effect of the higher prices on demand/utilisation would be useful from a service planning perspective, as any reduction in demand for residential care will have implications for community service providers and informal carers.
Acknowledgements
I sincerely thank and acknowledge Darrel Doessel for his willing and enthusiastic assistance and guidance for this study, Joan Hendrikz for statistical advice and Luke Connelly for his useful suggestions. Earlier versions of this study were presented at the 6th European Conference of Health Economists, Budapest, July 2006, the 28th Australian Conference of Health Economists, Perth September 2006 and at the Australian Association of Gerontology 40th National Conference, Perth, November 2007. I also thank the participants and discussants of these conferences for their helpful comments. I would also like to thank the two anonymous referees for their many suggestions and insights. Their advice has led to a considerable improvement in the article. This research was partially completed whilst the author was receiving funding from the National Health and Medical Research Council.