Introduction
Bamboos constitute a large group of taxonomically related perennial grasses with significant economic and ecological importance. Worldwide, a total of 1662 species have been recorded under 121 genera (Canavan et al., Reference Canavan, Richardson, Visser, Le Roux, Vorontsova and Wilson2017), and 136 were reported to occur in India (ISFR, 2019). The bamboo genetic resources in India mainly belong to the tribes Bambuseae and Arundinarieae. The former comprises tall and giant bamboo taxa growing at an altitude below 1500 m, whereas taxa under the tribe Arundinarieae are shrubby with thin culms and grow in the subtropical and temperate zones of the western Himalayas between 1500 and 3500 m (Banik, Reference Banik and Banik2016). These hill-bamboos are commonly called ‘Ringals’ in the western Himalayas and serve as a major source of income for the tribals, nomads, pastoralists and artisans (ICFRE, 2017).
Yushania Keng, one of the largest genera of temperate woody bamboos under the tribe Arundinarieae, is distributed in the Himalaya-Hengduan Mountains region (Ye et al., Reference Ye, Ma, Yang, Guo, Zhang, Chen, Guo and Li2019). Along with other allied genera, namely Himalyacalamus Keng.f. and Thamnocalamus Munro, it forms a shrubby layer in the subalpine or alpine forests of the western Himalayas (Banik, Reference Banik and Banik2016), and plays a profound role in maintaining ecosystem functions and supporting the livelihood of forest dwellers. Yushania anceps (Mitford.) Yi (vernacular names: Jhamura or Sarora ringal in India and nigalo in Nepal) is a reed-like bamboo of the Indian Himalayan Regions (IHRs). This species has a non-clumping growth habit with elongated running rhizomes spreading on mountain slopes. The culms are erect and vigorous, 2–4 m tall, 0.5–1.5 cm diameter, 10–30 cm long thin-walled internodes and comprise upright, glossy, light-dark green drooping branches with narrowly lance-shaped leaves. In the natural habitat, it usually grows as patches in well-drained moist-fertile soil and forms undergrowth inside the broadleaved and coniferous woodland of Kumaon and Garhwal regions of the western Himalayas at an altitudinal range of 2100 to 2700 m (Banik, Reference Banik and Banik2016). Additionally, the species was introduced in Europe (Lin, Reference Lin1974; Bean, Reference Bean1981), Ireland and USA (Bahadur and Naithani, Reference Bahadur and Naithani1976) in the late 19th century.
Due to its desirable culm characteristics, the species has profound socio-economic importance, particularly in villages at high hills, where it has been used for various household applications (Banik, Reference Banik and Banik2016). In addition, it provides green fodder to wildlife and domestic animals during the lean period of winter. Commercially, the species is used for pulp and paper in England, where an estimate revealed that a well-managed plantation of the smaller clone yielded 2 tons per hectare annually (Bridge, Reference Bridge1973). In San Francisco Bay (USA), a private bamboo nursery sold a clone of Y. anceps, ‘Pitt White-YUANP’, at a price range of $60 to $120 (https://bamboosourcery.com/). Similarly, in the United Kingdom, the price of potted culms of Y. anceps ranges from £29 to £50 (http://www.uk-bamboos.co.uk/). These signify the socio-economic potential of the species in the global bamboo market.
Presently, the species is experiencing a serious decline in its natural habitat in the western Himalayas (Rather, Reference Rather2015). Moreover, earlier estimates also showed a declining trend. For instance, an area of about 130 km2 was recorded in the Garhwal region (Osmaston, Reference Osmaston1922), which was observed to be reduced in the later assessment by Tewari (Reference Tewari1992). Notably, endemic species confronting population decline are highly vulnerable to extinction and demand systematic assessment and conservation efforts (Pimm et al., Reference Pimm, Russell, Gittleman and Brooks1995; Lomba et al., Reference Lomba, Pellissier, Randin, Vicente, Moreira, Honrado and Guisan2010).
Species distribution modelling (SDM) provides an estimate for the geographical extent of species and implements computer algorithms for model-based prediction using environmental variables and geospatial data of species occurrence (Phillips et al., Reference Phillips, Anderson and Schapire2006; Elith and Leathwick, Reference Elith and Leathwick2009). Furthermore, SDM-based mapping allows evaluation of the potential impact of global climatic change (Thuiller et al., Reference Thuiller, Richardson, Pyšek, Midgley, Hughes and Rouget2005), demarcation of the potential distribution (Guisan et al., Reference Guisan, Broennimann, Engler, Yoccoz, Vust, Yoccoz, Lehmann and Zimmermann2006), inferring extinction risk (Benito et al., Reference Benito, Martínez-Ortega, Muñoz, Lorite and Peñas2009) and prioritization of conservation areas (Carvalho et al., Reference Carvalho, Brito, Crespo, Watts and Possingham2011).
Conversely, the conservation potential of an individual species is conferred by the genetic variability existed in its populations (Ramanatha Rao and Hodgkin, Reference Ramanatha Rao and Hodgkin2002; Porth and El-Kassaby, Reference Porth and El-Kassaby2014). Thus, population-level genetic characterization is an indispensable requirement for precise conservation and management. The molecular marker-based assessment generates a reliable dataset for genetic diversity and population structure, and the technique has been widely used in plants, including bamboo (Yang et al., Reference Yang, An, Gu and Tian2012; Ma et al., Reference Ma, Song, Zhou, Yang, Li and Chen2013; Nag et al., Reference Nag, Gupta, Sharma, Sood, Ahuja and Sharma2013; Nilkanta et al., Reference Nilkanta, Amom, Tikendra, Rahaman and Nongdam2017; Oumer et al., Reference Oumer, Dagne, Feyissa, Tesfaye, Durai and Hyder2020). Among various DNA-based markers, simple sequence repeat (SSR) or sequence-tagged microsatellite (STMS) markers are considered a robust technique for genetic analysis in plants due to their genomic abundance, high polymorphic potential, reproducibility and amenability to automation (Varshney et al., Reference Varshney, Graner and Sorrells2005; Pfeiffer et al., Reference Pfeiffer, Roschanski, Pannell, Korbecka and Schnittler2011). Recently, these have also been utilized for population genetic analysis in various bamboo species (Attigala et al., Reference Attigala, Gallaher, Nason and Clark2017; Bhandawat et al., Reference Bhandawat, Sharma, Singh, Seth, Nag, Kaur and Sharma2019; Meena et al., Reference Meena, Bhandhari, Barhwal and Ginwal2019; Huang et al., Reference Huang, Xing, Li, Zhou, Zhang, Xue, Ren and Kang2021; Pérez-Alquicira et al., Reference Pérez-Alquicira, Aguilera-López, Rico and Ruiz-Sanchez2021).
With the above background, the present study is contemplated to carry out spatial and genetic analysis in Y. anceps with the following objectives: (1) estimating the potential distribution of Y. anceps in the western Himalayas through MaxEnt modelling; and (2) deciphering the gene diversity and genetic structure in the natural populations.
Material and methods
Study area and data acquisition for SDM
The distribution record of Y. anceps in the western Himalayas was derived by reviewing secondary information available at various sources, like reports of the Forest Survey of India (ISFR, 2019), working plans of the state forest departments and the National Forest Library Information Center (NFLIC) at the ICFRE-Forest Research Institute, Dehradun. Afterward, the actual sites were surveyed in different forest ranges with the help of forest personnels. Field surveys were conducted in the Himalayan region under the states of Himachal Pradesh (HP) and Uttarakhand (UK) during 2017–2021. However, the targeted bamboo taxon could only be spotted in limited areas of the Garhwal (Chamoli district) and Kumaon (Pithoragarh district) regions in the Uttarakhand Himalayas (online Supplementary Fig. S1).
For the collection of geospatial data, multi-phase random sampling was carried out through an unbiased approach with zig-zag transects of 100 m. The Global Positioning System (GPS; Make Garmin, positional accuracy between 5–8 m) was used for geo-referencing and area demarcation. The geocoordinates and polygons were converted into the point shape file and keyhole markup language (KML) and visualized in Google Earth. Sampling bias was corrected by eliminating closely located 46 geo-coordinates that were either fallen into the grid of ~0.64 km2 spatially or 800 m apart linearly, and the remaining 62 points have been finally considered for MaxEnt modelling as per Rocchini et al. (Reference Rocchini, Hortal, Lengyel, Lobo, Jimenez-Valverde, Ricotta, Bacaro and Chiarucci2011). Further, 44 were used for training and 18 for testing the model output.
Additionally, 19 bioclimatic (30 s ~1 km2 spatial resolution; WorldClim Version 2.1), six climatic, three spatial analysts, direct normal irradiance (DNI) and pedologic variables were also retrieved from different sources. The DNI was downloaded from the Solar Energy Centre, Ministry of New and Renewable Energy (MNRE), Government of India (GoI), New Delhi (https://maps.nrel.gov), and the pedologic data were derived from the India Dataset of Soil and Water Assessment Tool (SWAT; https://swat.tamu.edu/data/india-dataset/). The Global Digital Elevation Model (GDEM) with a 30-m resolution of the Advanced Spaceborne Thermal Emission and Reflection Radiometer (ASTER) was used to generate aspect, elevation and slope (Hijmans et al., Reference Hijmans, Cameron, Parra, Jones and Jarvis2005). Further, the raster data sets were converted into Digital Number (DN) and cross-correlated variables were delineated using the software Statistical Package for Social Sciences (SPSS; ver. 16.0). Two cross-correlated variables with Pearson Correlation Coefficient (r) values greater than ±0.80 were identified (online Supplementary Table S1), and only one in each such pair was selected based on their percentage contribution and permutational importance in MaxEnt modelling driven by the response curve and Jackknife test.
Maxent modelling for the potential species distribution
The probabilistic distribution was estimated by running an open-access program, MaxEnt ver. 3.4.4 (Phillips et al., Reference Phillips, Anderson and Schapire2006; https://www.cs.priceton.edu) in which species occurrence data are mathematically correlated with environmental variables. The model features, such as linear, quadratic, product (0.050), categorical (0.250), threshold (1.000) and hinge (0.500), determine species responses to environmental conditions (Elith et al., Reference Elith, Phillips, Hastie, Dudík, Chee and Yates2011). Over-fitting and over-prediction of the model were reduced by setting the regularization multiplier value as 0.1 (Phillips et al., Reference Phillips, Miroslav and Schapire2004) with 5000 iterations and keeping other parameters as default (Young et al., Reference Young, Carter and Evangelista2011; Flory et al., Reference Flory, Kumar, Stohlgren and Cryan2012; Yang et al., Reference Yang, Kushwaha, Saran, Xu and Roy2013).
The model's performance was assessed through the ‘Area Under the ‘Receiver Operating Characteristics (ROC)’ Curve (AUC)’, calculated in MaxEnt which provides a single measure of model performance independent of any particular choice of threshold. Herein, the categorized models with AUC values >0.9 are considered highly accurate (Swets, Reference Swets1988). In addition, other classification accuracy measures, such as Kappa statistics (K), normalized mutual information (NMI) and true skill statistic (TSS), were derived manually from the confusion matrix generated in ArcGIS (Fielding and Bell, Reference Fielding and Bell1997; Allouche et al., Reference Allouche, Tsoar and Kadmon2006).
The output maps were first viewed in the World Geodetic System-84 (WGS-84) projection, which was later re-projected into the Universal Transverse Mercator (UTM) system with zone 44. Once the transformation was completed, a raster calculator was used to determine the area under the prediction output, and the final distribution map was overlaid on the satellite data scenes of SENTINEL (online Supplementary Table S2) and the Köppen-Geiger Climate Classification (KGCC) system (1976–2000) (Kottek et al., Reference Kottek, Grieser, Beck, Rudolf and Rubel2006).
Population sampling, DNA extraction and marker genotyping
For population genetic analysis, leaf samples were harvested from a natural distribution range in the Uttarakhand Himalayas. A total of 110 individual clumps from five geographical locations were sampled through the line transects method (online Supplementary Table S3), where two sampled individuals were 100 to 300 m apart at each location. To avoid sample deterioration and fungal contamination during long field tours, leaf tissues were desiccated with silica gel. The completely dried samples were stored at −80°C. The genomic DNA was extracted using the method given by Doyle and Doyle (Reference Doyle and Doyle1987) with minor modifications as per Krizman et al. (Reference Krizman, Jakse, Baricevic, Javornik and Mirko2006).
As SSR marker information was not available in the Y. anceps, the SSRs developed in another Indian temperate woody bamboo taxa, Drepanostachyum falcatum (Nees) Keng f., were tested for their cross-transferability (Meena et al., Reference Meena, Negi, Uniyal, Bhandari, Sharma and Ginwal2021). A total of ten successfully transferred polymorphic markers given in Table 1 were used for genotyping through polymerase chain reaction (PCR) amplification. Nine of these were genomic STMS markers developed in D. falcatum, and one was expressed sequence tags (EST)-based SSR identified in Dendrocalamus latiflorus (Bhandawat et al., Reference Bhandawat, Sharma, Sharma, Sood and Sharma2015). For PCR amplification, a reaction mixture was prepared by mixing 2 μl genomic DNA (50 ng), 1.8 μl enzyme buffer (10×), 1.8 μl MgCl2 (25 mM), 1.2 μl dNTPs (2.5 mM), 0.15 μl primers (20 μM) and 0.2 μl Taq DNA Polymerase enzyme (3 U μl−1) (Genei, India). Finally, a total reaction volume of 15 μl was constituted with nuclease-free sterile water. The PCR amplification was carried out in the thermal cycler machine (Eppendorf Mastercycler Nexus) with an initial denaturing step (95°C for 5 min) followed by 35 cycles of 94°C for 1 min, 48.1–62.3°C for 1 min and 72°C for 1 min and then final elongation at 72°C for 10 min.
Characteristics of 10 polymorphic SSR markers used for genotyping of Yushania anceps populations

Note: SSR loci indicated with asterisk (*) were excluded from the data analysis due to significant proportion of null allele frequency and high inbreeding
The fragment analysis was done through single-plex capillary electrophoresis using Nucleic Acid Analyzer (LabChip GX Touch 24, PerkinElmer, USA). Non-integer values of the allelic sizes generated by the machine were first transformed to integers using the power function and then binned as per the periodicity of repeat motifs of each marker locus using the software TANDEM ver. 1.07 (Matschiner and Salzburger, Reference Matschiner and Salzburger2009). Marker data were further evaluated for the presence of null alleles using the software FreeNA (Chapuis and Estoup, Reference Chapuis and Estoup2007), and SSR loci with a significant proportion of null allele frequency were excluded from analysis.
Marker data analysis for gene diversity, differentiation and genetic structure
The measures of gene diversity, viz., number of different alleles (Na), effective number of alleles (Ne), percentage of polymorphic loci (PPL), gene flow (Nm), observed heterozygosity (Ho) and expected heterozygosity (He), were calculated using the software GenAlEx ver. 6.5 (Peakall and Smouse, Reference Peakall and Smouse2012). The polymorphic information content (PIC) was analysed using PowerMarker ver. 3.25 (Liu and Muse, Reference Liu and Muse2005). Genetic differentiation among the studied populations was measured through the analysis of molecular variance (AMOVA), Wright's fixation index (F ST) and inbreeding coefficient (F IS) using the software Arlequin ver. 3.1 (Excoffier et al., Reference Excoffier, Laval and Schneider2005). Mean allelic richness (Ar) and private allelic richness (PAr) were calculated using the software HP-Rare ver. 1.0 (Kalinowski, Reference Kalinowski2005), which were further spatially exemplified over the distribution map using the inverse distance weighted (IDW) algorithm employed in the ArcGIS ver. 9.3 (Hengl, Reference Hengl2009; Chiocchini et al., Reference Chiocchini, Mattioni, Pollegioni, Lusini, Martin, Cherubini, Lauteri and Villani2016).
The genetic relationship among sampled populations was derived by clustering analysis through the unweighted pair group method with arithmetic mean (UPGMA) and the principal coordinate analysis (PCoA) using the software POPTREE2 (Takezaki et al., Reference Takezaki, Nei and Tamura2009) and GenAlEx, respectively. Further, the isolation by distance was examined by correlating pairwise genetic and geographical distances between sampled populations through the Mantel test (Mantel, Reference Mantel1967) in the software GenAlEx. Finally, the population genetic structure was deciphered through the Bayesian model-based clustering method using STRUCTURE software ver. 2.2 (Pritchard et al., Reference Pritchard, Stephens and Donnelly2000). Posterior probability [Pr(K)] was calculated for each set K-value from 1 to 5 using an ancestry model with admixture under the assumption of correlated allele frequencies. The model was run 10 times with 300,000 Markov Chain Monte Carlo (MCMC) sampling runs after a burn-in period of 300,000 iterations. The optimal K-value (ΔK) was finally determined using the web-based program Structure Harvester 0.6.92 (Earl and vonHoldt, Reference Earl and vonHoldt2012).
Results
Site geographical features and associated species of Y. anceps
The ground surveys revealed a rare and restricted distribution of Y. anceps in the sub-alpine zone of the western Himalayas of Uttarakhand. A total of 108 geo-coordinates of species presence were collected from five sites in Uttarakhand; two were in district Pithoragarh and three in Chamoli. This study has reported the geographical range of the Y. anceps extended from 29°50′ to 30°32′ in the north and 79°11′ to 80°39′ in the east, and altitudinally from 2300 m at Ghes (Chamoli) to 3200 m at Munsyari (Pithoragarh). The species inhabits the sites with 25 to 60° slopes and is mostly associated with evergreen forests of Abies spp., Acer spp., Picea spp., Quercus spp., Rhododendron spp., Taxus wallichiana, etc. However, in some areas of Pithoragarh, it has also been observed on the slopes of hilltops, where this is growing under treeline species like R. companulatum, Betula utilis, Tsuga dumosa, Abies spectabilis, etc.
Model performance and relative contribution of bio-climatic variables in SDM
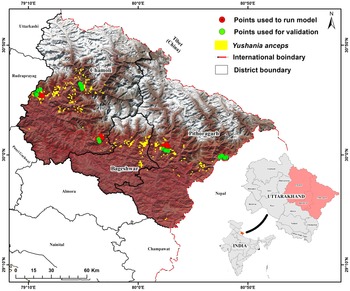
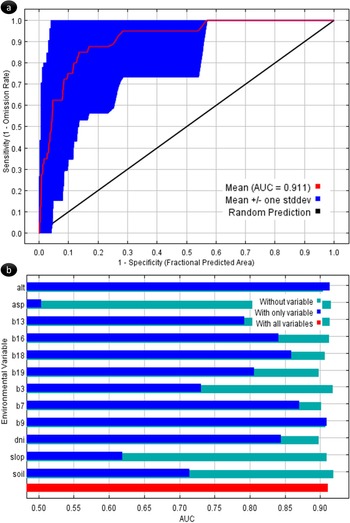
In the MaxEnt-derived probabilistic distribution, 77.78% of test data (14 out of 18 geo-coordinates) were suitably overlaid with the prediction threshold of 0.7 (Fig. 1). The higher AUC value (0.911 ± 0.13) has revealed optimal model performance with the best-fitting ability of the used bioclimatic variables (Fig. 2a). The model precision was further confirmed by the classification accuracy measures derived through the confusion matrix, such as K (0.513), NMI (0.447) and TSS (0.906) (online Supplementary Table S4).
Distribution map of Yushania anceps generated for three districts of Uttarakhand through MaxEnt modelling and overlaid over the satellite data scenes of SENTINEL

MaxEnt model output and performance indicators: (a) Model performances evaluated by the area under the receiver operating characteristic curve or AUC; (b) Jackknife test revealing relative importance of environmental variables

Based on the relative importance and permutations, the percentage contribution was assessed for each environmental variable (Table 2). The variables, namely annual temperature range (Bio 7), precipitation of the wettest quarter (Bio 16), precipitation of the coldest quarter (Bio 19), aspect (Asp), precipitation of the wettest month (Bio 13), precipitation of the warmest quarter (Bio 18), slope (Slop) and direct normal irradiance (DNI), showed the highest cumulative percentage contribution (~88%) and permutation importance (~79%). Besides, some other variables, such as soil and iso-thermality (Bio 3) and altitude (Alt), playing crucial roles in SDM were also considered. The Jackknife test (Fig. 2b) further elaborated that altitude (Alt) showed the highest gain when used in isolation, while the variable that decreases the gain most when omitted is Bio 7, signifying their imperative role in habitat prediction.
Per cent contribution and permutation importance of the environmental variables in MaxEnt modelling

Note: The variables marked with asterisk (*) were selected by multi-collinearity test and used in MaxEnt.
The response curves presented in online Supplementary Fig. S2 showed that the predicted probability of presence varies as the variable changes. Based on these curves, the annual temperature range (Bio 7) varied from 22 to 26°C, with a maximum probability (P) of presence between 22.2°C (P = 0.99) and 22.8°C (P = 0.80). The response curves of factor Bio 7 revealed that Y. anceps distribution ranges are affected by extreme temperature conditions, where the major effect has been observed due to the differences between the maximum and minimum temperatures of the warmest and coldest months, respectively. Similarly, precipitation played a critical role in determining habitat suitability, where the maximum probability of presence was found in areas with precipitation ranging from 800 to 1200 mm. Also, the rainfall requirement is higher in the warmest quarter (Bio 18) than in the wettest quarter of the year (Bio 16). Another important factor is aspect (Asp), which revealed most of the distribution inclined towards the north-eastern aspect. Other factors, such as altitude (Alt range: 2000–3000 m, maximum P = 0.9 at 2700 m) and direct normal irradiance (DNI: 17,200 Wm−2, P = 0.85) were also crucial in the SDM of Y. anceps.
Potential eco-distribution mapping and area estimation
Based on the environmental variables, the model has predicted the habitat suitability in the entire distribution range, but the final eco-distribution map was generated only for the area verified by ground-truthing, i.e., three districts of Uttarakhand. The predicted species distribution in these districts was overlaid on the satellite data scenes of SENTINEL (Fig. 1) and KGCC (online Supplementary Fig. S3). The KGCC map has displayed the distribution of Y. anceps into 4 out of 5 climate subtypes. Maximum species occurrence was found in subtropical highland oceanic climate (Cwb; C = warm temperate, w = winter dry and b = warm summer) and rainfed oceanic climate (Dwc; D = Snow, w = winter dry and c = cool summer) at upper zonation of the middle Himalayas in districts Chamoli, Bageshwar and Pithoragarh.
This study revealed an actual sampling area of ~53 km2 (1 km buffer zone) and an estimated area of ~212 km2 in the Uttarakhand Himalayas. Notably, the total estimated area is 0.40% of the total geographical area and 0.87% of the forest cover of the state (online Supplementary Table S5). Further, the eco-distribution map was superimposed on the Land Use Land Cover (LULC) map to estimate the area under different forest cover and altitudinal classes (online Supplementary Table S6). The area under very dense, moderately dense and the open forest was estimated to be ~60, ~116 and ~36 km2, respectively (online Supplementary Table S7). Altitudinally, the maximum probability of species occurrence was recorded between 2501 and 2700 m.
Gene diversity and population genetic structuring
Genotyping of 110 individuals with 10 STMS markers has generated a total of 148 alleles; the highest 26 alleles were generated by markers DfStm1144 and DfStm1651, while a minimum of 10 alleles each was displayed by DfStm55 and DfStm945 (Table 1). All the marker loci displayed high polymorphism with a mean PIC value of 0.707. The STMS locus DfStm-1144 displayed the highest polymorphism (PIC = 0.92), whereas the lowest was exhibited by the EST-SSR marker DGUMS25 (PIC = 0.37). The presence of null and inbreeding is a common problem in SSR marker genotyping, which may lead to misinterpretation of inbreeding or Hardy-Weinberg Equilibrium (HWE). Thus, all 10 analysed SSR loci were first examined for the presence of null alleles as well as inbreeding (Table 1). In brief, no evidence of null alleles was detected in most analysed SSRs except DfStm-56, DfStm-55 and DfStm-945. Likewise, positive values of the inbreeding coefficient recorded at some loci showed a sign of inbreeding. In order to minimize the errors, two SSR loci exhibiting higher null allele frequency and inbreeding, namely DfStm-56 and DfStm-945, were excluded from the final data analysis. Population-wise diversity indices calculated with eight SSR loci are depicted in Table 3.
The measures of gene diversity for sampled population of Yushania anceps

Being the key indicators of gene diversity, the mean values recorded for allelic richness (Ar = 4.24), observed heterozygosity (Ho = 0.658) and expected heterozygosity (He = 0.689) have depicted high genetic diversity in the Y. anceps metapopulation. The diversity maps generated by spatial overlaying of allelic richness and private allelic richness have displayed that the populations located in the Kumaon region captured relatively more gene diversity than the Garhwal region (online Supplementary Fig. S4a), and most of the populations of both regions harbour a significant proportion of unique alleles (online Supplementary Fig. S4b).
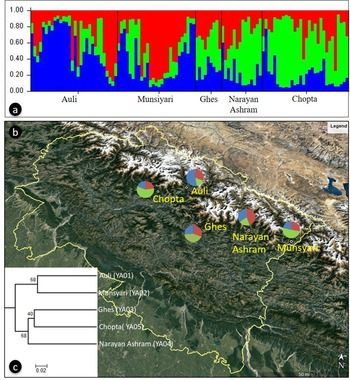
The AMOVA revealed that most genetic variance (93.77%) was restricted within the populations, and only 6.23% variance was recorded among the populations (online Supplementary Table S8). Inadvertently, gene flow is a key process involved in partitioning the genetic variance, which counteracts the genetic variation between the populations. Owing to high gene flow (Nm = 4.09) over a narrow distribution range, very low genetic differentiation (F ST = 0.062) was recorded among the experimental populations. Lower genetic differentiation was further supported by the results of genetic clustering and STRUCTURE analysis. In STRUCTURE analysis, the optimum K-value was determined to be three (online Supplementary Fig. S5) but none of the population has qualified to be assigned to any inferred cluster with a proportional membership coefficient of more than 0.70 (online Supplementary Table S9). As a result, a high level of genetic admixing was observed among the experimental populations [Fig. 3(a) and (b)]. It is conspicuously evident in the bar plot, where none of the three inferred clusters were clearly defined and all the populations displayed a significant proportion of individuals with mixed inferred ancestry.
Genetic structure of Yushania anceps metapopulation: (a) Bar plot illustrated the proportional membership coefficient for all the genotypes at K = 3 where each population is separated by vertical line and individual samples are represented by coloured bars; (b) Spatial representation of the inferred ancestry in sampled populations where yellow line shows the state boundary of Uttarakhand; (c) UPGMA clustering

In addition, the Mantel test revealed that the relationship between genetic and geographical distances was not significant and that the populations do not follow the isolation by distance (online Supplementary Fig. S6). As a result, the clustering pattern was not observed in accordance with their spatial distribution. Invariably, the UPGMA clustering displayed two major groups (Fig. 3c), first constituted by three populations, namely Ghes (YA03), Narayan Ashram (YA04) and Chopta (YA05), whereas the remaining two populations, i.e., Auli (YA01) and Munsiyari (YA02) were clustered in another group. A similar clustering pattern was also displayed by the two-dimensional PCoA plot, in which the first coordinate separated most populations, accounting for 58.33% of the genetic variance (online Supplementary Fig. S7).
Discussion
As envisaged in this study, a potential distribution map of Y. anceps has been generated through the SDM approach, and bioclimatic variables associated with habitat suitability have been identified. Likewise, SSR-based marker analysis revealed the baseline information on genetic diversity, differentiation and genetic structure of five experimental populations occurring in the Uttarakhand Himalayas. Both ecological and genetic information generated herein is crucial for devising a scientific programme for the conservation and management of the species.
Ground surveys and MaxEnt-based SDM revealed an endemic distribution of Y. anceps in the Uttarakhand Himalayas. In agreement with the earlier report by Bahadur and Naithani (Reference Bahadur and Naithani1976), species distribution has been verified in the western Himalayas, from the Jaunsar region of Uttarakhand through Chamoli in Garhwal to the source of the Pindar River in Kumaon. Previously, this species has been described with the synonyms Arundinaria jaunsarensis Gamble (Reference Gamble1896) and Chimonobambusa jaunsarensis (Gamble) Bahadur and Naithani (Reference Bahadur and Naithani1976), where the species name was derived from the place of occurrence, i.e., the Jaunsar region of Uttarakhand. Surprisingly, the healthy populations of Y. anceps could not be spotted in this region during our surveys. Instead, a sparse distribution was observed in the Deoban range of the Jaunsar region. This indicates a sign of population deterioration in the natural habitat. In addition, it has been observed that the populations occurring in both community forests and reserve forests are vulnerable to anthropogenic activities like grazing and manual harvesting; hence, they need conservation efforts.
MaxEnt-based SDM revealed that the variables related to precipitation (Bio 13, Bio 16, Bio 18 and Bio 19) and temperature (Bio 3, Bio 7 and Bio 9), along with other variables such as Asp, Slop and DNI, have an imperative role in defining the habitat suitability of Y. anceps (Table 2). It has also been observed in a recent study on its co-associate, D. falcatum, where the precipitation and temperature maximize the probabilistic distribution of hill bamboos in the western Himalayas (Meena et al., Reference Meena, Negi, Shankhwar, Bhandari, Kant, Pandey, Kumar, Sharma and Ginwal2023). Similarly, variables related to temperature and precipitation were also found important for the occurrence of six lesser-known temperate bamboo species in Meghalaya, India (Kharlyngdoh et al., Reference Kharlyngdoh, Adhikari, Barik and Upadhaya2016) and Phyllostachys edulis in China (Shi et al., Reference Shi, Preisler, Quinn, Zhao, Huang, R€oll, Cheng, Li and H€olscher2020). In another recent study carried out for SDM in a highland bamboo, Oldeania alpina (K. Schum) Stapleton in Ethiopia (Yebeyen et al., Reference Yebeyen, Nemomissa, Hailu, Zewdie, Sileshi, Rodríguez and Woldie2022), variables such as Bio 3, Bio 8, Bio 12, Bio 14, soil pH and soil CEC were identified as the key contributory variables for its habitat suitability.
The present study depicts an estimated area cover of about 212 km2 in Uttarakhand, with the maximum occurrence in moderately dense forests. In the earlier probable estimates, the species was predicted to cover about 130 km2 in the Garhwal region (Osmaston, Reference Osmaston1922), which was observed to be reduced in later assessments (Tewari, Reference Tewari1992). The natural habitats of Y. anceps are continuously dwindling, probably due to changing climates, anthropogenic activities and grazing pressures. The overlaying of the species distribution on the KGCC map has indicated that habitats with subtropical highland oceanic climate (Cwb) and subarctic climatic (Dwc) conditions are most suitable, where the species prevalence mainly depends on the monsoon. As demonstrated in several studies, SDM is an immensely useful approach for mapping the current and future species distribution, area prioritization and conservation (Carvalho et al., Reference Carvalho, Brito, Crespo, Watts and Possingham2011; Franklin, Reference Franklin2023). Hence, the eco-distribution map and the area estimates generated herein are of upmost importance to forest managers for the conservation and management of this valuable resource.
Further, SSR-based population genetic analysis in Y. anceps revealed a high genetic diversity, with most genetic variance existing within the populations. Consequently, the populations demonstrated negligible genetic differentiation with a subtle genetic structure, which could be anticipated in a narrowly distributed and open-pollinated plant taxa (Nybom and Bartish, Reference Nybom and Bartish2000). For instance, the amount of genetic variation scattered between the populations indicates the degree of differentiation, which tends to be high for the annual, self-pollinated and widespread taxa as compared to the long-lived perennial, open-pollinated and endemic taxa, respectively (Nybom and Bartish, Reference Nybom and Bartish2000). In general, bamboo is an open-pollinated plant with a mixed mating system (Chen et al., Reference Chen, Cui, Wong, Li and Yang2017; Xie et al., Reference Xie, Chen, Dong and Yang2019). Hence, the high genetic diversity with negligible differentiation recorded in Y. anceps could be attributed to its open-pollinated floral behaviour and endemic distribution in the Uttarakhand Himalayas.
In congruence with this study, a high genetic diversity with little genetic differentiation was also recorded in D. falcatum, which is one of its co-associates in the western Himalayas with a wide and abundant distribution (Meena et al., Reference Meena, Negi, Shankhwar, Bhandari, Kant, Pandey, Kumar, Sharma and Ginwal2023). Besides, low to medium genetic diversity was documented with varied level of genetic differentiation in some other bamboo taxa based on the threat perception imposed by various causes such as habitat degradation, overexploitation, anthropogenic activities, etc. For instance, natural populations of Dendrocalamus hamiltonii (a tropical woody bamboo) in northeast India were characterized by moderate genetic diversity, high genetic differentiation and significant genetic structure, which was attributed to their indiscriminate extraction (Bhandawat et al., Reference Bhandawat, Sharma, Singh, Seth, Nag, Kaur and Sharma2019; Meena et al., Reference Meena, Bhandhari, Barhwal and Ginwal2019). Likewise, moderate to high genetic diversity and differentiation were also recorded in Chinese bamboo taxa, namely P. edulis (Jiang et al., Reference Jiang, Bai, Dai, Wei, Zhang and Ding2017) and D. sinicus (Yang et al., Reference Yang, Dong, Wong, Gu, Yang and Li2018). Moreover, high genetic admixing observed in STRUCTURE and cluster analysis could be possible due to significant gene flow within a smaller distribution range, either through pollen as well as vegetative propagule, because of the sporadic and massive synchronized flowering recorded in the genus Yushania and strong capability of asexual reproduction (Zheng et al., Reference Zheng, Lin, Fu, Wan and Ding2020).
Conservation implications
The present study revealed an endemic distribution of Y. anceps in the Uttarakhand Himalayas, where precipitation and temperature play an imperative role in defining habitat suitability. Hence, the taxon needs to be periodically assessed for population structure and threat perception. Moreover, the maps and area estimates generated in this study could serve as valuable resources in the planning and execution of future conservation programmes. The high level of genetic diversity with insignificant structuring detected in this study revealed substantial adaptive potential in the natural populations. Nevertheless, conservation efforts are still warranted due to the sparse and endemic distribution.
Being a diversity hotspot, populations in the Kumaon region could be prioritized first for immediate conservation, either in situ or ex situ. Besides, smaller populations need to be enhanced up to the standard effective size for maintaining higher genetic diversity and avoiding the deleterious effects of genetic drift. Considering lesser genetic divergence and insignificant genetic structure, the entire range could be treated as a single management unit. In addition, the forest manager needs to focus on the expansion of the area under Y. anceps through manual plantations or farm cultivation.
Supplementary material
The supplementary material for this article can be found at https://doi.org/10.1017/S1479262123000825
Data availability
The additional data required to understand the manuscript is available in the supporting information of this manuscript.
Acknowledgements
The work was financially supported by the Indian Council of Forestry Research and Education (ICFRE) via a project grant (number: OG-49/CR-19). The authors are thankful to the Director, Forest Research Institute, Dehradun, for providing facilities for laboratory and field work. We extend our sincere gratitude to the state forest departments of Uttarakhand and Himachal Pradesh for providing the necessary permissions for surveys and sample collection. Suggestions obtained from anonymous reviewers are highly appreciated.
Competing interest
None.