


Introduction
Snow surface temperature and near-surface air temperatures on polar ice sheets show pronounced seasonal cycles and significant interannual variations. These short-term variations are significantly dampened with depth, while decadal and longer temporal variations are maintained as a climatic record of temperature. for example, previous analysis of the temperature–depth variation at Summit, Greenland, showed a minimum temperature of –31.5˚C at 130 m, corresponding to about AD 1659 (Reference Alley and B.R. KociAlley and Koci, 1990). Seasonal and interannual variations in firn temperature also drive changes in the rate of firn densification, which causes changes in the snow surface, as detected by satellite radar altimeter (Reference Li and ZwallyLi and Zwally, 2002; Reference Zwally and JunZwally and Li, 2002). In this paper, we use the continuous surface temperature record compiled from automatic weather station (AWS) and passive-microwave data by Reference Shuman, Steffen, Box and StearnsShuman and others (2001) for the Summit region over the period 1987–99 to derive the corresponding firn-temperature evolutions with depth.
The Model
We follow the standard time-dependent heat-transfer equation (cf. Reference PatersonPaterson 1994, p. 224), which in one dimension can be written:

where ∂T/∂t is the change in firn temperature T with time t at depth z, ρ is density, c is heat capacity of ice, K is thermal conductivity, w is vertical velocity and f is internal heating. Thermal properties of ice and firn used in the model are computed from the relations given by Reference PatersonPaterson (1994, p. 205). Thermal conductivity (K) for firn as a function of the density is calculated using Reference SchwerdtfegerSchwerdtfeger’s (1963) equation:

where Ki is thermal conductivity of ice and ρi is the density of ice (917 kg m–3). We use Reference SchyttSchytt’s (1958) empirical density– depth relation adjusted according to field density measurements to calculate variations of firn density with depth:

In Equation (3), ρ(z) is firn density at depth z, ρs is the density of surface snow (350 kg m–3) and the constant C is taken as 0.029 m–1 to give the best fit to the available field data collected in the Summit region (Reference GowGow and others,1997;Reference Hamilton and WhillansHamilton and Whillans, 2000).
Vertical velocity (w) is calculated according to the Reference Dansgaard and S.J. JohnsenDansgaard and Johnsen (1969) model by using a constant accumulation rate of 250 kg m–2 a–1 (Reference Zwally and JunZwally and Li, 2002). Internal heating ( f) is neglected in this analysis by assuming that f is smaller than the coefficients of ∂T/∂t by at least three orders of magnitude (Reference Van Ommen, Morgan, Jacka, Woon and ElcheikhVan Ommen and others, 1999).
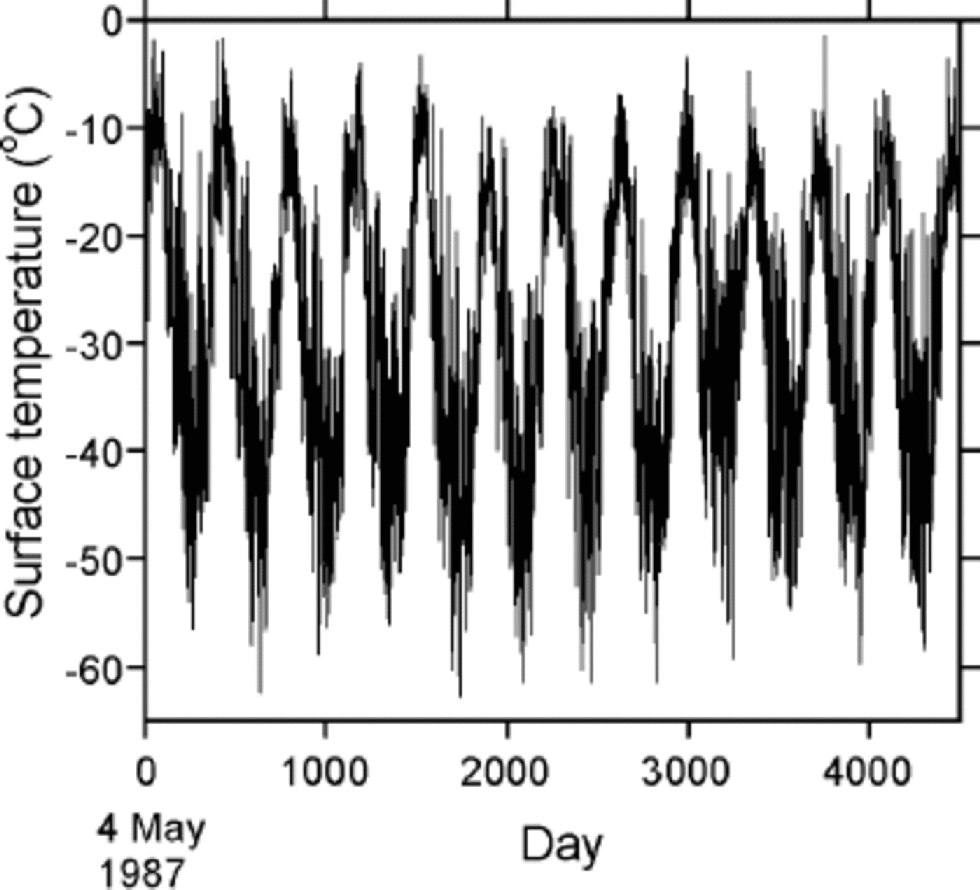
To solve Equation (1) two boundary conditions are needed: the upper boundary (the driving temperature), the temperatures at the snow surface; and the lower boundary (at which the temperature is considered to be constant), a known temperature at a certain depth. Figure 1 shows the driving surface temperature used in this study. This time series of the temperature over the period 1987–99 was derived from AWS and passive-microwave data for the Summit region (Reference Shuman, Steffen, Box and StearnsShuman and others, 2001). for the lower boundary, we chose the measured Greenland Ice Sheet Project 2 (GISP2) borehole temperature at 30m depth (–31.4˚C; Reference Alley and B.R. KociAlley and Koci, 1990). This depth choice is sufficient to avoid any effect of penetration of the surface temperature wave during the 12 years on the lower boundary condition, as confirmed by several numerical tests.
Daily variations of surface air temperature for Summit, May 1987–October 1999 (after Reference Shuman, Steffen, Box and StearnsShuman and others, 2001).
Results and Discussion
The surface driving temperature for the Summit region over the period 1987–99, on a daily basis, is shown in Figure 1. the temperature fluctuates within the maximum range between approximately –60˚ and close to 0˚C, exhibiting clear annual cycles with an average range of about 55˚C. A distinct cooling period occurs in 1992. In this period the mean annual temperature (Tm) and mean summer temperature ( 1 June–31 August) is >4˚C lower than the average. Tm is averaged from 1 September to 31 August of the following year. the temperature decreases from 1987, reaching a minimum in 1992, and then gradually increases until 1999. the cooler temperatures in 1992 in Greenland have been attributed to a cooling associated with the Mount Pinatubo (Philippines) eruption (Reference Abdalati and SteffenAbdalati and Steffen, 1997). the mean annual temperature and summer temperature averaged from 1987 to 1991 approximately are –28.4˚ and –12.8˚C, compared with –29.3˚ and –15.0˚C for 1993–99.
Driven by this surface temperature variation, Figure 2 illustrates the modeled firn-temperature changes at several selected depths over the corresponding period. At 3 m depth, the range of the firn temperature is attenuated to 25% of the surface value. As expected, the range of the seasonal variation significantly reduces with depth from 27.7˚C at 1m to 0.61˚C at 15 m (Table 1). Nevertheless, the residual ranges of 1.66˚C at 10 m, and 0.61˚C at 15 m, indicate that significant corrections to measured borehole temperatures at these depths are required to obtain the mean annual surface temperature. Over the period 1987–99, the annual mean surface temperature is –29.3˚C. At lower depths the means are –29.9˚C at 10 m, –30.1˚C at 15 m, and –31.4˚C at 30 m, which approaches the fixed and colder lower-boundary condition obtained from the borehole measurement.
Variations of firn temperature computed at several depths above 15 m for Summit, May 1987–October 1999.
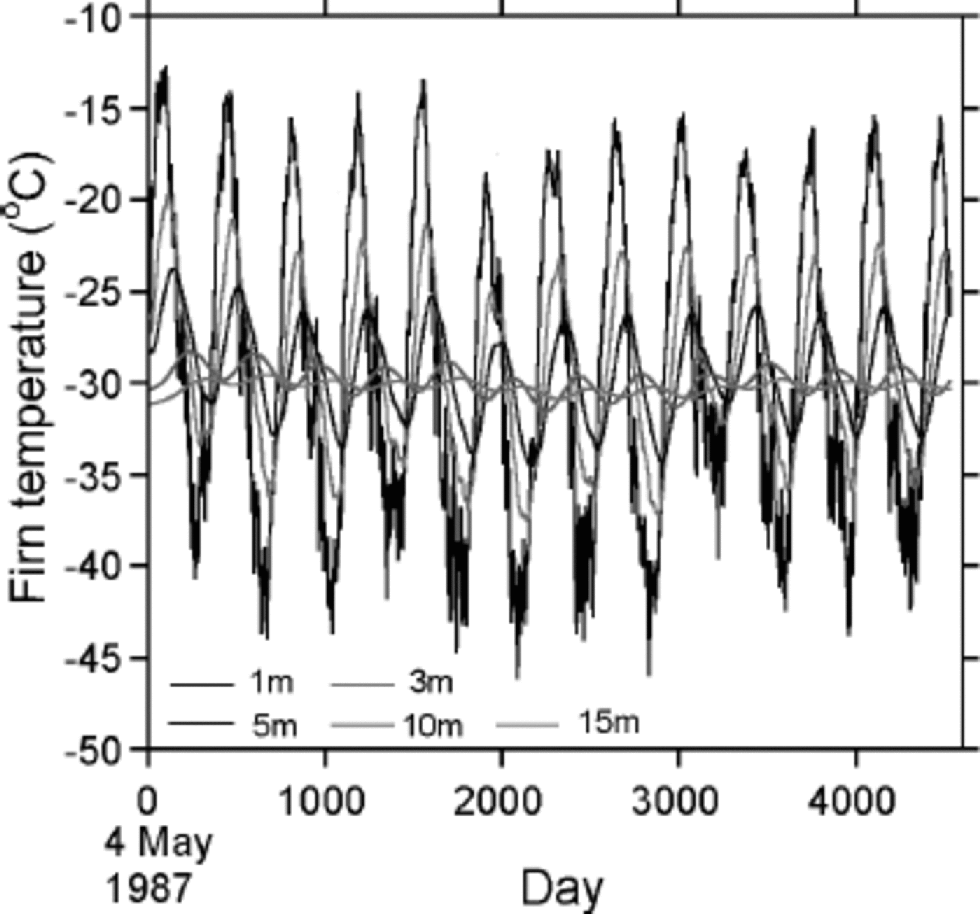
Dampening of ranges of seasonal variations in temperature and interannual variations (1987–99) in temperature with depth

Interannual changes of mean summer firn temperature at several depths are shown in Figure 3, together with the values from the surface temperature. the summer temperatures are important in firn densification, which has been found to be a dominant factor in the seasonal surface elevation change (Reference Zwally and JunZwally and Li, 2002). from 1992 to 1999, a clear warming trend with a rate of approximately +0.3˚Ca–1 is indicated by each regression line through the data for the top 5 m of firn. the results show that the interannual variations of the surface summer temperature are large above 5m and significantly damped below 10m.
Interannual variations of summer mean firn temperatures (June–August) at several depths above 15 m at Summit, May 1992–October 1999. Fitted lines at each depth show 1992–99 warming trend with +0.3˚Ca–1 at the surface.

Table 1 shows that the range of the interannual variations in Tm at 5 m depth is about 65% of the range at the surface, and is damped approximately linearly with depth to about 30% at 10m and 15% at 15 m. In contrast, above 5 m the damping of the seasonal variations with depth is much faster than the damping of interannual variations.
Figure 4 shows the modeled firn temperature at 10m depth (solid line) together with mean annual surface temperature Tm. Although the variation is small (<2˚C), both sets of data still show that the temperature dropped about 2˚C from 1987 to 1992 followed by a general warming trend. the clear seasonal variation shown by the solid line and the discrepancy between the two sets of data seems to indicate that 10 m temperature is significantly affected by both the seasonal cycle and interannual variations in temperature.
Comparison between modeled 10 m firn temperature and mean annual surface air temperature at Summit, showing interannual variations during May 1987– October 1999.

The Tm for all 12 years except 1992 (Tm = –32.0˚C) is warmer than the maximum temperature of –31.25˚C measured at 15m depth in the 1989 borehole (Reference Alley and B.R. KociAlley and Koci, 1990). In 1989, a depth of 15 m corresponded to a time about 30 years prior to the drilling, or about 1959. While the measured borehole temperatures ranged from the –31.5˚C minimum measured at 130 m depth to the –31.25˚C measured at 15 m (a difference of 0.25˚C), the range in the best-fit surface temperature history is larger at about 2˚C (Reference Alley and B.R. KociAlley and Koci, 1990). from their temperature reconstruction, Reference Alley and B.R. KociAlley and Koci (1990) concluded that the indicated warming falls within the range of natural variability and provides no clear evidence of a greenhouse signal. During the 12 year period 1987–99, however, the mean annual surface temperature is –29.2˚C, and the mean annual 15m temperature is –30.1˚C, which is >1˚C warmer than a 15 m borehole temperature representing the period around 1959 and warmer than the best-fit temperature history by Reference Alley and B.R. KociAlley and Koci (1990) back to AD 1500. Even though the middle of the 1987–99 period was affected by the atmospheric cooling effects of the Mount Pinatubo volcanic eruption, the period was on average warmer by at least 1˚C than recent century-scale average temperatures.
The continuous temperature data shown by Figure 1 provide the most detailed and complete near-surface temperature record for the Summit region during the period 1987–99. Therefore, they are especially useful in the analysis of surface elevation data retrieved from satellite radar altimeter (European Remote-sensing Satellites 1 and 2) for the period 1992–99. This temperature record is assumed to be the snow temperature at the surface in the present analysis. More precise calibration using some of the field firn-temperature measurements made during this period should be undertaken to ensure the modeled firn temperatures with depth are in agreement with field data.



