INTRODUCTION
Hard substratum marine communities can be predominated by encrusting colonial organisms (e.g. Jackson, Reference Jackson1977, Reference Jackson1979b; Sebens, Reference Sebens1986), which, in the process of acquiring space, exhibit patterns of spread that vary among genotypes or species (Buss, Reference Buss, Larwood and Rosen1979; Jackson, Reference Jackson, Larwood and Rosen1979a). Contrasting modes of encrusting growth include so-called phalanx and guerrilla ‘strategies’ (often termed sheet and runner, respectively, in the zoological literature). A number of adaptive attributes are thought to vary between phalanx and guerrilla morphologies (reviewed in Buss & Blackstone, Reference Buss and Blackstone1991), including competitive ability, asexual dispersal ability, and the ability to withstand environmental stress. Phalanx morphs generally dominate competitors and better persist in the face of environmental adversity but are less well suited for locating suitable habitat through growth and dispersal. Guerrilla morphs are typically poor competitors and more sensitive to environmental stressors but disperse readily through rapid asexual reproduction.
Phalanx and guerrilla growth forms differ fundamentally in their patterns of spread from a central point of establishment. Phalanx morphs display compact, radially symmetric spread whereas guerrilla morphs exhibit directional growth, proliferating primarily along one or a few axes. At the level of the entire, physiologically integrated colony, phalanx morphs manifest roughly circular, radially symmetric colony shapes, and whereas guerrilla morphs often exhibit more elongate, asymmetric colony shapes. However, it is unclear whether all variation in encrusting growth form fits satisfactorily within this framework. The well-studied colonial hydroid genus Hydractinia exhibits wide, genotype-specific variation in early ontogenetic growth form (McFadden et al., Reference McFadden, McFarland and Buss1984; Buss & Grosberg, Reference Buss and Grosberg1990; Blackstone & Buss, Reference Blackstone and Buss1991; Yund, Reference Yund1991; Ferrell, Reference Ferrell2004a) with colonies ranging from those composed primarily of highly branching, thin branches of tissue (‘stoloniferous’ phenotype) to colonies composed primarily, or entirely, of a continuous sheet of ectodermal mat tissue (‘mat’ phenotype). Stoloniferous colonies have been equated with runner-like morphologies (e.g. Blackstone & Buss, Reference Blackstone and Buss1991, Reference Blackstone and Buss1992, Reference Blackstone and Buss1993; Buss & Blackstone, Reference Buss and Blackstone1991; Yund, Reference Yund1991; Van Winkle & Blackstone, Reference Van Winkle and Blackstone2002; Blackstone et al., Reference Blackstone, Cherry and Glockling2004a,Reference Blackstone, Cherry and Van Winkleb), despite the fact that extremely stoloniferous individuals exhibit patterns of growth (i.e. dense polyps and a highly branching network of stolons with many anastomoses) characteristic of sheet-like morphologies in closely related hydroid species (Blackstone et al., Reference Blackstone, Cherry and Glockling2004a,Reference Blackstone, Cherry and Van Winkleb, Reference Blackstone, Bivins, Cherry, Fletcher and Geddes2005). Both mat and highly stoloniferous growth forms, as well as some intermediate morphs, may exhibit radially symmetric colony shapes characteristic of the phalanx morphology while other growth forms intermediate between these extremes exhibit more diffuse, guerrilla-like growth typically accompanied by an elongate, i.e. asymmetric, colony morphology. Phalanx and guerrilla phenotypes are characterized traditionally as adaptive modes of growth, in which each morphology has attendant fitness benefits that may be manifest in different characters (e.g. fecundity vs competitive ability) or ecological contexts. Alternatively, early developmental asymmetry in colony-level growth patterns may reflect developmental instability, as anatomical asymmetry and irregular shape is known to be an indicator of developmental instability in a wide variety of plants and animals (Møller, Reference Møller1997; Polak, Reference Polak2003).
Here I compare and contrast two morphological perspectives for understanding colonial growth in the genus Hydractinia by: (1) quantifying the range of genetically-based variation in growth form (mat vs stoloniferous) and colony symmetry in natural populations; (2) exploring the relationship between growth form and symmetry; and (3) assessing the relationship between fitness components, as measured in a common garden field setting, and morphological indicators of growth form and colony symmetry. The first two objectives were addressed identically in three different species (Hydractinia GM, H. polyclina, and H. symbiolongicarpus) whereas the field experiment was conducted with H. GM only.
MATERIALS AND METHODS
Study system
Many Hydractinia species encrust the external surface of gastropod shells occupied by pagurid hermit crabs (Bouillon et al., Reference Bouillon, Gravili, Pagès, Gili and Boero2006). Hydractinia GM is an un-described species found only in the northern Gulf of Mexico whereas H. symbiolongicarpus and H. polyclina are distributed in the north-western Atlantic with minimal geographical overlap between species (Buss & Yund, Reference Buss and Yund1989; Cunningham et al., Reference Cunningham, Buss and Anderson1991). Hydractinia colonies are gonochoric and polymorphic, possessing specialized polyps for sexual reproduction, or gonozooids, on which the gametes are generated and retained until eggs and sperm are released during broadcast spawning events, which are initiated by light exposure (Bunting, Reference Bunting1894; Ballard, Reference Ballard1942; Levitan & Grosberg, Reference Levitan and Grosberg1993). A demersal planula develops following fertilization. Upon successful recruitment (nearly always to a hermit crab-occupied gastropod shell), the planula metamorphoses, forming a single, small primary polyp for feeding. After acquiring sufficient energetic resources, the new recruit expands areally over the shell substratum via thin branches of tissue, or stolons, upon which additional feeding polyps, or gastrozooids, are formed. Stolons and polyps constitute the gastrovascular system, through which food, nutrients, and gases are transported throughout the colony. A continuous sheet of tissue, the ectodermal mat (with an internal, stolonal network), forms initially in the centre of the colony and is surrounded by peripherally radiating stolons. Over time, the mat region expands, incorporates peripheral stolons into the internalized gastrovascular network, and ultimately encompasses the entire colony. All colonies exhibit a mat phenotype once the entire external shell surface has been colonized (Frank et al., Reference Frank, Leitz and Müller2001). Thus, differences in growth form are evident only during the earliest stages of colony development.
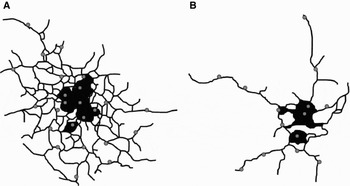
Colonies exhibit significant variation in early developmental growth form (Figure 1). Using asexually derived replicates from adult animals, growth from a small size can be reinstated and used as a proxy for early colony development. Some colonies grow primarily by a continuous sheet of mat tissue (mat phenotypes) whereas others grow primarily by stolons (stoloniferous phenotypes), but most exhibit phenotypes intermediate between these two morphological extremes. Growth form of colonies established asexually has a significant genetic basis, as indicated by clonal repeatability, in H. GM (Ferrell, Reference Ferrell2004a), H. symbiolongicarpus (Buss et al., Reference Buss, McFadden and Keene1984; Buss & Grosberg, Reference Buss and Grosberg1990), and H. polyclina (Yund, Reference Yund1991).
Early ontogenetic growth of sexually derived colonies. Colony outlines include area encrusted by stolon and mat tissue; gray circles represent feeding polyps (gastrozooids). Colonies may exhibit relatively (A) compact, symmetric or (B) diffuse, asymmetric morphologies. Following induced larval settlement, colonies were raised for 28 days in a common garden laboratory environment. At this stage, colonies are composed primarily of (peripheral and internal) stolons, but have generated some mat tissue in the innermost portions of the colony. Colony A represents the stoloniferous phenotype. The mat phenotype, not shown here, displays central ectodermal mat tissue only. Colony B represents an intermediate phenotype. Compact, symmetric colonies exhibit many inter-stolon anastomoses and dense polyps, most closely resembling phalanx colonial growth. Diffuse, asymmetric colonies exhibit elongate, and typically fewer, stolons and sparse polyps, typical of guerrilla morphs.

Intra- and interspecific variation in growth form and colony symmetry
While snorkelling or wading in shallow (<2 m) coastal waters, typically consisting of sand and mud substrate, I collected hermit crabs occupying shells with the majority of the external surface colonized by mature colonies of three different Hydractinia species and grew asexually derived replicates of each colony (genotype) in a laboratory common garden environment to characterize colony morphology per genotype. The hydroid species exhibit largely non-overlapping geographical distributions with H. GM found only in the northern Gulf of Mexico, and H. symbiolongicarpus and H. polyclina in the north-western Atlantic (Cunningham et al., Reference Cunningham, Buss and Anderson1991). Species were identified using morphometric characters (Buss & Yund, Reference Buss and Yund1989) and comparisons of species ranges (Cunningham et al., Reference Cunningham, Buss and Anderson1991; Folino & Yund, Reference Folino and Yund1998) with sites of collection, which are given in Ferrell (Reference Ferrell2005). Colonies and host crabs were maintained in aerated wet tables for up to five days and fed 2-day-old Artemia brine shrimp nauplii (Ocean Star International, Inc., Pro 100) daily. I then obtained five explants of colony tissue, each containing 5–10 gastrozooids, and secured each explant individually to a plain glass microscope slide using (8-lb test) monofilament thread. Previous work has shown that maintaining field-collected colonies and host crabs on an Artemia nauplii diet in the laboratory (>5 days) does not significantly alter growth form estimation (simple linear regression fit through origin: growth form estimate within 24 hours of field collection = 1.02*growth form estimate after laboratory diet, F1,10 = 62.6, P < 0.001). Colonies were maintained in slide racks modified for unrestricted water movement in a single aquarium containing re-circulated 1 μm-filtered seawater (temperature ~18°C, salinity ~28 ppt). After seven days, each colony was rinsed thoroughly in 70% ethanol and air-dried. I subsequently counted the number of peripheral stolon tips using a dissecting microscope. A magnified image of each colony was obtained using a Nikon camera interfaced to a computer, and maximum colony length and width measured along defined axes using SigmaScan Pro 4 software (v. 5.0). Number of peripheral stolon tips borne by colonies raised under age- and size-standardized conditions provides a morphological indicator of interference competitive ability (Ferrell, Reference Ferrell2005), or the ability to mount the inducible hyperplastic stolon overgrowth response (Ivker, Reference Ivker1972; Buss et al., Reference Buss, McFadden and Keene1984; Buss & Grosberg, Reference Buss and Grosberg1990). This morphological indicator is positively correlated with other unit-less growth form indicators that have been applied to this system, including the ratio of areal coverage by stolon versus mat tissue (Yund, Reference Yund1991; R2 = 70.9%, P < 0.001) and colony perimeter/(area)0.5 (Blackstone & Buss, Reference Blackstone and Buss1991; R2 = 54.6%, P < 0.001). The second morphological indicator—abs(L/W−1), where ‘abs’ indicates absolute value and L/W refers to the ratio of colony length and width—indicates symmetry of growth with compact, circular morphs exhibiting low values (circle = 0) and increasingly elongate, asymmetric morphs exhibiting higher values.
Interspecific differences in colony-level morphology were evaluated using analysis of variance (ANOVA) (genotypes nested within species), and Bonferroni-corrected post-hoc pairwise comparisons. Within each species, broad-sense heritability was assessed individually for number of stolon tips and abs(L/W−1) by testing for differences in morphology among genotypes using one-way ANOVA. Means for each genotype were calculated for each of the two morphological indicators, and linear and quadratic regression used to examine the relationship between these morphological measures within each species. A partial F-test (Sokal & Rohlf, Reference Sokal and Rohlf1995) was used to test whether a quadratic model represented a statistically significant improvement relative to the linear model for each species.
Life history, growth rate, and growth form/symmetry: a common garden field experiment
From shallow (<1 m) sand–mud flats at the Florida State University Coastal and Marine Laboratory (FSUCML), I collected 55 hermit crabs occupying shells with the majority of the external surface colonized by mature Hydractinia GM colonies and characterized the growth form of each colony according to established methods (Ferrell, Reference Ferrell2005), as described above, using asexually derived colony replicates (five replicates per genotype for a total of 275 colonies). Hermit crabs and hydroid symbionts were maintained on wet tables with running seawater (~28 ppt) and fed two to four-day-old brine shrimp nauplii daily. After obtaining growth form estimates (number of peripheral stolon tips) for all colonies, I then used the mean growth form per genotype to partition the observed range of growth forms among genotypes into five categories and selected two genotypes per category that exhibited similar growth form estimates (total of ten genotypes). Mean number of stolon tips (N = 5 per genotype) for selected genotypes in each of five growth form categories were: 0.2, 1.0 (extremely mat-like); 4.2, 4.4 (intermediate mat-like); 10.0, 10.2 (intermediate); 16.25, 16.75 (intermediate stoloniferous); 21.4, 23.0 (highly stoloniferous). Hereafter, these five growth form categories are referred to simply as 0, 4, 10, 16, and 22, in reference to the mean number of stolon tips exhibited by experimental genotypes in these categories. Colony length and width measurements were obtained for each replicate, as described above (‘Intra- and interspecific variation in growth form and colony-level symmetry’ section).
For each of the ten selected genotypes, ten asexual replicates were established individually on unoccupied Littoraria irrorata shells (length = 18–20 mm) by tying a small explant of colony tissue, consisting of 3–5 gastrozooids, to each shell near the aperture where the outer body whorl meets the spire. Shells were secured to plain glass slides and maintained in modified slide racks in a single aquarium containing re-circulated 1 μm-filtered seawater (temperature ~18°C, salinity ~28 ppt). Colonies were maintained in these conditions for 21 days, at which point all colonies had attached to the shell through new tissue growth and produced at least five new gastrozooid polyps. I then removed the monofilament line and tissue explant, introduced a naked Pagurus longicarpus hermit crab to each shell, and isolated each hydroid/shell/crab unit in a small field cage placed in shallow subtidal waters at FSUCML, the original site of collection. Each cage was constructed of 40 mm2 (1/4″) mesh hardware cloth and provided a roughly circular 50 cm2 area for crab movement over the sand and mud sediment. The diet of field experimental animals was not supplemented, as organic debris and meiofauna likely moved freely in and out of the cages, thereby providing sufficient food for hermit crabs and hydroid symbionts. Pilot studies had demonstrated previously that colonies initiated at very small size (5–7 zooids) consistently grew and attained sexual reproductive maturity under these conditions (D.L. Ferrell, unpublished data). At 21, 56, 77, 133, and 175 days after transferring colonies to the field, I recorded colony survival, reproductive status (juvenile or mature), number of immature and mature gonozooids, surface area (SA) growth rate, and number of gastrozooids. Surface area growth refers to growth of somatic tissue (peripheral stolons or ectodermal mat) via lateral propagation over the shell substratum. Maximum colony length and width (parallel and perpendicular to the shell columella axis) was measured by using monofilament line to closely trace the contours of the colonized shell surface, and SA growth rate estimated as follows:

Dead or absent host hermit crabs were replaced as necessary.
Differences among the five growth form categories in life history (number of immature gonozooids) and growth (surface area growth rate, number of gastrozooids) were examined using a one-way ANOVA with Bonferroni-corrected post-hoc pairwise comparisons treating growth form category as a fixed factor. A goodness-of-fit χ2-test was used to test whether survival differed among the five growth form categories. As colony symmetry, abs(L/W−1), differed widely among experimental genotypes irrespective of growth form (number of peripheral stolon tips), linear regression analysis was used to investigate the relationship between life history (survival, number of immature gonozooids) or growth (SA growth rate, number of gastrozooids) and mean colony symmetry per genotype. An unanticipated anoxic disturbance occurred during the course of the experiment (between days 56 and 77). The disturbance likely occurred as a result of excessive, dead sea grass (primarily Thallassia testudinum) accumulation and decomposition near the experimental site, which caused a significant fish kill in this localized region. Contingency χ2 analysis was used to test whether survival varied among growth forms before and after the anoxic event. In addition, using length and width measurements obtained from field colonies during the experiment, a t-test was applied to examine whether anoxia survivors and non-survivors exhibited differences in colony symmetry prior to the disturbance. The residual distribution exhibited a long tail (see Results), and although t-tests are robust to the assumption of residual normality, a Mann–Whitney non-parametric test was also applied. A paired t-test was used to test whether colony symmetry of anoxia survivors, as measured in the field, differed before and immediately after the disturbance. In addition, one-way ANOVA was used to examine differences in mean colony symmetry observed in the field at five different time points (21, 56, 77, 133, and 175 days).
RESULTS
Intra- and interspecific variation in growth form and colony symmetry
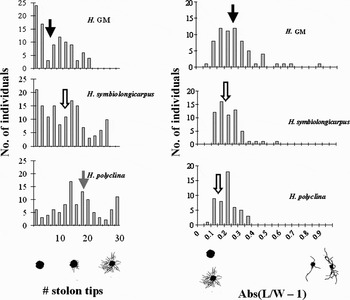
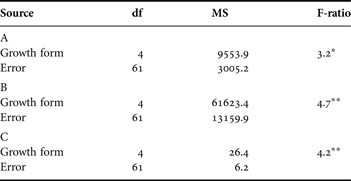
Interspecific differences in both growth form and colony symmetry were detected (Table 1; Figure 2). A total of 97, 141, and 99 genotypes were collected for Hydractinia GM, H. symbiolongicarpus, and H. polyclina, respectively. Nested ANOVA for abs(L/W−1) included a subset of these genotypes for which data were available: H. GM (N = 76), H. symbiolongicarpus (N = 61), and H. polyclina (N = 58). Bonferroni-corrected post-hoc comparisons detected significant differences in growth form between all three hydroid species (Figure 2). Hydractinia GM exhibited the most mat-like morphology overall, and H. polyclina the most highly stoloniferous. Hydractinia symbiolongicarpus displayed intermediate morphs, on average. Inspection of raw means revealed that H. polyclina exhibited the most highly symmetric colony morphology, H. GM the most asymmetric, and H. symbiolongicarpus intermediate. However, in pairwise comparisons, significant differences in colony symmetry were detected only when comparing H. GM to each of the other two species (Figure 2). Inter-genotypic differences in both growth form and colony symmetry were also highly significant (Table 1). As reported elsewhere (Ferrell, submitted), 23.5, 21.1, and 21.4% of the morphological variation in number of stolon tips were attributable to inter-genotypic differences H. GM, H. symbiolongicarpus, and H. polyclina, respectively. Evidence of broad-sense heritability was also detected in colony symmetry, or abs(L/W−1), but the amount of morphological variation attributable to inter-genotypic differences was much greater relative to growth form: 69.1% in H. GM, 72.5% in H. symbiolongicarpus, and 75.7% in H. polyclina.
Intra- and interspecific variation in morphological indicators of competitive ability (number of peripheral stolon tips) and colony symmetry [abs(L/W−1)] early in ontogeny in three Hydractinia species. For each genotype, up to five asexually derived colonies were grown under size- and age-standardized conditions in a common garden laboratory environment; data represent mean genotypic estimates. Arrows indicate overall intraspecific mean values for all genotypes, and interspecific differences are shown by differences in arrow shading (Bonferroni corrected α = 0.0167; Table 1). Hydractinia GM genotypes exhibited relatively few stolon tips and asymmetric shapes overall whereas H. polyclina exhibited highly competitive morphs (many stolon tips) and symmetric shapes.

Nested ANOVA results for interspecific and inter-genotypic differences in (A) number of peripheral stolon tips and (B) abs(L/W−1) in the laboratory common garden environment.

**, P ≤ 0.01; ***, P ≤ 0.001.
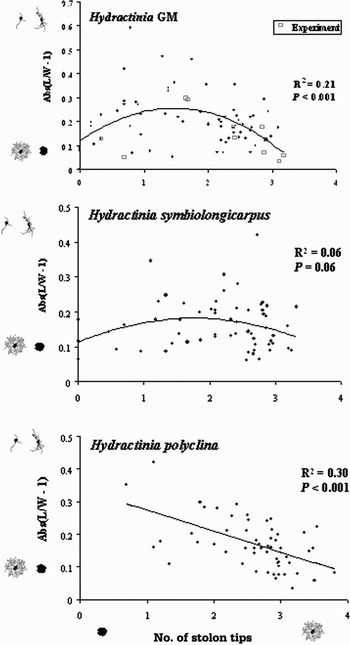
The relationship between genotypic mean estimates of colony symmetry, or abs(L/W−1), and growth form, or number of stolon tips, differed among species (Figure 3). A significant quadratic relationship was detected in H. GM (partial F-test: F1,73 = 71.1, P < 0.001) with mat and highly stoloniferous genotypes both exhibiting a high degree of symmetry. In this species, some genotypes exhibiting intermediate stolon production exhibited increased asymmetry, but ranged widely in this measure. The ten H. GM genotypes selected for the field experiment are shown as empty boxes in Figure 3, and an extremely similar quadratic relationship between growth form and colony symmetry was detected when analysing these genotypes alone (R2 = 0.65; partial F-test: F1,7 = 11.8, P < 0.01). Hydractinia symbiolongicarpus also appeared to exhibit a quadratic relationship, although this was marginally non-significant (partial F-test: F1,58 = 3.6, P = 0.06). Hydractinia polyclina clearly exhibited a negative linear relationship (F1,56, P < 0.001). In all three species, data suggest that highly stoloniferous genotypes exhibit great symmetry. The strength of the link between highly symmetric growth and mat-like morphology differed among species, however, and corresponds to the relative abundance of mat-like morphs among species. Closer examination of the distribution of growth phenotypes suggests that interspecific differences are due to differences in the abundance of mat-like morphs among species. Extremely mat-like colonies are abundant in H. GM, and the quadratic relationship indicates that they exhibit great symmetry. Mat-like colonies are somewhat less abundant in H. symbiolongicarpus, and the quadratic relationship is less strong. Then, in H. polyclina, there is no evidence of increased symmetry at the mat-like end of the growth form continuum; however, mat-like morphs are extremely rare in this species as highly stoloniferous morphs predominate. When pooling the data for the three species, a quadratic relationship between abs(L/W−1) and number of peripheral stolon tips remains highly significant (R2 = 0.15; partial F-test: F1,192 = 23.0, P < 0.0001), and a comparison of this pooled model to one incorporating species-specific quadratic terms was not statistically significant (log-likelihood ratio statistic = 0.89, P = 0.64).
Relationship between morphological indicators of competitive ability (number of peripheral stolon tips) and colony symmetry [abs(L/W−1)] in three Hydractinia species. Data points represent mean values from up to five asexually derived colonies per field-collected genotype grown under size- and age-standardized conditions in a common garden laboratory environment. In H. GM, empty boxes represent ten genotypes used in the field experiment (Figures 4–7). Both axes are ln-transformed. abs(L/W−1) is a quadratic function of number of stolon tips in H. GM (partial F-test for increase in fit compared to linear model: F1,73 = 71.1, P < 0.001). A quadratic relationship is a marginally non-significant improvement fit relative to a linear model in H. symbiolongicarpus (partial F-test: F1,58, P = 0.06; linear regression: F1,59 = 0.02, P = 0.89, R2 = 0.00). P-values in figure correspond to partial F-test results for H. GM and H. symbiolongicarpus. A linear relationship exists in H. polyclina (partial F-test: F1,55 = 0.00, P > 0.90; linear regression: F1,56 = 24.4, P < 0.001). Colony tracings represent mat (x-axis, left) and highly stoloniferous (x-axis, right) growth forms, both of which exhibit symmetric colony shapes (y-axis, bottom). Colonies exhibiting intermediate stolon production may exhibit symmetric or asymmetric (y-axis, top) shapes.

Life history, growth rate, and growth form/symmetry: a common garden field experiment
Approximately one-third of experimental colonies died within three weeks of transfer to field conditions, but very little mortality occurred over the next five weeks. Early mortality of small colonies may be attributable in part to experimental handling during transfer to field cages or physical abrasion following the introduction of a host hermit crab, as association with a crab host imposes significant mortality on newly established colonies (D.L. Ferrell, unpublished data). At approximately week 10, a disturbance event occurred at the field site in which the water was depleted of oxygen. Significant mortality was observed among experimental colonies when monitored at 11 weeks, likely as a result of the anoxic disturbance. Nearly all shells were occupied by live hermit crab hosts upon collection. Contingency χ2 analysis comparing pre- and post-anoxic survival (8 vs 11 weeks) did not detect any difference in mortality among growth form categories based on peripheral stolon tip production (χ2 = 3.4, df = 4, P = 0.50). From 11 weeks until the termination of the experiment at 25 weeks, only approximately 10% additional mortality was observed.
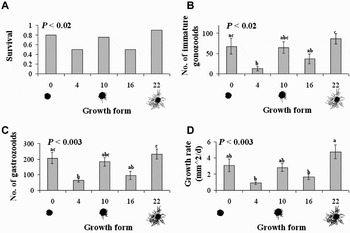
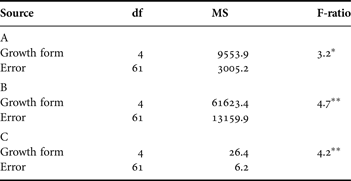
At eight weeks, prior to the anoxic event, differences in fitness components among growth-form categories were detected. Significant differences in field survival were observed among growth-form categories (Contingency χ2 = 9.5, df = 4, P = 0.015; Figure 4A). Colonies in two of the intermediate categories (4 and 16 stolon tips) exhibited decreased survivorship relative to the other three categories. Similarly, categories 4 and 16 generally showed decreased number of immature gonozooids (Figure 4B), number of gastrozooids (Figure 4C), and surface area growth rate (Figure 4D). Although ANOVA detected significant overall differences with respect to each of these fitness components among the five growth form categories (Table 2), pairwise comparisons did not always detect significant deviations when comparing categories 4 and 16 to others (Figure 4B–D). Significant differences between categories 4 and 16 were never detected. With respect to surface area growth rate, categories 4 and 16 grew significantly slower than only the most highly stoloniferous category (22 stolon tips). Pairwise differences were detected with respect to gastrozooid production. Category 4 exhibited significantly fewer gastrozooids also when compared with the most mat-like category (0 stolon tips).
Field experimental life history (survival, immature gonozooid production) and growth (gastrozooid production, areal expansion rate) as a function of growth form category. Data were collected at eight weeks, prior to the anoxic event. Two genotypes per growth form category (shown in Figure 3) are pooled. Genotypes exhibiting 0 and 22 peripheral stolon tips under standardized common garden conditions represent mat and highly stoloniferous growth, respectively, whereas genotypes exhibiting 4, 10, and 16 stolon tips are representative of the continuum of intermediate morphs. (A) Colony survival depended on growth form category (χ2 = 12.3, df = 3, P < 0.02); for (B) number of immature gonozooids; (C) number of gastrozooids; and (D) surface area growth rate. Letters designate statistically significant differences (Bonferroni corrected α = 0.005).

Analysis of variance results at day 56 testing for differences in (A) number of immature gonozooids; (B) number of gastrozooids; and (C) surface area growth rate among five growth form categories, as shown in Figure 4B–D, respectively. All pairwise comparisons (Bonferroni corrected α = 0.005) were performed and are indicated by different letters in Figure 4.
*, P ≤ 0.05; **, P ≤ 0.01.
Investment in future reproduction, or number of immature gonozooids, offers perhaps the best indicator of fitness prior to the anoxic event (at 8 weeks). Pairwise comparisons showed a pattern of differences among categories similar to that observed in number of gastrozooids. Categories 4 and 16 were significantly different from category 22, and category 4 was also different from category 0. No significant pairwise differences among the three intermediate categories (4, 10, and 16) were observed in any of the fitness components.
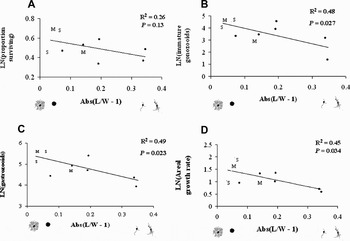
At eight weeks, a negative relationship was observed between field survival and genotypic mean symmetry (Figure 5A), as characterized in the laboratory common garden, although this was not statistically significant (F1,8 = 2.9, P = 0.13). Proportion of surviving colonies per genotype ranged from 0.5 in intermediate genotypes to 1.0 in genotypes exhibiting both extreme morphs. A significant negative relationship was detected between life history (number of immature gonozooids) or growth (number of gastrozooids, SA growth rate) and colony symmetry of experimental genotypes (Figure 5B–D) (immature gonozooids: F1,8 = 7.3, P = 0.027; gastrozooids: F1,8 = 7.8, P = 0.023; SA growth rate: F1,8 = 6.5, P = 0.034). Genotypic means ranged from 4 to 106 in number of immature gonozooids, 51 to 278 in number of gastrozooids, and 0.8 to 4.3 mm2/d in SA growth rate.
Field experimental life history (survival, immature gonozooid production) and growth (gastrozooid production, areal expansion rate) as a function of colony symmetry. Data were collected at eight weeks, prior to the anoxic event. Letters represent genotypes exhibiting mat (M) and highly stoloniferous (S) growth forms. All other data points represent genotypes exhibiting intermediate morphologies. Whether mat or highly stoloniferous growth forms, genotypes displaying symmetric growth are tied to (C, D) faster growth and (B) increased production of immature gonozooids, an investment in future reproduction.

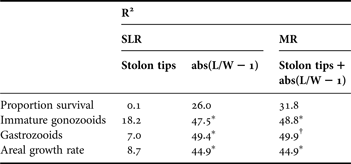
In contrast to abs(L/W – 1), linear regression detected no significant relationships between life history or growth and growth form (number of stolon tips) among the ten genotypes (Table 3). Multiple regression analysis, including both morphological variables (number of stolon tips and abs(L/W−1)), resulted in only a minimal increase in explanatory power (R2) compared to simple linear regression with abs(L/W−1) but a large increase with respect to simple linear regression with number of stolon tips. In the multiple regression model, number of stolon tips was not a significant explanatory variable whereas abs(L/W−1) was significant in two of four analyses (number of immature gonozooids, SA growth rate) and marginally non-significant in a third analysis (number of gastrozooids) (Table 3).
Proportion of variation (R2) in life history and growth among field experimental genotypes (N = 10) explained by simple linear regression (SLR) and multiple regression (MR) analysis using alternative morphological indicators for growth form, number of peripheral stolon tips, and colony symmetry, abs(L/W−1).
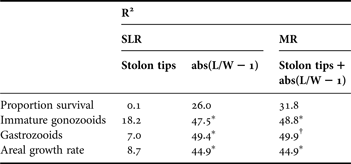
*, P < 0.05; †, P < 0.10. For MR, designations reflect statistical significance of abs(L/W−1), as number of stolon tips was not significant in any of the models.
Following the anoxic event, growth and life history traits were more variable; significant differences among growth forms largely were not detected. However, differences in areal growth rate between mat and highly stoloniferous growth forms were detected at 11 (but not 19 and 25) weeks, and at 19 weeks mat growth forms exhibited significantly greater gastrozooid production compared with intermediate categories 4 and 10. A marginally non-significant (P < 0.10) difference in survival was also detected at 11 and 25 weeks in which mat and highly stoloniferous morphs exhibited greater survival than the intermediate morphs.
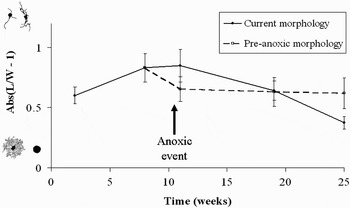
After an initial increase in asymmetry, experimental colonies tended to converge on more symmetric shapes in the field (Figure 6; one-way ANOVA: F4,233 = 2.6, P = 0.038). The increase in symmetry is not attributable to colonization of the external shell surface. Length of Littoraria irrorata shells used in this experiment ranged from 18 to 20 mm, which yields the following minimum and maximum values for hydroid colony length, width and symmetry: minimum = 23.0 × 35.5 mm, abs(L/W−1) = 0.35; maximum = 24.5 × 40.0 mm, abs(L/W−1) = 0.39. On the last two dates of data collection, only seven (25%) and two (8%) colonies, respectively, exhibited colony sizes exceeding 20.0 mm in length and 30.0 mm in width, a conservative estimate of colonies encrusting most of the shell surface. However, colonies were more asymmetric, on average, on the penultimate date; thus, there was no apparent link between shell coverage and colony symmetry.
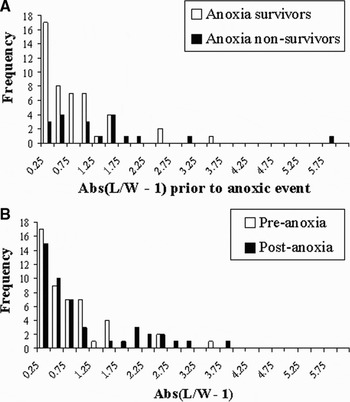
Changes in colony symmetry over time in a field experimental setting. Solid line and symbols represent mean (±SE) symmetry of all surviving colonies, as measured at the current time interval. Colonies converge on symmetrical shapes over time. Dashed line and open symbols represent the mean shape, as measured prior to the anoxic event at eight weeks, of colonies surviving at subsequent time periods. Individuals surviving the anoxic event tended to be those that exhibited more symmetric growth prior to disturbance (Figure 7A).

Overall, colony shape following the anoxic bout showed a modest increase in asymmetry (Figure 6). Mean abs(L/W−1) at 8 and 11 weeks was 0.83 (+/−0.12 SE) and 0.85 (+/−0.14 SE), respectively. When comparing only surviving colonies in the pre-anoxic mean abs(L/W−1) at both 8 and 11 weeks, however, differences are more marked – 8 weeks, pre-anoxia (0.67) vs. 11 weeks, post-anoxia (0.85) – although not statistically significant (Figure 7B; paired t-test: t = 1.54, df = 46, P = 0.13). If the effect of the anoxic event on colony survival extended beyond the immediate effects observed at 11 weeks, then mean symmetry of surviving colonies based on pre-anoxic measurements should continue to change over time. However, this was not observed; instead, after an initial increase in symmetry immediately following anoxia, mean symmetry based on pre-anoxic symmetry measurements remained essentially unchanged (Figure 6), indicating that mortality later in the experiment was independent of pre-anoxic symmetry. An immediate effect of the anoxic event on colony survival as a function of symmetry was observed: surviving colonies exhibited more symmetric growth just prior to the anoxic event than did non-survivors (abs(L/W−1) = 0.67 vs. 1.23 for survivors and non-survivors, respectively), as shown in Figure 7A (t-test: t = 2.3, df = 64, P = 0.03); Mann-Whitney test: W = 1425, P = 0.03).
Effects of anoxic event on (A) survival of colonies exhibiting variable symmetry prior to the event and (B) colony symmetry as exhibited by anoxic survivors in the field. (A) Field experimental colonies surviving anoxia exhibited more symmetric growth prior to the anoxic disturbance: survivors (0.69) vs non-survivors (1.22) (t-test: P = 0.04; Mann–Whitney test, accounting for a long-tailed residual distribution: P = 0.069); (B) surviving colonies tended to be more asymmetric immediately following the anoxic event—pre-anoxia (0.67) vs post-anoxia (0.85)—but this trend was not statistically significant (paired t-test: P = 0.29).

DISCUSSION
Symmetry of early colonial growth better explains fitness variation observed in the field context examined here relative to morphological indicators of growth form (mat versus stoloniferous morphs). Specifically, genotypes characterized by asymmetric growth in a laboratory common garden environment grew more slowly, exhibited reduced investment in future reproduction under field conditions, and suffered greater mortality in the face of environmental stress (anoxia). Importantly, the common garden studies also indicated that colony symmetry has a genetic basis (~0.7 broad sense heritability in each of three species). The combined results of a consistent fitness-symmetry relationship and a genetic component to symmetry suggest the existence of, and an ability to respond to, selection on symmetry during early colony development. Asymmetry in early colonial growth may constitute morphological irregularity symptomatic of maladaptive development in this system.
The two measures used in the current study yield different insights into the adaptive nature of colonial morphology. The estimation of growth form has attracted much interest in this and related hydroid systems (Blackstone & Buss, Reference Blackstone and Buss1991; Yund, Reference Yund1991; Dudgeon & Buss, Reference Dudgeon and Buss1996; Blackstone et al., Reference Blackstone, Cherry and Glockling2004a,Reference Blackstone, Cherry and Van Winkleb; Ferrell, Reference Ferrell2004a, 2005); however, in each of these cases, differences in stolon production have been emphasized, and for this reason these morphometric measures are positively correlated (see Materials and Methods). Colony symmetry, as indicated by abs(L/W−1), does not exhibit a simple positive relationship with measures of the degree and pattern of peripheral stolon production. In fact, a negative relationship between symmetry and stolon production existed in all three species investigated here (Figure 3), such that genotypes displaying highly stoloniferous phenotypes in a common garden environment exhibited the greatest symmetry. In those species in which mat phenotypes were present, a quadratic relationship was apparent, in which mat and highly stoloniferous phenotypes both exhibited increased symmetry relative to intermediate growth forms. Whereas other hydractiniid morphological indicators may be most appropriately applied to understanding the adaptive significance of stolonal versus mat growth, colony symmetry reflects patterns of colonial growth with adaptive consequences that are independent of the mat–stoloniferous distinction.
Asymmetric, guerrilla-like growth may be maladaptive
Genotypes consistently displaying asymmetric, guerrilla-like growth in a laboratory common garden exhibited reduced fitness in a field experimental setting. This contrasts the asymmetric colonial growth observed in some reef corals in response to environmental factors (Wood-Jones, Reference Wood-Jones1907; Brown et al., Reference Brown, Dunne, Scoffin and Le Tissier1994). Guerrilla-like genotypes corresponded to growth forms displaying intermediate peripheral stolon production (categories 4 and 16 in Figure 4), and appeared to be relatively rare in natural populations (Hydractinia GM, Figure 2), perhaps as a result of selection. Asymmetric, guerrilla-like growth may be maladaptive in the Hydractinia system for at least three reasons. Firstly, guerrilla phenotypes are generally competitively inferior to compact, phalanx phenotypes in a variety of taxa (Buss, Reference Buss, Larwood and Rosen1979; Jackson, Reference Jackson, Larwood and Rosen1979a), so although some symmetric morphs (mat phenotypes) are thought to be competitively inferior to all others bearing peripheral stolons regardless of symmetry (Buss & Grosberg, Reference Buss and Grosberg1990), this may not strictly be the case. Secondly, the diffuse stolonal network of guerrillas may require significantly greater energetic investment to maintain adequate fluid pressure in the gastrovascular system (Blackstone & Buss, Reference Blackstone and Buss1992), which performs the important function of transporting food and nutrients throughout the colony. Yet guerrillas are equipped with fewer gastrozooids with which to generate gastrovascular fluid pressure and flow via zooid contraction (Blackstone et al., Reference Blackstone, Cherry and Glockling2004a,Reference Blackstone, Cherry and Van Winkleb). Energetic arguments for guerrillas constituting more costly morphologies likely extend beyond hydractiniid hydroids. Although zooids (or the equivalent ramet) might not be primarily responsible for food, nutrient, and gas transfer at the colony level in all encrusting colonial taxa, the high level of functional integration and proximity of ramets characteristic of phalanx morphs likely eases movement of materials and therefore may decrease energetic costs relative to guerrillas. Thirdly, the benefits typically attributed to guerrillas, e.g. exploitation of competitor-free habitats or locating higher quality habitats through somatic growth (e.g. Buss, Reference Buss, Larwood and Rosen1979; Sutherland & Stillman, Reference Sutherland and Stillman1988), are not realized in the Hydractinia system. Hydractinia colonies encrust discrete microhabitats in the form of hermit crab-occupied gastropod shells, which are typically very small (as in the current field experiment) and when competition occurs in this context, no competitive refuges exist. In contrast, phalanx morphs are characterized by a high degree of commitment to the site of recruitment (Buss & Blackstone, Reference Buss and Blackstone1991). Because effectively only one site exists post-recruitment, selection for highly compact (symmetric) colonial growth may be the rule.
Many Hydractinia species are obligate hermit crab symbionts, generally possess robust, compact morphologies relative to other closely related hydroids (Van Winkle et al., Reference Van Winkle, Longnecker and Blackstone2000), and exhibit atypical growth strategies that include the abilities to both claim adjacent, uncolonized space (as opposed to ‘foraging’ for open space) and resist overgrowth by competitors (Sutherland & Karlson, Reference Sutherland and Karlson1977; Karlson, Reference Karlson1980). Growth forms exhibiting compact, radially symmetric (i.e. phalanx) growth may be best suited for both of these purposes in this system with such highly specific habitat requirements. Phalanx colonies generally exhibit slower growth rates and reduced fecundity (Buss & Blackstone, Reference Buss and Blackstone1991); but this was not observed here, providing further support for the interpretation that Hydractinia guerrillas do not represent an adaptive alternative to phalanx growth. Rather than an adaptive growth ‘strategy’, guerrilla-like growth instead may represent a maladaptive developmental aberration in this and other encrusting colonial organisms, thus casting our adaptive understanding of colonial morphology in a very different light.
Although they may be maladaptive in most contexts experienced by hermit crab-associated Hydractinia, guerrilla phenotypes may constitute an adaptive growth ‘strategy’ (i.e. benefits attributed to guerrilla-like growth may be realized) in those contexts in which competition is avoidable (at least temporarily) and/or substantial micro-environmental variation in habitat quality exists. Small gastropod shells, typically colonized in the majority of Hydractinia populations (Buss & Yund, Reference Buss and Yund1988; Yund & Parker, Reference Yund and Parker1989; Ferrell, Reference Ferrell2005), fulfil neither of these criteria. However, considerable interspecific and inter-population variation in the size of colonized shells and host hermit crabs exists (D.L. Ferrell, unpublished), and colonies sometimes encrust relatively large alternative substrata, such as cobble and dock pilings (e.g. Sutherland & Karlson, Reference Sutherland and Karlson1977). Three hermit crab species (Pagurus acadianus, P. bernhardus, and P. pollicaris) with which Hydractinia associates, all attain large sizes, and therefore inhabit large shells as adults. Hydractinia GM associates with P. pollicaris (Cunningham et al., Reference Cunningham, Buss and Anderson1991; Ferrell, Reference Ferrell2004b), in addition to the smaller hermit crab Pagurus longicarpus; H. symbiopollicaris also associates with P. pollicaris, but more exclusively than H. GM (Buss & Yund, Reference Buss and Yund1989); H. echinata associates with P. bernhardus; and H. polyclina associates with P. acadianus in northern regions of its distribution (Folino & Yund, Reference Folino and Yund1998), although none of the H. polyclina colonies in the current study were found in association with large hosts. Many large hermit crab hosts, however, were included in the population surveys of H. GM, and this hydroid species indeed exhibited more asymmetric growth than the other two focal species. The field experiment with this same species did not incorporate variation in shell size, but implemented small shells only, and no fitness benefits to asymmetric growth were detected. Additional studies are needed to test the competing notions of asymmetric, guerrilla-like growth as an adaptive strategy versus a maladaptive developmental irregularity, and one experimental approach may be to exploit the gastropod shell variability encountered in nature, as the costs and benefits of guerrilla-like growth may not be fixed. Our current understanding of guerrilla-like growth as an adaptive ‘strategy’ may be incorrect in this and similar systems, although perhaps only in some environmental contexts.
Field context
Both competitive ability (Buss & Grosberg, Reference Buss and Grosberg1990) and robustness to physical disturbance (D.L. Ferrell, unpublished) are adaptive attributes that have been linked to mat and highly stoloniferous growth forms in the Hydractinia system. Primary interference competitors arise from multiple colonization of a single gastropod shell by conspecifics (Yund et al., Reference Yund, Cunningham and Buss1987; Buss & Yund, Reference Buss and Yund1988; Yund & Parker, Reference Yund and Parker1989; Yund, Reference Yund1991; Hart & Grosberg, Reference Hart and Grosberg1999; Ferrell, Reference Ferrell2004b, 2005), and mechanical disturbance occurs in the context of neighbouring hermit crabs (Van Winkle et al., Reference Van Winkle, Longnecker and Blackstone2000) but may be exacerbated in dense host populations (D.L. Ferrell, unpublished). Neither of these field factors were operating in the field experiment conducted here; thus, it is perhaps not surprising that differences among genotypes in field survival, growth and reproductive characters were not tied to growth form, per se. In addition, genetic ties between growth form and life history traits (e.g. size of first reproduction, fecundity), proposed as a result of phenotypic correlations observed in some common garden laboratory settings (Yund, Reference Yund1987), were not detected in the current common garden field context (Table 3).
A shift in focus from the extreme growth forms to the intermediate range may be appropriate in order to further our understanding of extant, genetically-based variation in colony symmetry, as most genotypes in natural populations exhibit phenotypes intermediate between the mat and stoloniferous extremes, and it is intermediate morphs that show the greatest variation in colony symmetry. It is unclear whether the symmetry–fitness relationship observed here persists in the contexts of intraspecific competition or physical disturbance encountered in nature, although experiments utilizing well-characterized genotypes of similar growth form but variable symmetry may be used to explore the malleability of this relationship in pertinent field contexts.
To the extent that guerrilla-like growth represents developmental irregularity, it may be indicative of developmental instability. A putative relationship between developmental instability and anatomical symmetry, and more recently overall shape (e.g. insect wings; Hoffmann et al., Reference Hoffmann, Woods, Collins, Wallin, White and McKenzie2005), has been long recognized in terrestrial animals and plants (e.g. Møller, Reference Møller1997). Abnormal morphologies may be tied to genetic stress, e.g. as a result of inbreeding depression, or exposure to abiotic environmental stresses during development, depending on the extent of developmental plasticity. In the current study, irregular asymmetric early growth, with its subsequent fitness consequences in the field, were observed in particular genotypes independent of environmental effects, indicating the central role of genetics in this system, although environmental factors may influence colony development as well (e.g. Dudgeon & Buss, Reference Dudgeon and Buss1996; Blackstone et al., Reference Blackstone, Cherry and Glockling2004a,Reference Blackstone, Cherry and Van Winkleb). A careful consideration of phylogenetic context will be needed in order to judge whether demonstrably maladaptive modes of colonial growth in extant species truly constitute developmental instability. Ultimately, colonial architecture in marine invertebrates and other colonial taxa in which variation in colonial growth occurs during development, or early developmental variation remains morphological manifest in adult colonies, may represent a novel framework in which to study developmental instability.
ACKNOWLEDGMENTS
Don Levitan and Janie Wulff provided significant guidance during this study. David Houle, Igor Kosevich, and an anonymous referee provided helpful manuscript comments. Facilities used during this project included the Darling Marine Center (Walpole, ME), Florida State University Coastal and Marine Laboratory (Turkey Point, FL), Gulf Specimen Marine Laboratory (Panacea, FL), National Oceanic and Atmospheric Administration (St Andrew's Bay, FL), and the Waquoit Bay National Estuarine Research Preserve, or WBNERR (Waquoit Bay, MA). Fieldwork in the Cape Cod region was facilitated by Sarah Boyce. This work was funded by several grants, including a Florida State University Dissertation Research Grant, Jack Winn Gramling Award in Marine Biology, Thomas A. Cole Alumni Prize in Biology (Wabash College), Lerner-Gray Fund for Marine Research, Grant-in-Aid of Research—The Society for Integrative and Comparative Biology, and Robert B. Short Scholarship in Zoology.