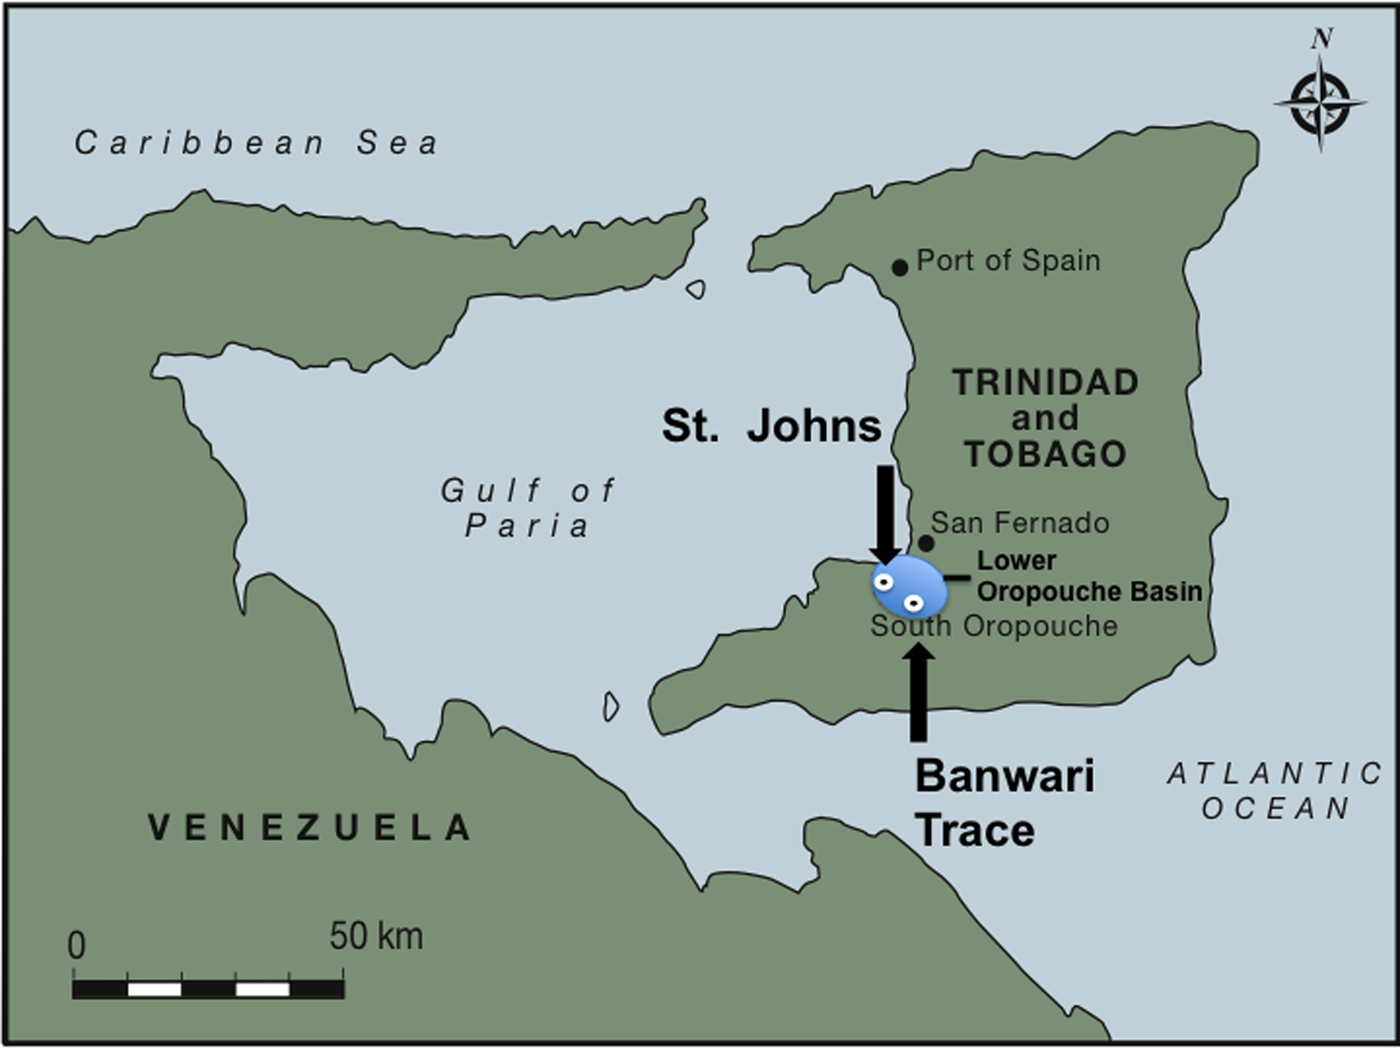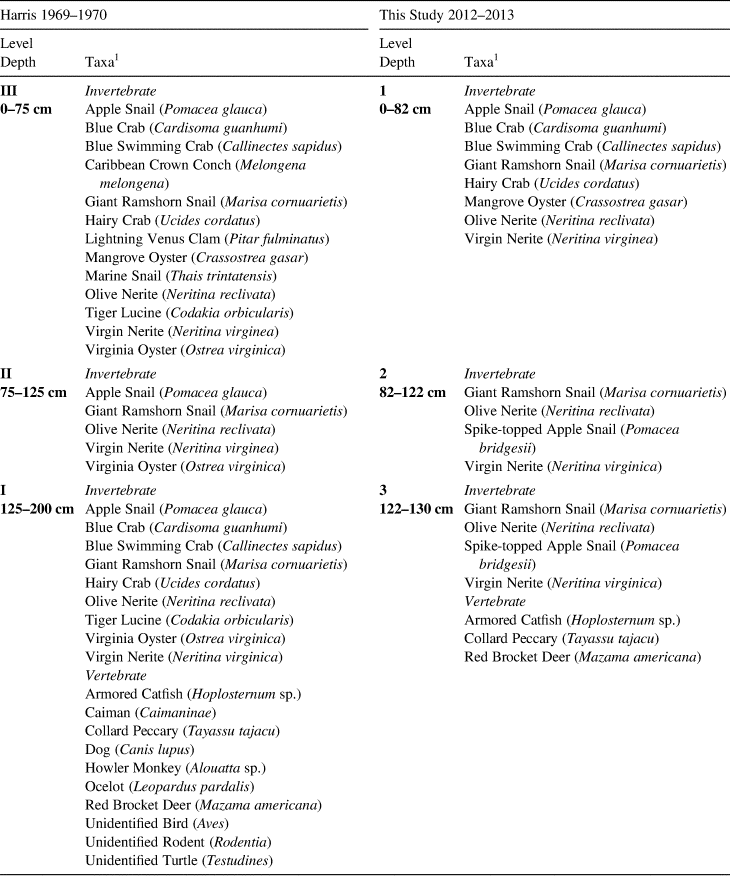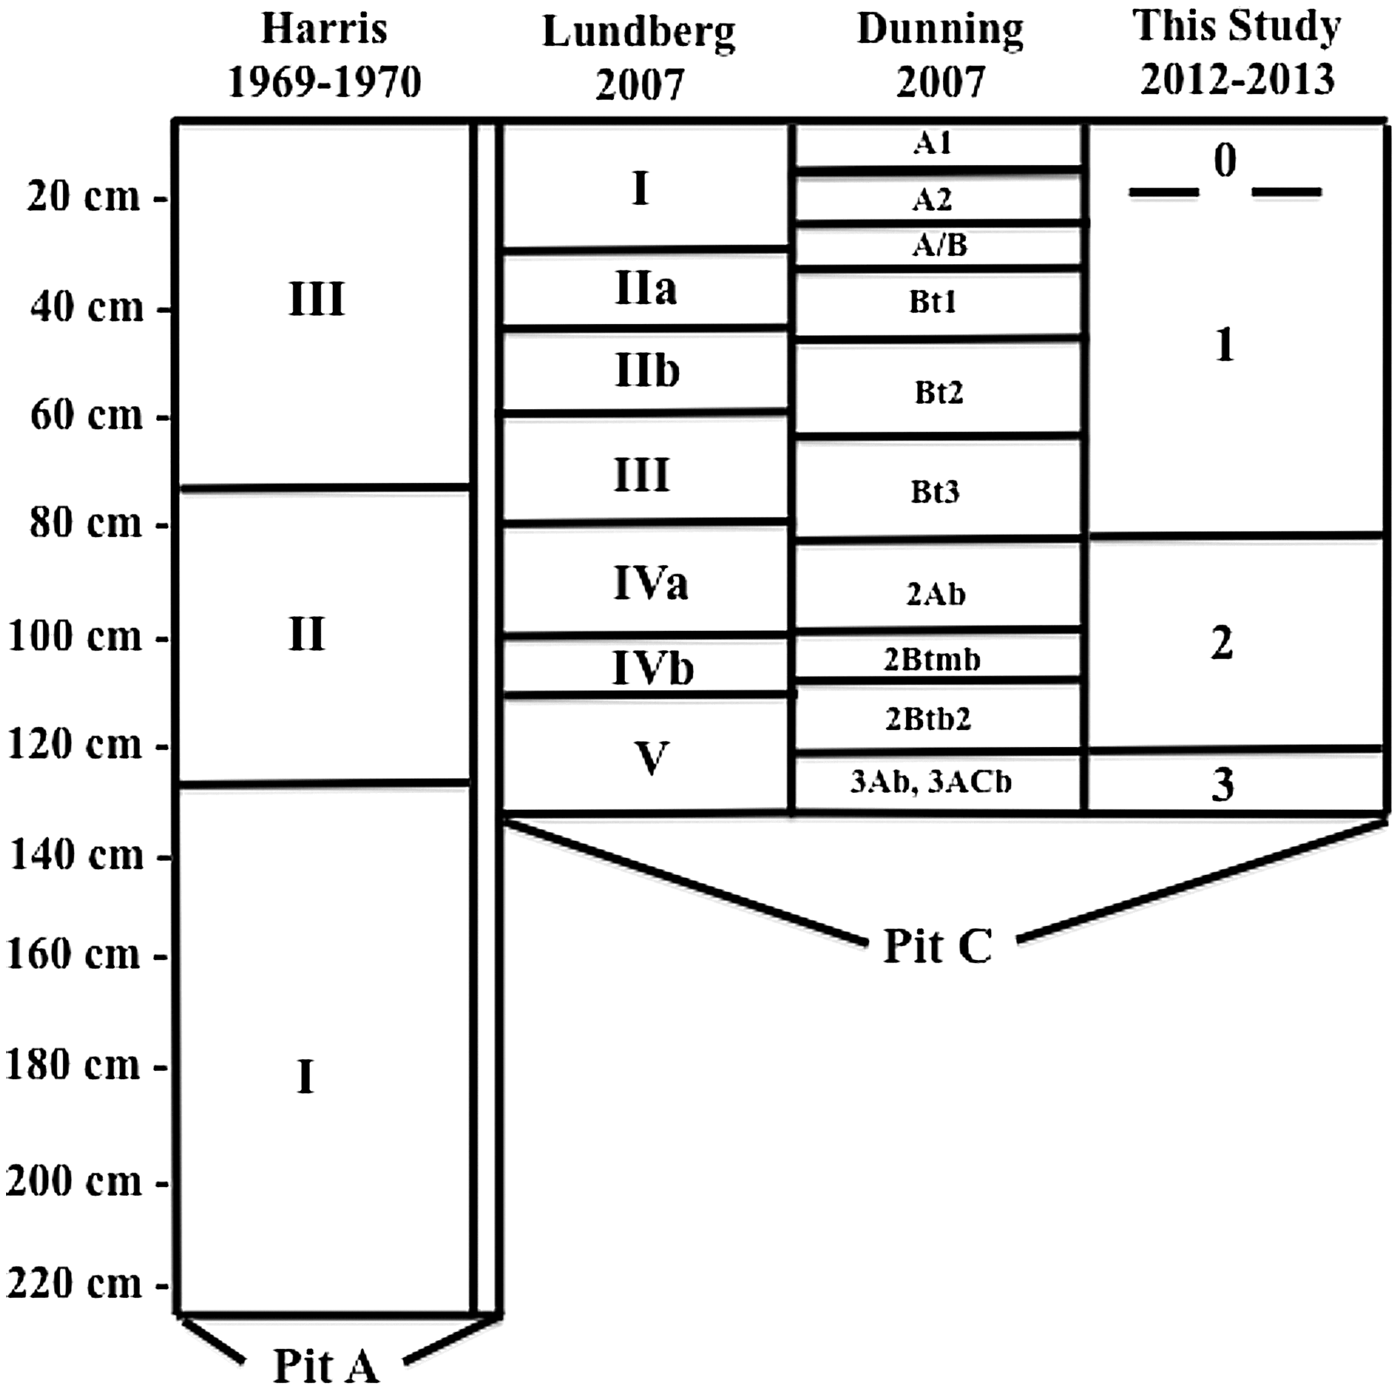


Banwari Trace is the oldest known archaeological site in the West Indies (Callaghan Reference Callaghan2003; Wilson Reference Wilson2007). The site is a well-stratified shell midden located about 13 km inland from the Gulf of Paria on the southwest coast of the island of Trinidad (Figure 1). Banwari Trace was first documented in 1802 and excavated between AD 1969 and 1970 by Peter O'Brien Harris, under the auspices of the Trinidad and Tobago Historical Society (Harris Reference Harris1973, Reference Harris1976). Harris (Reference Harris1973) undertook a 2 x 2 m excavation (Pit A), exposing three distinctive strata defined by gastropod assemblages and associated lithic artifacts and dated by radiocarbon assays. These strata were enumerated from bottom to top as follows: Level III, 0–75 cm (2350–7270 cal BP); Level II, 75–125 cm (6740–7310 cal BP); and Level I, 125–2.25 cm (7500–8170 cal BP; Table 1). Faunal remains in Levels I and II were dominated by freshwater gastropods, while Level III contained vertebrates and briny water bivalves, suggesting a change through time in nearby environmental conditions, subsistence strategies, or both (Harris Reference Harris1973; Table 2). A second 1 x 2 m excavation (Pit B) was opened by Harris close to Pit A in 1971, exposing a human burial at a depth of about 20 cm. The human skeletal remains in Pit B have come to be known as Banwari Man, with some claiming it to be the oldest human remains in the West Indies, but the skeleton has not been directly dated and was associated with scant artifacts of indeterminate age (Boomert Reference Boomert2000; Boomert and Harris Reference Boomert and Harris1988). Pit B remains largely unpublished.
The location of Banwari Trace. Map by Tim Phillips and Kenneth Barnett Tankersley. (Color online)

Initial Conventional Beta-Decay 14C Ages (after Harris Reference Harris1973, Reference Harris1976; Tamers Reference Tamers1973), and the New AMS 14C Ages, and New OSL Ages for the Banwari Trace Site.

a. CALIB 7.1 and the IntCal13 Calibration.
b. Estimated fractional day water content for whole sediment is taken as 10% and with an uncertainty of ± 5%.
c. Estimated contribution to dose-rate from cosmic rays. Uncertainty taken as ±10%.
d. Total dose-rate from beta, gamma, and cosmic components. Beta attenuation factors for U, Th, and K compositions incorporating grain-size factors. Beta attenuation factor for Rb is taken as 0.75. Factors used to convert elemental concentrations to beta and gamma dose-rates from beta and gamma components attenuated for moisture content.
e. Number of replicated equivalent dose (DE) successfully measured determined from replicated single-aliquot regenerative-dose method (SAR; Murray and Wintle Reference Murray and Wintle2000). These are based on recuperation error of < 10%.
f. Weighted average for equivalent doses (DE) of all aliquots. The uncertainty includes an uncertainty from beta source estimated of ±5%.
g. Average and standard error for equivalent doses (DE) of all aliquots. The uncertainty includes an uncertainty from beta source estimated of ±5%.
h. Uncertainty incorporates all random and systematic errors, including dose rates errors and uncertainty for the DE.
i. Elemental concentrations from NAA of whole sediment measured at Activation Laboratories Limited Ancaster, Ontario, Canada. Uncertainty taken as ±10%.
Faunal Remains Initially Identified by Harris in Pit A (1973, 1976) and during the 2012–2013 Field Seasons in Pit C According to the Stratigraphy Used by the University of Cincinnati.

1. Harris Reference Harris1973.
In 1985, about 75% of the Banwari Trace site, including Pits A and B, was destroyed by mining for construction fill, which led to inclusion of the site on the World Monuments Watch list of the most endangered archaeological sites. Boomert and Harris (Reference Boomert and Harris1988) examined exposed stratigraphy later in 1985, making some salvage collections, a principal result of which was reclassification of several mollusk species. Beginning in 2005, Harris directed a renewed investigation of the site, including excavation of a new 1 x 1 m test pit in a still-remaining portion of the midden (Pit C). At Harris’ invitation, Nicholas Dunning visited (Pit C) in 2007 and collected soil samples. To determine the extent and age of the surviving cultural deposits and their relationship with those exposed in the AD 1969–1970 excavation, we focused our field and laboratory efforts on developing a comprehensive chronostratigraphy and depositional history of Banwari Trace using Accelerator Mass Spectrometry (AMS) radiocarbon (14C) and optically stimulated luminescence (OSL) dating, stable carbon isotope analysis (13C), and detailed soil analyses.
Environmental and Cultural Context
The Banwari Trace site is situated on a low ~10 m alluvial terrace remnant of the Southern Oropuche River, a large, low-gradient stream that flows westward along a structural trough in south central Trinidad. The entirety of the drainage basin of the river covers some 185 km2. Major parts of the extensive floodplain are occupied by wetlands, although many areas were drained in the past for agricultural development. Soils within the floodplain and adjacent low-lying portions of the drainage basin are several meters deep, hydromorphic, and naturally poorly drained with weakly developed alluvial inceptisols, organic muck histosols, and heavy, heaving clay vertisols (Ahmad Reference Ahmad2011). Soils on the terrace are deeply weathered, low-nutrient-status tropical soils (mainly ultisols) formed from saprolitic sedimentary rock on better-drained sloping terrain, including the low hills immediately around Banwari Trace.
From an archaeological standpoint, Trinidad was more closely aligned with the mainland of South America from Ortoiroid (preceramic Archaic cultures) through Saladoid (ceramic-producing) cultural periods than it was with the other islands of the West Indies (Boomert Reference Boomert2006:166). Trinidad has long been considered the first stepping stone for prehistoric human colonization of the Lesser Antilles, given its physical proximity to the mainland (e.g., Callaghan Reference Callaghan2003; Wilson Reference Wilson2007).
Trinidad was connected to the South American mainland by a land bridge during periods of low sea level throughout the Pleistocene. The peninsular remnants of these land bridges still extend within 20 km of the mainland and include Huevos and Chacachacare islands, and the Isla de Petos. Precisely when the land bridges were submerged in the Holocene is a matter of some debate, with estimates ranging from 11.0 (Snow Reference Snow1985) to 1.5 ka (Kenny Reference Kenny2008). Holocene sea-level rise resulted in inundation of coastal embayments and aggradation within the river systems of Trinidad, creating a complex, interfingered system of coastal and floodplain areas and ecosystems. These environmental changes are evident at Banwari Trace, where the habitat exploited by local people changed from more freshwater to increasingly brackish (Boomert Reference Boomert2000; Harris Reference Harris1973).
Today, Trinidad has a maritime, tropical monsoon climate (Aw, according to the Köppen classification). Precipitation is strongly seasonal, with a pronounced January to May dry season generated by the annual southward shift of the Intertropical Convergence Zone (ITCZ). Topography and the northeast trade winds drive the spatial distribution of precipitation, such that some 3,750 mm of rain falls on the eastern flanks of the northern range and only 1,375 mm on portions of the west coast (Potter et al. Reference Potter, Barker, Conway and Klak2004). Annual precipitation at Banwari Trace is estimated to be ~1,500 mm. The temperature range is minimal, with an average annual mean monthly temperature range between 25 and 27° C, with a diurnal range of 10–15 °C.
Average temperatures on Trinidad were likely some 5–8 °C lower than the present during the last glacial maximum at ~18.0 ka (Burnham and Graham Reference Burnham and Graham1999; Curtis et al. Reference Curtis, Brenner, Hodell, Woods and Sergile2001). The late Pleistocene appears to have experienced continued or even increased aridity, followed by the onset of more mesic conditions in the Early Holocene. Although the timing of increased precipitation is uncertain, it is estimated to have occurred between 10.0 and 8.5 ka (Curtis et al. Reference Curtis, Brenner, Hodell, Woods and Sergile2001). Conditions remained moist through the Middle Holocene (8500–3000 cal BP) across the Caribbean, giving way to increased aridity in the Late Holocene (3.0 ka to present), although the extent and timing of this drying trend does not appear to have been even across the region (Curtis et al. Reference Curtis, Brenner, Hodell, Woods and Sergile2001; Haug et al. Reference Haug, Hughen, Sigman, Peterson and Röhl2001). A Late Holocene drying trend is evident from the study of several wetland cores from Trinidad (Farrell et al. Reference Farrell, Duncan, Jones, Dunning, Pearsall, Siegel and Siegel2018; Siegel et al. Reference Siegel, Jones, Pearsall, Dunning, Farrell, Duncan, Curtis and Singh2015).
Trinidad has a wide variety of ecosystems, the distribution of which reflects variation in topography, precipitation, soil, fire regimes, and the proximity of the South American mainland (Beard Reference Beard1946; Eyre Reference Eyre1998). Major upland ecosystems include tropical evergreen forest, tropical semi-evergreen forest, tropical seasonal deciduous forest, and savanna. Coastal and floodplain areas are home to several types of wetland ecosystems. Brackish coastal settings include various mangrove ecosystems that give way to sedge-dominated systems in more weakly brackish areas. Further inland freshwater swamps are variously dominated by sedges, grasses, palms, aroids, or swamp forest. Although the vegetation around Banwari Trace has been greatly altered by historic deforestation and drainage modification, it likely varied from tropical seasonal deciduous forest on hills and sloping land to various wetland types on the floodplain. Marine sediment cores indicate that the Gulf of Paria between Trinidad and South America was fully submerged by 6.2–6.0 ka (Boomert Reference Boomert2000), and relative sea levels continued to rise for several thousand years after, in part driven by isostatic subsidence associated with the growth of the Orinoco River delta (Wong et al. Reference Wong, Vletter and Krook1998).
Banwari Trace lends its name to two phases of Archaic culture on Trinidad: Early Banwari (6000–5000 BC) and Late Banwari (5000–4000 BC; Boomert Reference Boomert2000). These phases were based on tool assemblages and associated animal species recovered both at Banwari and at St. John, a coeval midden site on the Southern Oropuche River closer to the Gulf of Paria. The assemblages consist of stone and bone tools, including projectile points (arrow and fish spear), fish hooks, and grinding stones (Boomert Reference Boomert2000; Harris Reference Harris1973, Reference Harris1976).
Field Methods
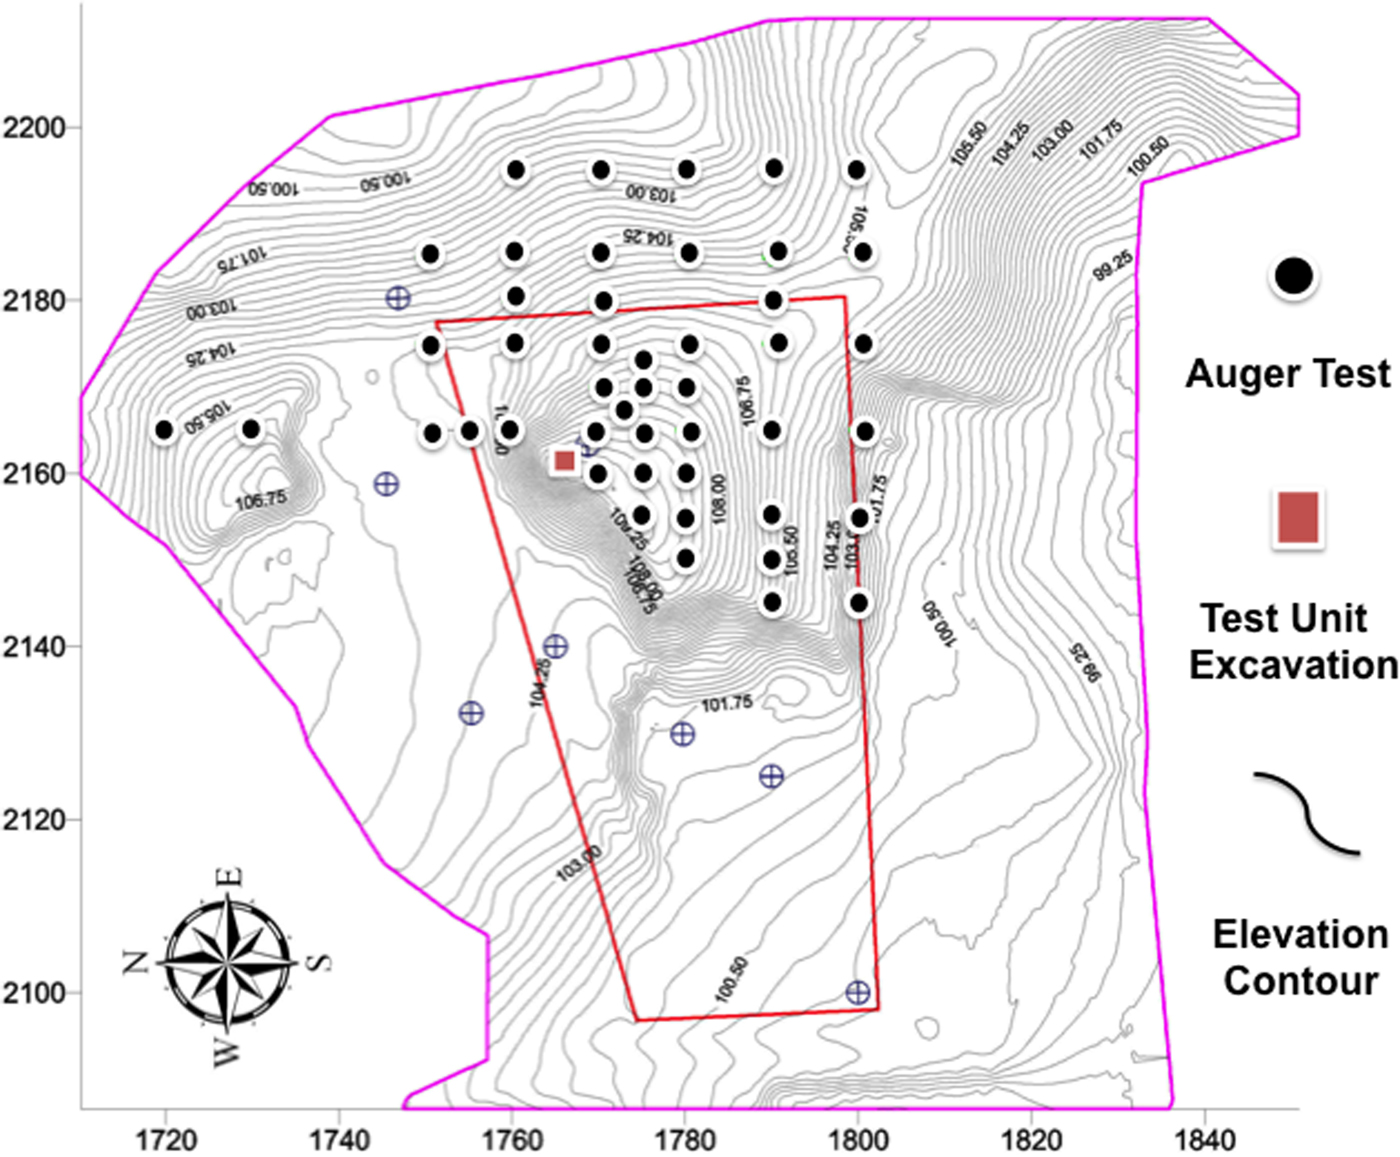
In 2005, a research project at Banwari Trace was undertaken by Harris, on behalf of the Archaeological Committee of Trinidad and Tobago and the University of the West Indies with UNESCO funding. Michael Kappers (In Terris Site Technics) created a digital map of Banwari Trace to determine the extent of the surviving portions of the site. A Sokkia SET500 electronic total station was used to take digital surface elevations of the site and to generate a grid for ~50 systematic auger test locations and to position a 1 x 1 m test unit excavation (Figure 2). Auger tests were used to define the limits of the remaining cultural deposits. The test pit excavation in 2006 (Pit C), directed by Harris in conjunction with Emily Lundberg, exposed a well-stratified shell midden, which extended to the top of a sloping surface of sterile saprolite, at a depth ranging from 120 to 150 cm below the surface. The exposed strata were found to contain major invertebrate and vertebrate taxa comparable to those found in the earlier excavations of Harris (Reference Harris1973, 1976; Table 2). Harris and Lundberg defined five primary levels with Levels II and IV subdivided into two subunits. Much of this work remains unpublished.
Topographic map of Banwari Trace showing the location of recent fieldwork. The recent 1 x 1 m test unit excavation is illustrated as the square. It was located approximately 4 m from Harris’ initial excavations. Map by Michael Kappers and modified by Kenneth Barnett Tankersley. (Color online)

Dunning recorded and collected soil samples from Pit C in 2007 from natural horizons apparent within the east profile of the excavation unit. The soil samples were analyzed at the University of Cincinnati, Department of Geography for soil texture and OM content, and for total phosphorus (P) at Spectrum Analytic Inc., Washington Court House, in Ohio. Particle size analysis was completed using manual dry sieving to obtain the sand fraction, followed by Bouyoucos hydrometer measurement for the silt and clay fractions. Soil organic matter (OM) was determined by loss-on-ignition (LOI), with samples being heated to 550° C for one hour. The total phosphorous content was determined using inductively coupled plasma–optical emission spectrometry (ICP-OES).
We examined Pit C in 2012, and stable carbon isotope, AMS 14C, and optical stimulated luminescence (OSL) dating samples were collected in 2013 from a cleaned profile wall. We recorded the depth below the surface, stratum thickness, Munsell soil color, and lithology for all of the samples. Five AMS 14C samples were extracted using a Marshalltown trowel, including three aliquots of wood charcoal collected from 50, 85, and 115 cm below the surface; a spirally fractured cortical artiodactyl bone collected from a depth of 40 cm; and an aliquot of bulk insoluble carbon was collected from a depth of 25 cm.
Six stable carbon isotope samples consisting of insoluble carbon aliquots were also collected using a Marshalltown trowel at a depth of 25, 45, 50, 75, 85, and 115 cm below the surface. Two OSL samples were collected by hammering 25 cm long and 5 cm diameter steel tubes into cleaned sediment faces. Sample BT1 was collected at a depth of 75 cm from the east excavation wall and sample BT2 was collected at a depth of 50 cm below the surface from the west excavation wall. The tubes remained sealed until opened in the Luminescence Dating Laboratory at the University of Cincinnati.
Laboratory Methods
Sample preparation for stable carbon isotope analysis, AMS radiocarbon dating, and optically stimulated luminescent dating were prepared at the University of Cincinnati. Charcoal was subjected to a standard acid-base-acid pretreatment, washed with hot (70 °C) 1 N hydrochloric acid (HCl) or 30 minutes to dissolve carbonates followed by a hot (70 °C) 1 N sodium chloride (NaOH) wash for 30 minutes, repeated until the liquid was clear, to remove organic acids, and a final 30-minute 1 N HCl rinse to neutralize the NaOH. The resulting samples were washed in pure water until the pH was 7. The cortical artiodactyl bone fragment was cleaned of adhering sediment, and then ground to a fine powder (~2 mm). Because radiocarbon ages obtained on bone apatite can produce age determinations that are younger than expected (Surovell Reference Surovell2000), the powdered bone was pretreated with a 5:1 sodium hypochlorite (NaOCl) and acetic acid (CH3COOH) mixture to minimize dating errors following the procedures outlined by Haas and Banewicz (Reference Haas and Banewicz1980).
Bulk insoluble carbon in soil samples (~10 ml) were air dried and hand ground to a powder (<75 µm) using a mortar and pestle. Inorganic matter was decalcified at room temperature in a 1 N HCl bath for ~12 hours, and the acid was rinsed out of each sample with pure water until the pH was 7 following the procedures outlined by Tankersley, Murari, and others (Reference Tankersley, Murari, Crowley, Owen, Storrs and Mortensen2015), Tankersley, Dunning, and others (Reference Tankersley, Dunning, Scarborough, Jones, Carr, Lentz and Lentz2015), and Tankersley and others (Reference Tankersley, Conover and Lentz2016). Wood charcoal and bone samples were sent to Center for Applied Isotope Studies at the University of Georgia in Athens for the followup AMS radiocarbon dating as well as the bulk insoluble soil carbon samples for stable carbon isotope analysis.
OSL dating samples were opened under safe light conditions in the laboratory. An approximately 2.5 cm thick layer of sediment was removed from each end of each tube to obtain sediment from the center of the tube for processing. This also reduced the possibility that any sampled sediment was exposed to daylight since sampling. Sediment from the ends of each of the tubes was dried to determine the present-day water content for each sample. These sediments were then crushed and sent to the Activation Laboratories Limited in Ancaster, Ontario, Canada for major elements fusion inductively coupled plasma mass spectrometry (ICP/MS) trace elements analysis to determine concentrations of uranium (U), thorium (Th), potassium (K), and rubidium (Rb) for dose rate (DR) calculations. The remaining sediments from the center of the tubes were pretreated with 10% HCl and 10% hydrogen peroxide (H2O2), rinsed in distilled water, dried and sieved to attract the 90- to 155-μm particle size fraction. A subfraction (~20 g) of sample was etched using 44% hydrofluoric (HF) acid for 80 minutes and then treatment with concentrated HCl for 30 minutes. The sediment was then rinsed in distilled water and acetate, and dried and sieved again to obtain grain size 90–155 mm in diameter and then passed low field controlled Frantz isodynamic magnetic separator (LFC Model-2) following the methods of Porat (Reference Porart2006). The resultant quartz sediment was finally sieved to obtain the 90–155 mm particle size fraction for OSL measurement.
Aliquots of quartz, containing approximately several hundred grains of the samples, were mounted onto ~6 mm diameter stainless steel discs as a small central circle ~3 mm in diameter. OSL measurements and irradiation were undertaken using an automated Riso OSL reader model TL-DA-20. Aliquots for each sample were initially checked for feldspar contamination using infrared stimulated luminescence (IRSL) at room temperature before the main OSL measurements were undertaken following methods of Jain and Singhvi (Reference Jain and Singhvi2001). Aliquots for samples that did not pass the IRSL test were etched in 40% HF for another 30 minutes to remove any feldspar, followed by 10% HCl treatment and sieving again. Samples that passed the IRSL test were used for OSL dating. Each aliquot for the samples was illuminated with blue LEDs stimulating at a wavelength of 470 nm (blue light stimulated luminescence [BLSL]) and detection optics included Hoya U-340 and Schott BG-39 color glass filters coupled to an EMI 9235 QA photomultiplier tube. A 90Sr/90Y beta source was used to irradiate the aliquots. Murray and Wintle's (Reference Murray and Wintle2000, Reference Murray and Wintle2003) single-aliquot regeneration (SAR) method was applied to determine the DE for age estimation. Aliquots that did not satisfy the criterion of a recycling ratio not more than 10% were not used in determining DE. A preheat of 240 °C for 10s was applied with the OSL signal being recorded for 40 s at 125 °C.
Descriptions of the Stratigraphic Units
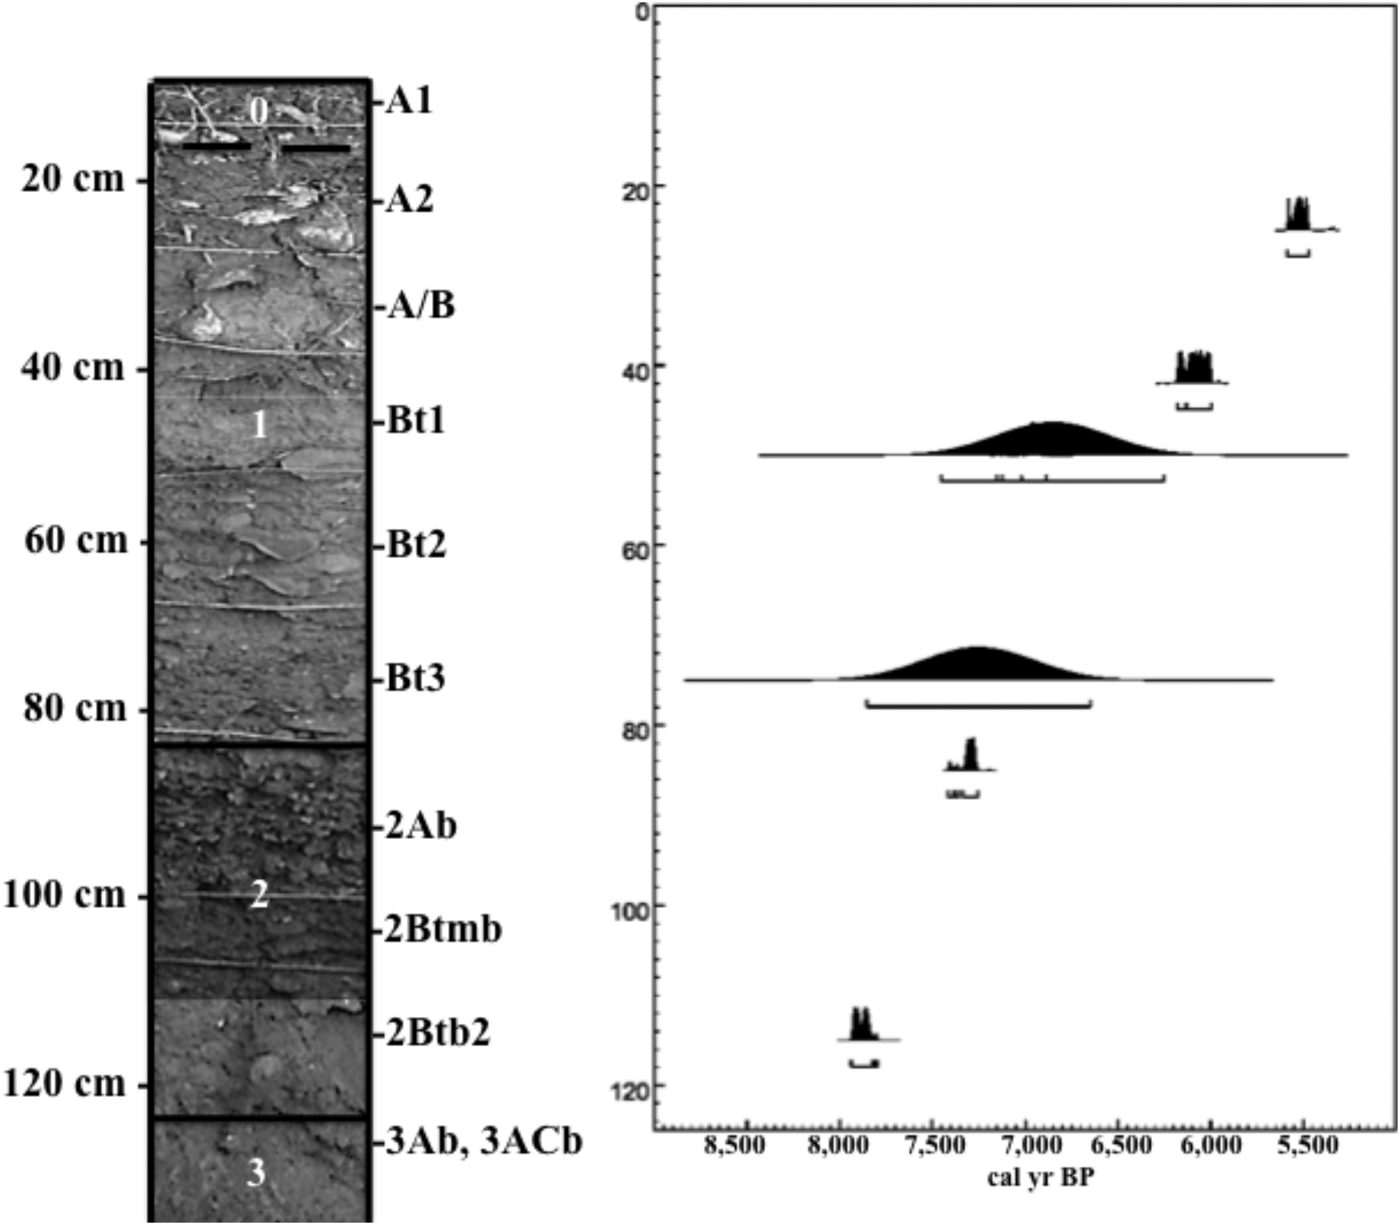
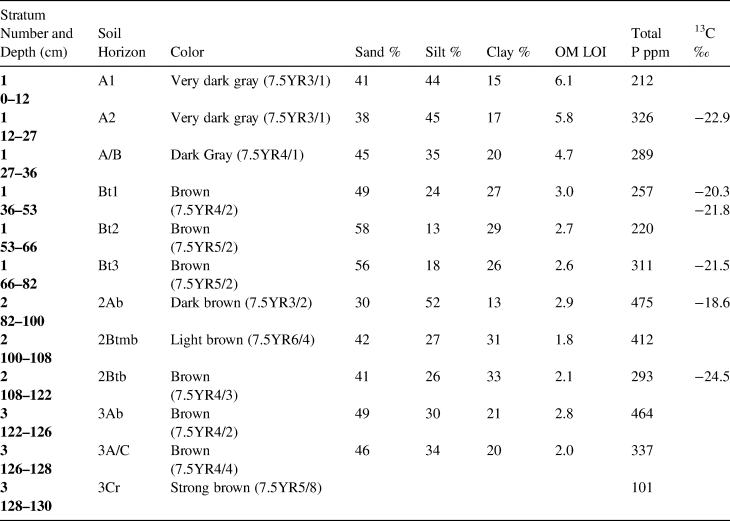
We identified three distinctive chronostratigraphic units defined on the basis of soil development phases, lithology, and bioclasts, rather than material culture, which partly correlate with the stratigraphy originally defined by Harris (Reference Harris1973; Figures 3 and 4, Tables 1, 2, and 3). Level 3 is the deepest (~122–130 cm) and oldest, a soil developed from weathering fine red sandstone and siltstone. This unit consists of a dense shell midden embedded in an Ab horizon (buried topsoil 3Ab: depths of 122–126 cm), a massive A/C horizon (depths of 126–128 cm), and a saprolitic sandstone or Cr horizon (depths of 128–130 cm). The A horizon of this hilltop paleosol is darker and more organic compared with those of nearby hills on which ultisols with ochric epipedons have developed. The dark color and relatively high OM can be attributed to comingled midden contents. This paleosol is fairly weakly developed because of subsequent burial and highly compressed by the overlying midden mass.
Stratigraphic profile of the Banwari Trace Pit C.

Correlation of stratigraphic nomenclature for this study (Excavation Pits A and C).

Level 2 (depths of 82–122 cm) consists of a dense shell midden, including another buried topsoil Ab horizon developed in what appears to be aeolian silt (2Ab: depths of 82–100 cm), a massive, partially cemented, calcium enriched (2Btmb) horizon with abundant shells (depths of 100–108 cm), and a massive clay-enriched (2Btb argillic) horizon with well-developed clay skins and scant shells (depths of 108–122 cm). The 2Btmb horizon corresponds most closely with Pit A Layer II of Harris (Reference Harris1973, 1976), which is described as having more earth than shell. Aeolian deposition is apparent in both initial burial of the 3Ab soil surface and at the temporary end of midden accumulation near the top of Level 2, probably indicating periods of abandonment.
Level 1 is the most recent stratum (depths of 0–82 cm); it includes the modern surface soil and its pedogenically altered parent materials. This unit consists of an A1 soil horizon with large crumb structure (depths of 0–12 cm), an A2 horizon with smaller crumb structure, abundant shells, and a few Cedrosan Saladoid pot sherds (depths of 12–27 cm), a transitional A/B horizon with small crumb structure, weakly developed clay skins, and fewer shells (depths of 27–36 cm), an argillic Bt1 horizon with subangular blocky structure, well-developed clay skins, and an irregular distribution of shells, possibly the result of bioturbation (depths of 36–53 cm), an argillic Bt2 horizon with a massive structure (depths of 53–66 cm), and a Bt3 horizon with massive structure, clay skins, and increasing density of shells with depth (depths of 66–82 cm). Bioturbation, probably in the form of animal burrowing and tree roots, is indicated in several places, most notably between depths of 36 and 53 cm. Downward clay translocation is a notable pedogenic process evident in Levels 1 and 2.
We suggest a “Level 0” overlapping the uppermost 25 cm of Level 1 (Figure 4). Plowing for sugarcane production during the historical era largely obliterated this poorly expressed stratum. Although the modern surface soil is recovering its structure since sugar cultivation ceased decades ago, the upper 15+ cm were variously churned, compacted, and truncated, making assessment of any Saladoid occupation surface impossible.
Phosphate levels are notably low in the saprolitic sandstone parent material at the base of Level 3 (see Table 3). Levels of phosphate enrichment vary in the overlying profile but are notably highest where midden material is densest.
Description of the Pit C Stratigraphic Units Defined on the Basis of Soil Development Phases, Lithology, Bioclasts, and Phosphorus and Stable Carbon Isotope Analysis.

Dating and Stable Carbon Isotope Results
14C Dating
We obtained five new AMS radiocarbon ages for three charcoal samples, one bone sample, and a bulk inorganic carbon sample. Radiocarbon ages were calibrated at 2σ to years before present (BP) using CALIB 7.1 and the IntCal13 Calibration. A list of the new AMS radiocarbon ages for Banwari Trace is provided in Table 1. All of the new radiocarbon ages date to the Middle Holocene climatic optimum and occur in proper chronologic sequence, and none of them overlap at 2σ.
Although our new AMS radiocarbon ages were obtained from a test unit in a different location of the Banwari Trace midden, they confirm the previous radiocarbon ages obtained from the 1969–1970 excavations. AMS radiocarbon ages from the deepest stratum, Level I of the 1969–1970 Pit A excavations (7508–8173 cal BP) and our 2013 Pit C Level 3 sample (7797–7936 cal BP) overlap at 2σ. AMS radiocarbon ages from Level II of the 1969–1970 Pit A excavations (6744–7312 cal BP), and our 2013 Pit C Level 2 sample (6890–7414 cal BP) overlaps at 2σ. AMS radiocarbon dates from the uppermost stratum, Level III of the 1969–1970 Pit A excavations (2354–7267 cal BP) and our 2013 Pit C Level 1 sample (5469–6181 cal BP) overlap at 2σ.
OSL Dating
The radioisotope, water content, and cosmic dose, DR, DE, and OSL age for the samples is presented in Table 1. The DS1 footnotes of Table 1 detail the dose rate calculation method (Duncan et al. Reference Durcan, King and Duller2015). Dose rates for all of the samples are very similar, having relatively low values (1.1 to 1.2 Gy/ka). Natural water content was <10%, but we assumed a conservative value with a large uncertainty (10 ± 5%) to reflect possible changes in water content over the geologic history of the site. The natural OSL signal for all aliquots were at least two orders of magnitude greater than background signal. The shine-down curves (luminescence stimulated in the laboratory over 40 s of exposure to light) for all aliquots showed fast decay patterns that confirm that the signal is from the fast component of luminescence, which is dominant in quartz. These patterns demonstrate that the samples would have likely been bleached quickly if only briefly exposed to sunlight. The majority of the aliquots provided good recuperation and recovery. A weighted mean value, and the average and standard error of all the aliquots were used in the age determination; both provide the same ages (Table 1).
Stable Isotope Values
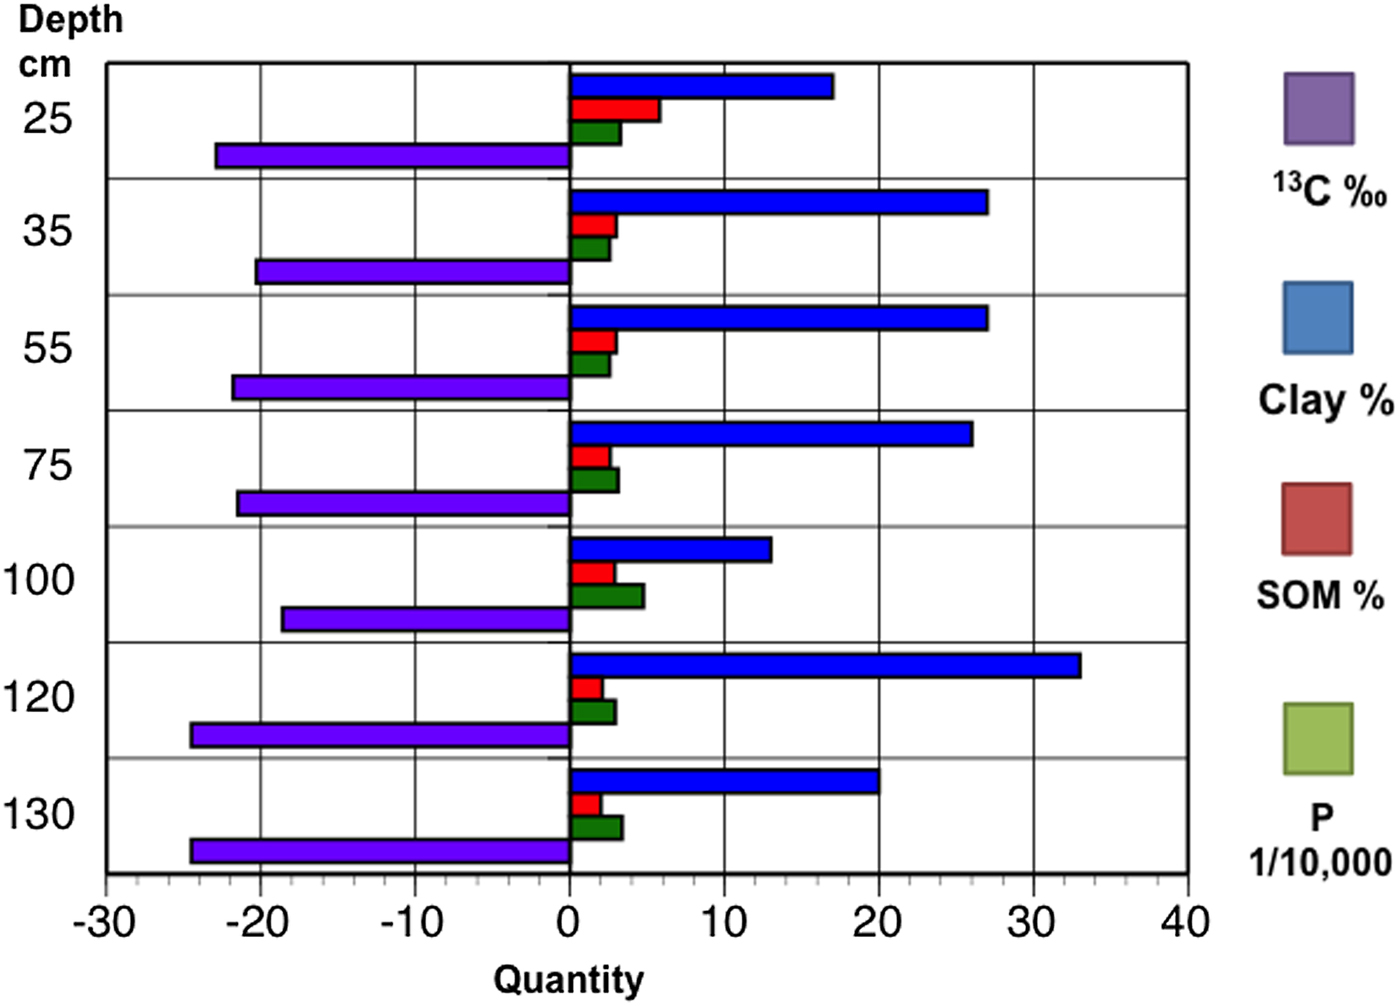
Six stable carbon isotope values (δ13C) obtained on bulk insoluble carbon were used to determine if the vegetation composition of Banwari Trace varied through time (see Table 3). The δ13C isotope values range from −24.5 to −18.6‰ with an average of −21.6‰. A single δ13C isotope value of −24.5‰ was obtained from just above Level 3, which is consistent with plants using C3 photosynthesis. A single δ13C isotope value of −18.6‰ was obtained from the 2Ab horizon of Level 2, which may be associated with plants using C4 or CAM photosynthesis or plants using C3 photosynthesis under stress from dry or drought conditions. Four δ13C isotope values ranging from −22.9 to −20.3‰ with an average of −21.6‰ were obtained from Level 1. Although all the δ13C values from Level 1 fall well within the range of plants using C3 photosynthesis, the higher values may be associated with an admixture of plants using C3 and C4 or CAM photosynthesis, or plants using C3 photosynthesis under stress from dry or drought conditions.
Discussion
The surviving deposits of Banwari Trace are comparable to those originally described by Harris (Reference Harris1973) in terms of stratigraphy, major invertebrate and vertebrate taxa, and chronology. Despite the differences in sample size, methodology, and accuracy, all of the recently obtained AMS radiocarbon ages overlap at 2σ values, with the conventional β-decay radiocarbon ages determined in 1970 (Tamers Reference Tamers1973).
Bar graph of the quantity of clay, organic matter, phosphorus, and stable carbon by depth for excavation Pit C. (Color online)

Although Harris (Reference Harris1973) initially dismissed the 2354–2842 cal BP age for the upper 25 cm of the 1969–1970 excavation unit, the recent discovery of pottery sherds in this stratum suggests this age determination is valid. Pottery from the Cedros type-site dates from ~2200 to 1900 cal BP and is thought to represent the migration of Saladoid people from the Oronoco River valley in Venezuela from ~4000 to 2550 cal BP (Boomert Reference Boomert2000). The human burial recovered from the Banwari Trace site in 1971 may also date to ~2770–2200 cal BP. Like the recently discovered pottery sherds, it was associated with the upper stratum, having been exposed ~22.5 cm below surface, together with five other groups of human bones (Harris Reference Harris1976:40). Ultimately, however, it will be necessary to obtain an AMS radiocarbon age directly on an aliquot of bone collagen or apatite to determine the true age of the human remains. We honored the wishes of the Carib and First Peoples of Trinidad, who requested to Peter Harris that the remains not be disturbed.
Development of the Level 1 soil occurred in conjunction with the deposition of the mortuary feature and earlier midden but has continued into the present day, following the final prehistoric abandonment of the site. The elevated P levels indicate significant deposition of organic waste in addition to the abundant shells and a few potsherds (see Table 3). The development of a complex, well-developed argillic horizon by downward translocation of clay indicates a long period of soil surface stability and in situ soil development in an environment with abundant precipitation. Abundant precipitation is also indicated by low δ13C values. An apparent hiatus in midden deposition and continued aeolian deposition separate Level 1 and Level 2.
Level 2 represents a period of midden deposition and shows evidence of a period of both occupation and soil development. Elevated P values indicate high amounts of organic deposition (see Table 3). The increasing silt content of the former surface soil (intermixed with midden) is likely attributable to aeolian deposition. Silty sediment was probably being blown onto the ridge from the adjacent southern Oropuche River floodplain and trapped by the coarse surface of the midden. The development of calcium-enriched and argillic (clay-enriched) horizons indicate that this soil surface remained stable (exposed at the surface) for a considerable amount of time (at least several hundred years and probably longer). Precipitation during this time was likely seasonally abundant, resulting in the downward translocation and deposition of clay within the soil profile, and the leaching of calcium from shells within the midden. Nevertheless, the internal precipitation of calcium within the soil profile above the argillic horizon indicates a pronounced annual dry season within the local climate, which may correlate with the high δ13C value from this stratum. Movement of silt from the nearby floodplain by winds would have most likely occurred in the dry season, perhaps accentuated by episodic droughts. As noted, a period of abandonment followed this occupation level.
The thinness of the Level 3 soil may be partially the result of truncation due to erosion associated with the clearance of forest dominated by C3 vegetation from the site during initial occupation, as suggested by a low δ13C value obtained from this stratum. The weakly developed A/C profile of the unit indicates a relatively short period of surface exposure during which the A horizon codeveloped with the deposition of shell midden material. High total P values indicate that a considerable amount of organic refuse was being deposited at this time (see Table 3). The site appears to have been abandoned for an unknown period of time after this initial occupation before midden deposition was renewed.
Archaic period shell middens and tool assemblages at Banwari Trace and the nearby St. John site located 15 km to the west are temporally comparable. Banwari Trace dates from 2,400–8,000 cal BP and St. John dates 6,500–7,280 cal BP. These ages suggest a shift from a focus on terrestrial to marine lifeways (~6000–5000 cal BP), indicating that brackish ecosystems occupied the lower Oropuche River drainage at that time (Boomert Reference Boomert2000; Harris Reference Harris1973; Pagán-Jiménez et al. Reference Pagán-Jiménez, Rodríguez-Ramos, Reid, van den Bel and Hofman2015). A sediment core extracted from a wetland near the St. John site in 2007 contained pollen and phytoliths, clearly indicating a later switch back from a brackish to a freshwater swamp around 1,500 years after sea level had stabilized and aggradation had pushed the local coastline westward (Farrell et al. Reference Farrell, Duncan, Jones, Dunning, Pearsall, Siegel and Siegel2018; Siegel et al. Reference Siegel, Jones, Pearsall, Dunning, Farrell, Duncan, Curtis and Singh2015).
Conclusions
Recent AMS radiocarbon and OSL dating demonstrate that the deepest stratum of the surviving Banwari Trace shell midden accumulated during the Middle Holocene climatic optimum and still represents the oldest human settlement in the West Indies. Three distinctive chronostratigraphic units were dated: ~7800–7900 (Level 3), ~6900–7400 (Level 2), and ~5500–6200 cal BP (Level 1). Stable carbon isotope values (δ13C) obtained from bulk insoluble carbon indicate that plants using C3 photosynthesis dominated mid-Holocene habitats with drier conditions possibly occurring during the later years of the Middle Holocene climatic optimum.
The discovery of Cedrosan Saladoid potsherds in the upper 25 cm of Level 1 during soil sampling suggest that the original radiocarbon age of ~2770–2200 cal BP for charcoal from the analogous Pit A stratum is valid (Harris Reference Harris1973, Reference Harris1976; Tamers Reference Tamers1973). Hence, we created the provisional introduction of an ephemeral Level 0 at the site. This radiocarbon and ceramic age also suggests that the human remains recovered in AD 1971 at a depth of ~20 cm may date to the Late Holocene and could be contemporary with an ephemeral Saladoid occupation.
The chronometric ages obtained for Banwari Trace and the St. John's shell middens clearly overlap in time and represent the earliest stages of human occupation of Trinidad and the West Indies. Future chronostratigraphic investigations at the St. John's site based on multiproxy geochronological and paleoenvironmental data will be crucial to our understanding of site taphonomy, occupational history, and drawing cultural comparisons with Banwari Trace. Without this additional research, there is an inherent danger that complex theoretical scenarios will be drawn between the two sites, based on underlying assumptions of environmental change or stability where it does not exist, which may result in oversimplification of the processes of human settlement, livelihood, and adaptation.
Acknowledgment
Our work at Banwari Trace was made possible by the invitation of the late Peter O'Brien Harris of the University of Trinidad and Tobago. Harris was a leading figure in the development of scientific archaeology on Trinidad. We wish to acknowledge his openness and generosity of mind and spirit. While Peter is dearly missed, his contributions to the archaeology of Trinidad live on. This paper also greatly benefited from the contributions of our interdisciplinary Quaternary research team, which included Brooke Crowley and Yurena Yanes, who accompanied the authors to Banwari Trace with Harris in 2012 and 2013. Funding from the Charles Phelps Taft Foundation, and the Court Family Foundation supported this study. We are especially grateful to the Trinidad and Tobago Historical Society, Archaeological Committee of Trinidad and Tobago, the University of the West Indies, UNESCO, Michael Kappers, Emily Lundberg, Mike Rutherford, and Hamlet Harripersad, caretaker of Banwari Trace. Dunning's work at Banwari Trace in 2007 was part of a multi-island paleoecology project and supported by two grants from the National Science Foundation (Grants BCS-0718819 and BCS-0818372) and one grant from the National Geographic Society (Grant 8438-08) awarded to Peter Siegel. Thanks to Tim Phillips for drafting the base map for Figure 1 and Michael Kappers (In Terris Site Technics) who created the topographic map of Banwari Trace in Figure 2. We also would like to thank Barry L. Isaac for the Spanish translation of the abstract and the editorial help of Geoffrey Braswell, three anonymous reviewers, and Emily Lundberg.
Data Availability Statement
All data generated or analyzed during this study are included in this published article.