I. INTRODUCTION
Bismuth, antimony, and tellurium nanoparticle-based compounds, such as Bi2Te3, Sb2Te3, and (Bi1−xSbx)2Te3, represent the forefront in technology for applications in thermoelectrics because of the unique semiconducting properties of the materials.Reference Zhang, Wang, Kraemer, Shi, Zhang, Snedaker, Ding, Moskovits, Snyer and Stucky1–Reference Chen, Sun, Sim, Peng, Wang, Fan, Hng, Ma, Boey, Li, Samani, Chen, Chen, Wu and Yan4 The ability to control the material composition, structure, and nanoparticle surface properties has proven critical to optimizing the resulting thermoelectric performance, where parameters, such as the relative electrical and thermal conductivities of the material, have a high impact on the final thermoelectric efficiency (dimensionless figure of merit, ZT).Reference Mott, Mai, Thuy, Maeda, Linh, Koyano and Maenosono5,Reference Mai, Mott, Thuy, Osaka and Maenosono6 With many advancements being made in this research area, the upper limit in thermoelectric efficiency based on manipulation of the nanoparticle composition, size, and shape is being approached.Reference Biswas, He, Blum, Wu, Hogan, Seidman, Dravid and Kanatzidis7 To significantly further improve the thermoelectric efficiency of nanostructured materials, new approaches are required, such as identifying unique material compositions that offer enhanced lattice disorder (atomic scale disorder) in the nanoparticle structure.Reference Biswas, He, Blum, Wu, Hogan, Seidman, Dravid and Kanatzidis7 Such ability serves as an additional parameter for suppressing the thermal conductivity of the material, which ultimately leads to an increase in ZT.Reference Biswas, He, Blum, Wu, Hogan, Seidman, Dravid and Kanatzidis7 With this in mind, new materials must be developed that exhibit unique properties, such as disordered crystal structures or unique semiconducting properties. Ideally, compounds containing bismuth, antimony, and/or tellurium would be ideal starting points because the thermoelectric properties of these materials are already known, with inclusion of an additional element or component imparting new properties, such as atomic lattice disorder. Gold is an intriguing candidate for the included element because of the potentially beneficial properties, it could impart, e.g., enhanced electrical conductivity. Gold nanoparticles have been extensively studied and are well known to be good electrical conductors with a well-understood thiol molecule chemistry, providing a straightforward avenue for the nanoparticle synthesis.Reference Wang, Luo, Schadt and Zhong8,Reference Maye, Luo, Lim, Han, Kariuki, Rabinovich, Lu and Zhong9 We considered how to impart the desirable properties of gold to Bi–Sb–Te-based materials, resulting in the development of three gold containing intermetallics, including digold bismuthide, gold diantimonide, and gold ditelluride. These Bi-, Sb-, and Te-containing gold intermetallics are expected to exhibit unique characteristics, leading to improvement in understanding how to effectively control the thermoelectric properties of increasingly complex materials. The intermetallics were prepared using a wet chemical synthetic procedure, and to our knowledge, they have not been synthetically created in this way prior to this work. In fact, these three intermetallics are well known as naturally occurring ores of gold with the names maldonite (Au2Bi), aurostibite (AuSb2), and calaverite (AuTe2).Reference Vaughan10 The bottom-up synthetic preparation described here allows the particle size of the materials to be kept in the range of nanometers to microns (desirable for thermoelectric applications) and allows avoidance of the inclusion of impurities to the particle structures (the ores typically also contain other elements such as silver).Reference Vaughan10 Although these initial materials themselves might display poor thermoelectric or semiconducting properties,Reference Charoenphakdee, Kurosaki, Harnwunggmoung, Muta and Yamanaka11 the preparation of these gold-containing materials is a first step toward further development of more sophisticated materials with increasingly complex structures, allowing advanced manipulation of the materials electrical and thermal conductivity properties.
II. EXPERIMENTAL
A. Chemicals
Gold tetrachloroaurate trihydrate (HAuCl4·3H2O, 99.9%), bismuth trichloride (BiCl3, 99%), antimony trichloride (SbCl3, 99%), tellurium tetrachloride (TeCl4, 99%), oleylamine (OAM, 70%), 1,2-hexadecanediol (90%), 1-decanethiol (DT, 96%), dioctylether (99%), and common solvents were obtained from Aldrich, Japan. Water was purified with a Millipore Direct-Q system (18.2 MΩ).
B. Instrumentation and measurements
Techniques, including transmission electron microscopy (TEM), energy dispersive x-ray spectroscopy (EDS), x-ray diffraction (XRD), and x-ray photoelectron spectroscopy (XPS), were used to characterize the size, shape, composition, and other properties of the nanoparticles. TEM and EDS analyses were performed on an Hitachi H-7600 instrument (Tokyo, Japan) operated at 100 kV with a Horiba EDS attachment. XRD patterns were collected in reflection geometry on a Rigaku RINT2000 x-ray diffractometer (Tokyo, Japan) at room temperature with Cu Kα radiation (wave length 1.542 Å). XPS analysis was performed on a Shimadzu Kratos AXIS-ULTRA delay-line detector (DLD; Kyoto, Japan) high performance XPS system. Photoelectrons were excited by monochromated Al Kα radiation. Detection was done with a DLD and a concentric hemispherical analyzer (CHA). The x-ray tube was operated at 150 W. The pass energy of the CHA was 20 eV for narrow scan spectra. The analyzed area on the specimen surface was 300 × 700 μm2 and was located in the center of the irradiated region. The instrument was operated at a vacuum level of 1 × 10⁻⁸ Torr. Samples for TEM, STEM-HAADF, and EDS elemental mapping were prepared by dropping the suspended nanoparticles onto a carbon-coated copper grid and drying in air. Samples for XPS analysis were prepared by deposition of the dried sample powders onto electrically conductive carbon tape.
C. Digold bismuthide (Au2Bi) synthesis
First, 0.0603 mmol of BiCl3, 1.25 mL of dioctylether, and 0.333 mmol of DT were put into a flask and sonicated at 30 °C, resulting in a clear yellow solution. In another flask, 0.646 mmol of HAuCl4·3H2O, 1.25 mL of dioctylether, and 0.333 mmol of OAM were combined and sonicated at 30 °C, resulting in a clear orange-red solution. Next, 1.338 mmol of 1,2-hexadecanediol and 22.5 mL of dioctylether were put into a three-neck flask under an argon gas atmosphere with vigorous stirring. The contents of the three-neck flask was heated to 250 °C, and then both the bismuth and the gold precursor solutions were quickly combined and injected into the reducing solution. The solution was heated for 10 min at 250 °C, leading to a dark brown color. After this time, the reaction solution was cooled to room temperature and a rough cleaning was performed by precipitating the synthesized material in ethanol to remove the reaction solvent and leftover reactants. The reaction temperature and heating time used were optimized to obtain a maximum yield of Au2Bi material.
D. Gold diantimonide (AuSb2) synthesis
First, 0.0696 mmol of SbCl3, 1.875 mL of dioctylether, and 0.5 mmol of DT were put into a flask and sonicated at 30 °C, resulting in a clear solution. In another flask, 0.347 mmol of HAuCl4·3H2O, 0.625 mL of dioctylether, and 0.167 mmol of OAM were combined and sonicated at 30 °C until a clear red-orange solution resulted. Next, 1.346 mmol of 1,2-hexadecanediol and 45 mL of dioctylether were put into a three-neck flask under an argon gas atmosphere with vigorous stirring. The contents of the three-neck flask were heated to 290 °C and then both the antimony and the gold precursor solutions were quickly combined and injected into the hot reducing solution. The solution was heated for 30 min at 290 °C leading to a dark gray color. The reaction temperature and heating time used were optimized to obtain a maximum yield of AuSb2 material. After this time, the reaction solution was cooled to room temperature and a rough cleaning was performed by precipitating the synthesized material in ethanol to remove the reaction solvent and leftover reactants.
E. Gold ditelluride (AuTe2) synthesis
First, 0.0729 mmol of TeCl4, 1.876 mL of dioctylether, and 0.5 mmol of DT were put into a flask and sonicated at 30 °C, resulting in a clear yellow solution. In another flask, 0.0395 mmol of HAuCl4·3H2O, 0.625 mL of dioctylether, and 0.167 mmol of OAM were combined and sonicated at 30 °C, resulting in a clear yellow-orange solution. Next, 1.355 mmol of 1,2-hexadecanediol and 22.5 mL of dioctylether were put into a three-neck flask under an argon gas atmosphere with vigorous stirring. The contents of the three-neck flask were heated to 250 °C and then both the tellurium and the gold precursor solution were quickly combined and injected into the hot reducing solution. The solution was heated for 30 min at 250 °C, leading to a dark brown color. The reaction temperature and heating time used were optimized to obtain a maximum yield of AuTe2 material. After this, the solution was cooled to room temperature and a rough cleaning was performed by precipitating the synthesized material in ethanol to remove the reaction solvent and excess reactants.
F. Material purification procedure
For each sample, after the synthesis and multiple purification steps by precipitation in ethanol, a significant degree of solid impurity remained which could not be easily removed. In response, each sample was further washed in a 10 mL volume of 1 M nitric acid solution for 3 min. After the acid treatment, each sample was rinsed in water and ethanol multiple times before being dried.
III. RESULTS AND DISCUSSION
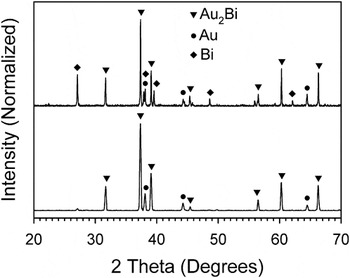
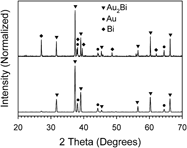
The resulting synthesized materials were dry and powdery in texture and had a gray to dark brown color. Each synthesized sample was characterized using XRD to study the crystalline properties. Figure 1 shows the powder XRD patterns for the Au2Bi material collected both before and after purification with a dilute solution of nitric acid. Before the purification, peaks for pure bismuth (rhombohedral), gold (face centered cubic), and Au2Bi (cubic) can be identified. However, after purification, the bismuth peaks are removed, leaving only the Au2Bi material and a small amount of pure gold impurity.12 Scherrer analysis of the primary peak (the 311 peak for cubic Au2Bi at 37.35°) after the purification step indicates a crystal grain size of 39.4 nm.
XRD patterns of both (top) unpurified and (bottom) purified Au2Bi material.

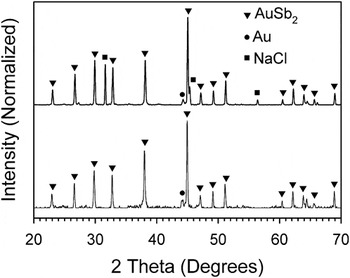
XRD analysis of the AuSb2 is shown in Fig. 2 for both unpurified and purified samples. A mixture of pure gold, AuSb2 (cubic), and NaCl (cubic) is observed for the unpurified sample. After treatment with dilute nitric acid, the NaCl disappears, leaving only the primary AuSb2 with a small amount of pure gold.13 The presence of NaCl in the as-synthesized particle mixture is slightly mysterious because none of the reactants contain sodium, however, the salt could form when the excess chlorine in the bismuth, antimony, or tellurium precursors scavenges sodium impurities in the reactants. In any case, the NaCl impurity was removed with the acid cleaning treatment. Finally, Scherrer analysis of the primary peak (the 311 peak for cubic AuSb2 at 44.96°) after the acid cleaning treatment indicates a crystal grain size of 57.9 nm.
XRD patterns of both (top) unpurified and (bottom) purified AuSb2 material.

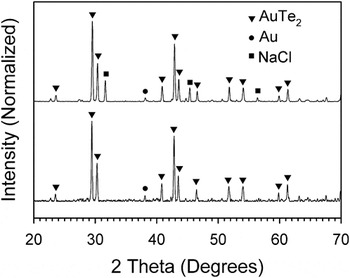
The synthesized AuTe2 material was analyzed with XRD both before and after purification as shown in Fig. 3. Much like the previous cases, a mixture of pure gold, AuTe2 (monoclinic), and NaCl are observed before treatment with dilute nitric acid. The NaCl impurity peaks disappear from the XRD pattern after purification, leaving only the AuTe2 and a small amount of pure gold remaining.14 Scherrer analysis of the primary peak (the 111 peak for monoclinic AuTe2 at 29.44°) after the acid treatment purification indicates a crystal grain size of 50.7 nm.
XRD patterns of both (top) unpurified and (bottom) purified AuTe2 material.

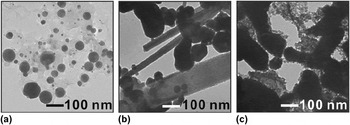
After the synthesis of each material, but before the purification step with nitric acid, dispersions of each sample were created in hexane, and TEM samples were cast. TEM samples of the particles after the nitric acid purification step could not be created because particle dispersions could not be formed after the treatment, likely because the acid treatment causes most of the surface protecting ligands of the materials to be removed. TEM and EDS analysis was conducted on each sample to study the materials morphological properties and average composition. Figure 4 shows the resulting representative TEM image for Au2Bi, AuSb2, and AuTe2 samples. For Au2Bi, particles were observed with a spherical shape and large size distribution ranging from about 10 to 100 nm. The particles have an average atomic composition of 54% gold and 46% bismuth, which roughly corresponds to the Au2Bi compound structure and reflects the presence of an impurity of bismuth in the sample, which was observed in the XRD patterns. For the AuSb2 material, a mixture of both rod and roughly spherical shaped particles were observed with a size ranging from about 50 to several hundred nanometers. We believe that the spherical-shaped particles are more rich in gold than the rod-shaped particles based on the differences in apparent density between the two areas. Due to higher electron contrast, the TEM images are darker for gold-rich materials because gold is more dense than antimony. Despite this, analysis using EDS indicates that both types of particles contain both gold and antimony elements with an average atomic composition of 47% gold and 53% antimony. The composition is consistent with the AuSb2 structure but reflects the presence of an excess amount of gold. Finally, for the AuTe2 material, the TEM image reveals what appears to be highly clustered aggregates of smaller particles. The small particles appear to be roughly spherical in shape. The EDS composition analysis of the sample shows an average atomic composition of 31% gold and 69% tellurium, very close to the expected value for the AuTe2 structure, suggesting that the sample contains little impurity.
TEM images of (a) Au2Bi, (b) AuSb2, and (c) AuTe2 materials.

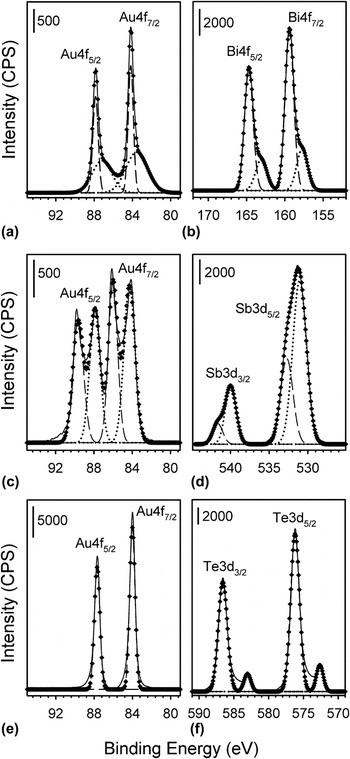
To gain an understanding of the chemical nature and composition of the three synthesized materials, XPS analysis was conducted. Figure 5 shows the XPS spectra collected for each sample in the Au4f region as well as in the Bi4f, Sb3d, and Te3d regions for the Au2Bi, AuSb2, and AuTe2 samples, respectively. At first glance, the data look complex and appear to indicate a high degree of inhomogeneity in the particle composition. However, taking into account, the XRD results as well as the treatment strategy to purify these materials, the chemical nature, and the structure relationship can be understood. For Au2Bi, The Au4f area shows strong 7/2 and 5/2 spin state peaks with tailing to lower binding energy. Similarly, for the Bi4f area, 7/2 and 5/2 spin state peaks show an asymmetric tailing to lower binding energy. These asymmetric peaks were deconvoluted using two Gaussian functions for each spin state (four functions for each complete spectrum). The analysis revealed a peak maximum at 84.2 eV for the Au 4f7/2 spin state with the shoulder occurring at 83.6 eV. The higher binding energy component can be attributed to Au metal,Reference Lim, Mott, Engelhard, Pan, Kamodia, Luo, Njoki, Zhou, Wang and Zhong15 whereas the lower intensity shoulder suggests Au in the Au2Bi material.16–Reference Van Attekum and Trooster18 Similarly, the Bi 4f7/2 peak shows a maximum at 159.4 eV with a shoulder at 157.7 eV. In this case, the higher binding energy component can be attributed to Bi2O3,16,Reference Debies and Rabalais19 whereas the lower binding energy component arises from the Bi in the Au2Bi material.16
XPS spectra for Au2Bi in the (a) Au4f and (b) Bi4f areas, AuSb2 in the (c) Au4f and (d) Sb3d areas, and AuTe2 in the (e) Au4f and (f) Te3d areas. Solid lines represent the experimentally collected data, whereas dotted and dashed lines represent the deconvoluted components for lower and higher binding energy fractions, respectively. The diamond-shaped points represent the sum spectra of the deconvoluted fractions.

For AuSb2, the Au 4f area shows clear splitting of the 7/2 and 5/2 spin state peaks, whereas the Sb3d area shows asymmetric tailing toward higher binding energy for both 5/2 and 3/2 spin states. These peaks were also deconvoluted using two Gaussian components for each spin state (four components for each full spectrum). The Au4f 7/2 peak shows maxima at both 86.0 and 84.3 eV, which can be attributed to Au in the AuSb2 material (the higher binding energy component)16,Reference Sham, Perlman and Watson20 and Au metal (the lower binding energy component).Reference Lim, Mott, Engelhard, Pan, Kamodia, Luo, Njoki, Zhou, Wang and Zhong15 For the Sb3d area, the 3/2 spin state peak was chosen for analysis because of the overlap of the oxygen 1s peak with the 5/2 spin state of Sb. The Sb 3d3/2 peak shows a shoulder at 541.7 eV with a peak maximum at 540.0 eV, which is attributed to Sb2O3 (higher binding energy component)16,Reference Benvenutti, Gushikem, Vasquez, de Castro and Zaldivar21 and Sb in the AuSb2 compound (lower binding energy component).Reference Lim, Mott, Engelhard, Pan, Kamodia, Luo, Njoki, Zhou, Wang and Zhong15
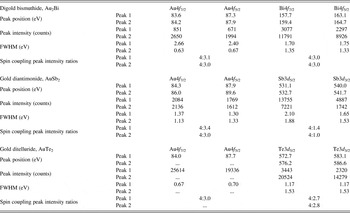
Finally, for the AuTe2 sample, the Au4f area shows 7/2 and 5/2 peaks that appear symmetrical with minimal tailing. These peaks were fit with single Gaussian curves for each component (two total for the spectrum) revealing peak maxima at 84.0 and 87.7 eV for 7/2 and 5/2 spin states, respectively. These 4f peaks primarily arise from pure Au metal.Reference Lim, Mott, Engelhard, Pan, Kamodia, Luo, Njoki, Zhou, Wang and Zhong15 The Te3d area shows both 5/2 and 3/2 spin state peaks with small satellites shifted to relatively lower binding energy. This spectrum was deconvoluted, again using two gaussian components, for each spin state peak (four total for the spectrum). The Te3d 5/2 peak shows maxima at 576.2 eV for the most intense component and at 572.7 eV for the lower intensity component. The higher binding energy component is consistent with TeO2,16,Reference Christie, Sutherland and Walls22,Reference Young and Luttrell23 whereas the lower binding energy component matches with the expected position for Te in the AuTe2 material.Reference Christie, Sutherland and Walls22,Reference Young and Luttrell23 The relatively low peak intensity of the lower binding energy component in the Te3d area suggests that the corresponding Au component (a peak originating from Au in the AuTe2 material) would also display a relatively low intensity. This may be why the Au4f peaks show a slight degree of peak broadening at their base but no clear shoulder or satellite peaks originating from AuTe2. This observation could occur as a result of a slightly thicker oxide layer on the AuTe2 intermetallic particles than for the Au2Bi or AuSb2 material. Table I provides a tabulated summary of the deconvolution data from the XPS analysis, including the derived peak positions, peak intensity, Full Width at Half Maximum (FWHM), and spin coupling peak intensity ratios.
XPS fitting derived peak parameters for Au2Bi, AuSb2, and AuTe2 materials.

The peak intensity ratios are presented in the format 4:X for convenience in comparing to reference values.
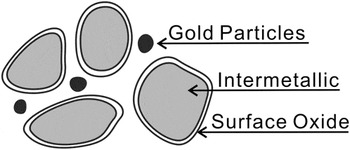
The aggregate of data suggests that the synthesized Au2Bi, AuSb2, and AuTe2 particles possess a complex structure containing pure gold, intermetallic, and oxides. Furthermore, the oxide is not detected by XRD analysis but becomes a dominant feature in the XPS analysis. The preparation technique helps explain these observations. First, in the primary synthetic preparation of each material, a small amount of pure metallic gold is produced. This pure gold metal is observed in the XRD analysis as a minor impurity and is also observed as a significant presence in the XPS spectra. Next, these materials are purified in a dilute nitric acid solution (to remove metallic bismuth, antimony, or tellurium). This nitric acid treatment causes the molecular encapsulating species to be removed from the particle as well as possible leaching of some gold at the particle surface. This deprotection allows oxidation of the Bi, Sb, or Te species at a relatively thin and interfacial layer at the particle surface, creating a thin and inherently amorphous layer of oxide encasing each particle. This layer would have a thickness less than about 3 nm, supported by the fact that no oxide species are observed in the XRD patterns of these materials. This particle structure would show relatively strong contribution from the surface oxide species in XPS because of the strong surface sensitivity of the technique, yet the oxides would not be detected in XRD because of the thin and amorphous nature. In addition, the gold impurity likely exists as discrete particles that are not incorporated into the intermetallic structure because their contribution to the XPS spectra is relatively strong, meaning that there are no surface oxides to suppress the peak intensity. Figure 6 shows a schematic diagram of the proposed general particle structure for the Au2Bi, AuSb2, and AuTe2 materials based on the preparation technique and XRD/XPS analysis.
Schematic illustration of the general particle structure for each intermetallic material. The particles and structures are not drawn to scale or relative abundance.

IV. CONCLUSIONS
Digold bismuthide, gold diantimonide, and gold ditelluride intermetallics were synthesized using a wet chemical approach, resulting in particles with a nano- to microparticle size. XRD analysis was used to confirm the structure of the resulting materials, whereas TEM was used to identify the morphology and size of the particles. XPS further demonstrated the composition and surface properties of the synthesized materials, indicating a thin and amorphous oxide layer coating each particle. These materials may be further refined to create more sophisticated materials with enhanced stability, robustness, and surface chemistry for use in advanced applications, such as thermoelectrics. In addition, the synthetic techniques developed here enhance our understanding for how to reliably create nanoparticle-based intermetallic materials.
ACKNOWLEDGMENTS
This work was supported by the Grant-in-Aid for Scientific Research (C) and partly by the Comprehensive Support Programs for Creation of Regional Innovation: “Practical Application Research.”