I. INTRODUCTION
Thermomechanical processing of metallic materials, which may consist of some combination of deformation and heat treatment, results into microstructures and textures, which are dependent on the nature of deformation used. Most deformation processes such as rolling, forging, and extrusion are capable of generating bulk through-thickness microstructure and texture gradient, in addition to the local inhomogeneities.Reference Truszkowski, Krol and Major 1 – Reference Rollett, Wright, Kocks, Tomé, Wenk and Mecking 10 In rolling, e.g., the through-thickness microstructure gradient has been attributed to the shear stresses set up by the roll gap geometryReference Truszkowski, Krol and Major 1 and metallurgical parameters such as alloying elements,Reference Kalu, Jonas, Bieler and Bowman 2 initial grain size,Reference Cieslar, Vostry, Ocenasek and Stulikova 3 and size and volume fraction of second phase particles.Reference Jensen, Hansen, Humphreys, Kallend and Gottstein 4 The friction at the sheet surface produces shear stresses, whereas deformation in the center of the sheet is primarily plane strain. The difference in the deformation modes leads to the development of a through-thickness gradient in crystallographic texture and microstructure. This phenomenon has been well researched and documented, and it is unanimously agreed that the through-thickness texture gradient in rolling depends on the roll gap geometry (expressed as l/h ratio, where l is the contact length between the rolls and the specimen and h is the sample thickness), the friction conditions, strain rate, and temperature. Besides the rolling texture at the midsection, shear textures have been observed at the quarter thickness and at the surface for l/h < 0.5 and l/h > 5, respectively.Reference Truszkowski, Krol and Major 1 , Reference Truszkowski, Krol and Major 11 For intermediate values of l/h, a weak texture has been reported to appear at the quarter thickness.Reference Mishin, Bay and Jensen 12 These results are also supported by the computational modeling techniques such as viscoplastic self-consistent model and finite element method.Reference Engler, Huh and Tome 13
Although deformation heterogeneity in wire drawing has been reported,Reference Schamp, Verlinden and Van Humbeeck 5 – Reference Rollett, Wright, Kocks, Tomé, Wenk and Mecking 10 certain aspects of their deformation behavior remain unclear. It is apparent that during wire drawing, the outer (surface) region of the wire is redundantly deformed by shear,Reference Schamp, Verlinden and Van Humbeeck 5 thereby creating a weak circular texture.Reference Park and Lee 6 , Reference Rollett, Wright, Kocks, Tomé, Wenk and Mecking 10 The inner (core) region, on the other hand, is homogeneously deformed by compressive stresses along the main axes, consequently leading to the formation of a strong <111> + weak <100> duplex fiber texture,Reference McHargue, Jetter and Ogle 7 – Reference Shin, Jeong and Lee 9 typical of axisymmetrically deformed FCC materials. There is therefore a defined radial microstructural and textural gradient across the transverse section of the wire. Nevertheless, there are still pertinent issues, such as the effect of deformation heterogeneity on the recrystallization behavior of the wires, which are yet to be addressed. Undoubtedly, the spatial variations in the microstructure and texture that are produced during deformation have substantial influence on the spatial distribution and evolution of the microstructure and texture during subsequent thermomechanical processing. The aim of this study was to carry out a detailed characterization, through local orientation measurements and hardness, of the deformation heterogeneity, which develops during wire drawing, and its influence on the low temperature annealing behavior of the drawn oxygen-free high conducting (OFHC) Cu wires. The wires were annealed at 170 °C, which is within the lowest temperature range (150–200 °C) for which recrystallization has been reported in deformed pure copper.Reference Necker, Doherty and Rollett 14
II. EXPERIMENTAL PROCEDURE
The present work was carried on three OFHC Cu wires, fabricated by cold drawing to true strains, ε, of 2.3 (low strain), 3.1 (intermediate strain), and 3.6 (high strain) [where ε = 2ln(d 0/d), d 0 is the initial diameter, d is the final diameter]. The wires were drawn at room temperature, from a 9.5-mm rod, at a controlled rate of 10 mm/s using tungsten carbide conical dies with a 14° semiangle. The drawing was carried out in several steps, with a reduction of about 10% per step, and lubricated with fats emulsion (concentrations as high as 20–25% fats). Specimens of the drawn wires were isothermally annealed at 170 °C for 1 h and immediately quenched in water. It is important to note that the annealing temperature is within the lowest temperature range for which recrystallization has been reported in deformed pure copper.Reference Necker, Doherty and Rollett 14 Detailed analysis of the specimens was performed on both the longitudinal and transverse sections of the wires using optical microscopy, orientation imaging microscopy (OIM), and nanohardness measurement.
Local orientations were mapped on longitudinal sections by means of OIM in the JOEL 6380 scanning electron microscope (München, Germany). All specimens were mechanically polished and etched by swabbing for about 15 s with an equal amount of ammonium hydroxide (NH4OH) and hydrogen peroxide 3% (H2O2). Additional polishing was done on a vibratory machine with a 0.25-μm colloidal silica suspension for 2 h.Reference Waryoba and Kalu 15 All OIM analyses were done by OIM 4.0 software, developed by EDAX-TSL Inc., Draper, UT. The grain boundary maps were constructed based on a 15° cutoff limit between low-angle grain boundaries and high-angle grain boundaries (HAGBs). To avoid spurious boundaries, especially in deformed conditions, the minimum boundary misorientation was set to 2°. For statistical purposes, five OIM scans from different regions were analyzed for each specimen.
Nanoindentation tests were performed using a nanohardness tester from CSEM Instruments SA (Peseux, Switzerland), equipped with an optical microscope for precise selection of the indentation zone and posttest indent identification. Maximum load of 10 mN was applied using a Vickers diamond indenter with loading and unloading rates of 10 mN/min and a holding time of 10 s at maximum load.
III. EXPERIMENTAL RESULTS
A. Nanohardness, microstructure, and microtexture of as-deformed materials
1. Microstructure and nanohardness of drawn wires
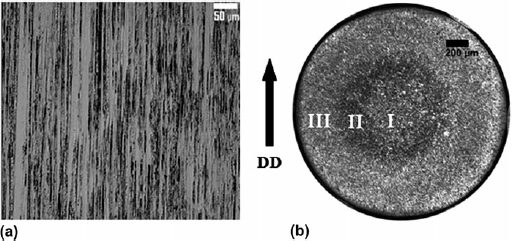
Typical microstructure of the drawn wires, obtained from the longitudinal section [Fig. 1(a)] and cross section [Fig. 1(b)] of the intermediate-strained wire, is presented in Fig. 1. In all three wires, the microstructure consisted of elongated grains, parallel to the drawing direction (DD). The selective etching (dark and bright) indicates deformation heterogeneity across the transverse sections of the wires. Three distinct regimes can be clearly identified: Regime I—inner core, Regime II—midsection, and Regime III—outer region. It is interesting to note that for all the three wires, the microstructure of the midsection appeared darker than the inner core and outer regions. Furthermore, the inner core region was off center in some cases, which may be attributed to the misalignment of the drawn wires with respect to the dies.
Optical micrographs showing (a) elongated deformed grains (parallel to DD) and (b) the three concentric regimes in the intermediate-strained wire.

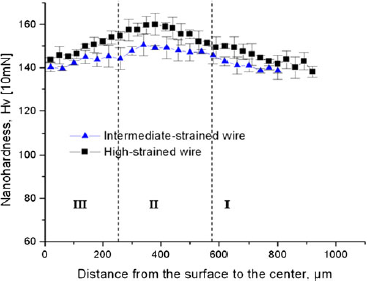
The nanohardness profiles across the transverse section (perpendicular to wire axis) of the three wires were symmetric and similar. Figure 2 presents a representative variation of the nanohardness, from the edge to the center of the intermediate-strained and highly strained wires. Consistently, the midsection had a relatively higher nanohardness compared to the inner core and outer region; and the nanohardness of the highly strained wire was the highest.
The nanohardness profile from the edge to the center of the intermediate-strained and highly strained wires.

2. Microtexture of drawn wires
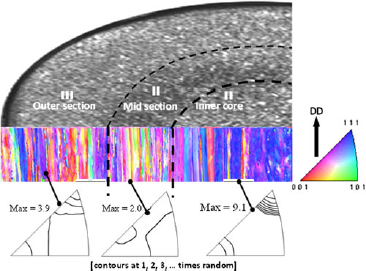
The OIM measurement showed that the microtexture across each wire was inhomogeneous, in agreement with the three microstructural regimes identified. Figure 3 presents the inhomogeneous distribution of the microtexture across the three regimes for the intermediate-strained wire. The orientation image is shaded, with lattice poles aligned parallel (//) to the DD, according to the color-coded key (inserted triangle) presented as part of Fig. 3. Thus, red-colored areas have <100>//DD orientation and blue areas have <111>//DD orientation. Evidently, the OIM orientation color map shows that the inner core was dominated by strong <111> + weak <100> duplex fiber texture. On the other hand, the midsection and outer regions had comparatively weaker texture. The corresponding inverse pole figures (IPFs) present a qualitative comparison of the intensity contours of the texture components for the three regimes. This confirmed that the inner core region was characterized by strong <111> + weak <100> fiber texture (maximum intensity of 9.1), compared to the weaker texture in the outer and midsection regions, with maximum intensities of 3.9 and 2.0, respectively.
OIM orientation map (orientations//DD) and corresponding IPFs of the intermediate-strained wire, showing grain orientation in the outer region, midsection, and inner core region (contours are at 1, 2, 3, … times random).

B. Nanohardness, microstructure, and microtexture of annealed materials
1. Nanohardness of annealed wires
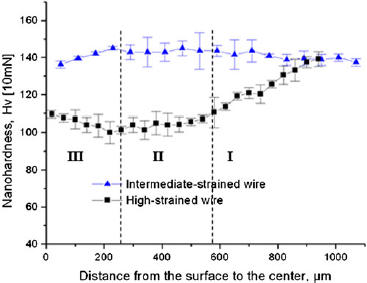
Figure 4 shows the nanohardness profile across the transverse section of the intermediate and highly strained wires after isothermal annealing at 170 °C for 1 h. It is clear that the nanohardness profile for the intermediate-strained wire resembles the profile in Fig. 2, where the midsection (Regime II) has a relatively higher nanohardness compared to the inner core and outer region. This obviously indicates that annealing, at this temperature and time, had little or no effect on the microstructure of this wire. On the other hand, the nanohardness profile for the highly strained wire showed a significant drop in the nanohardness of the mid and outer regions compared to the inner core. While the hardness of the outer and mid regions dropped (from the as-drawn condition) by about 35 and 50 Hv, respectively, the hardness of the inner core only dropped by ∼5 Hv. The drastic drop in the hardness in the mid and outer regions is attributed to recrystallization in these regions as presented in the Sec. III. B. 2.
Variation of nanohardness across intermediate and highly strained wires after isothermal annealing at 170 °C for 1 h.

2. Microstructure of annealed wires
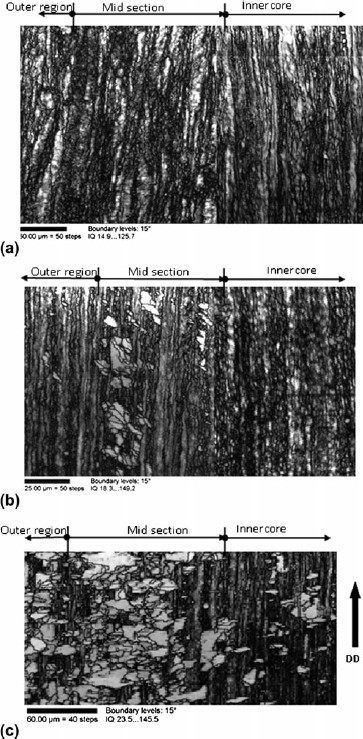
OIM analysis provided quantitative and qualitative information about the recrystallization behavior of the annealed wires. Figure 5 shows the OIM image quality (IQ) maps of the wires following the isothermal annealing for 1 h. Here, the IQ map is used to assess qualitatively local strain distribution (i.e., dislocation density) in a microstructure. The IQ describes the quality of an electron back scatter diffraction pattern and is dependent on the perfection of the crystal lattice in the diffracting volume. Thus, any distortions to the crystal lattice within the diffracting volume will produce lower quality (more diffuse) diffraction patterns. Conversely, high IQ indicates low dislocation density. Hence, regions with high IQ usually appear as bright regions on the IQ map. This implies that recrystallized and well-recovered grains usually appear as bright regions, while deformed structures show up as dark regions. The IQ map of the annealed low-strained wire presented in Fig. 5(a) essentially consists of deformed structures dotted with recovered regions. On the other hand, the IQ map of the annealed intermediate-strained wire [Fig. 5(b)] shows pockets of recrystallized grains (bright regions) superimposed on the unrecrystallized structure (dark regions). This structure is suggestive of a material at the early stages of recrystallization. Most of the nucleating grains were observed in the midsection. In contrast, the annealed highly strained wire exhibited partial recrystallization as shown in Fig. 5(c). While the inner core was essentially unrecrystallized, a more extensive recrystallization occurred in the midsection than in the outer region.
OIM IQ maps of the annealed OFHC copper showing (a) elongated and unrecrystallized microstructure of the low-strained wire, (b) pockets of recrystallized grains (light shading) in the intermediate-strained wire, and (c) partial recrystallization in the highly strained wire, after isothermal annealing at 170 °C for 1 h.

3. Microtexture of annealed wires
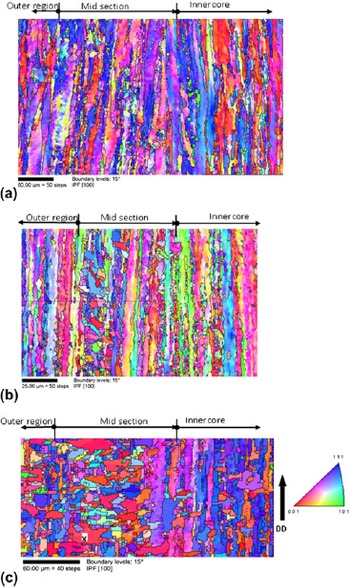
Figure 6 shows OIM orientation image maps of annealed specimens after isothermal annealing at 170 °C for 1 h. The orientation map of the annealed low-strained wire presented in Fig. 6(a) shows unrecrystallized microstructure with a weak <111> + <100> texture. Figure 6(b), on the other hand, shows nucleating grains with random orientations at the midsection of the annealed intermediate-strained wire. The microtexture of the annealed highly strained wire in Fig. 6(c) shows a superposition of recrystallized and deformed texture. While the recrystallized grains in the midsection and outer region had a strong <100> + weak <111> duplex fiber texture, the inner core had elongated unrecrystallized grains with a strong <111> and a weak <100> + <112> texture. Interestingly, most of the recrystallized grains at the midsection grew either laterally with <100>//DD orientation or axially with <111>//DD orientation.
OIM IPF maps (orientations//DD) of OFHC copper wires showing grain orientations in (a) low-strained wire, (b) intermediate-strained wire, and (c) highly strained wire, after isothermal annealing at 170 °C for 1 h. Grain X is referenced in Sec. III. B. 4.

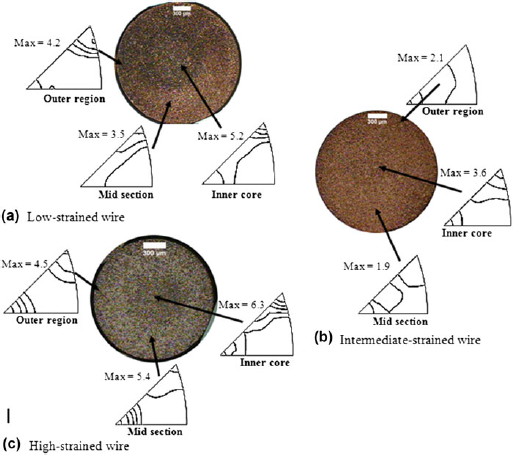
Figure 7 presents distribution of the microtexture across each wire during isothermal annealing at 170 °C. In Fig. 7(a), the unrecrystallized low-strained wire exhibited a strong <111> + weak <100> fiber texture in the inner core and outer regions and a shallow <111> + <112> + <100> in the midsection. The <111> component had the highest intensity in all three regimes, and its maximum intensity was 5.2, 4.2, and 3.5 at the inner core, outer region, and midsection, respectively. The annealed intermediate-strained wire [Fig. 7(b)] developed a shallow <111> + <100> texture in the inner core, a random texture in the midsection, and a weak <100> + <112> texture in the outer region. While the <111> component had the highest intensity in the inner core, the <100> was the strongest component in the outer region and midsection. The maximum intensity of the <111> component was 3.6, whereas that of <100> was 2.1 and 1.9 in the outer region and midsection, respectively. The partially recrystallized highly strained wire in Fig. 7(c) retained a strong <111> + weak <100> in the inner core and developed a weak <112> component. On the other hand, its midsection developed a strong <100> + weak <111> fiber texture, and the outer region had a <100> + <111> duplex fiber texture with a slightly stronger <100> component. The maximum intensity of the <111> component at the inner core was 6.3, comparatively weaker than 15.7 for the as-drawn condition. The <100> component in the outer region and midsection had a maximum intensity of 4.5 and 5.4, respectively, which were both stronger than in the as-drawn condition. Annealing resulted in a weakening of the <111> component in all three regimes and strengthening of the <100> component in recrystallized regions.
Distribution of the microtexture across the transverse section of (a) low-strained wire, (b) intermediate-strained wire, and (c) highly strained wire, after isothermal annealing at 170 °C.

4. Detailed analysis of recrystallized grains
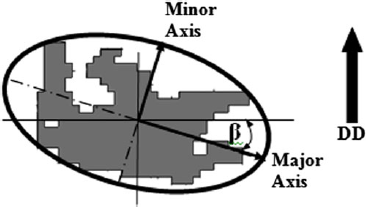
Classification technique: The microstructure of the partially recrystallized regions of the highly strained wire consisted of two types of recrystallized grains. To provide a comprehensive analysis of the microstructure, a more detailed categorization of the grain morphology, growth direction, and grain boundary characteristics must be defined. The two types of recrystallized grains were identified as: (i) type “A” grains, which grew mostly laterally with respect to DD, and (ii) type “B” grains, which grew axially, along the DD. The axial and lateral orientations were determined from the shape of the individual grains. Any recrystallized grain, e.g., grain marked “X” in Fig. 6(c), can be enclosed within an ellipse as shown in Fig. 8. The inclination of the major axis of the ellipse from the horizontal direction defines the grain shape inclination angle, β. In this analysis, if the angle β is within 45°, then the grain is considered to be a lateral grain, otherwise it is an axial grain. To distinguish the growth behavior of the two types of grains, equiaxed grains with aspect ratio (AR) ≥0.7, i.e., having near isotropic growth, were not considered. The AR is defined as the length of the minor axis divided by the length of the major axis, and this can range from 0 to 1. The AR is a prime indicator of anisotropic growth in the grain, i.e., an AR of 1 suggests isotropic growth. A detailed analysis of the grain boundary characteristics and their influence on the recrystallization of the two types of grains has been reported elsewhere.Reference Waryoba, Kalu and Rollett 16
Grain shape and inclination used to categorize axial and lateral recrystallized grains in highly strained wire, after isothermal annealing at 170 °C.

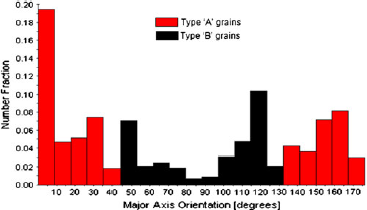
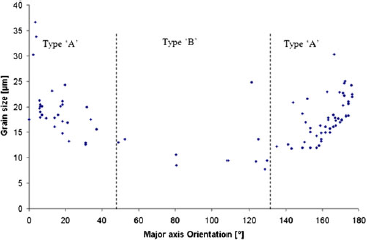
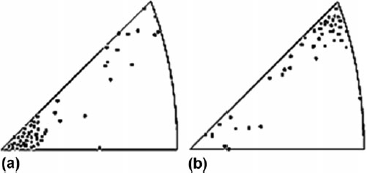
Size distribution and microtexture: Fig. 9 shows distribution of type “A” and type “B” grains in terms of the inclination angle β. Apparently, about 60% of recrystallized grains were type “A” grains and 40% were type “B” grains. Interestingly, only ∼5% of the grains were oriented within 10° of the DD, whereas about 24% were oriented within 10° of the lateral direction. In Fig. 10, the grain size distribution of recrystallized grains as a function of the inclination angle β indicates that the average grain size of type “A” grains was about 20 μm, whereas that of type “B” grains was 10 μm. The microtexture of the two types of grains is presented in Fig. 11 as discrete IPFs. Evidently, most of type “A” grains had their <100> poles aligned parallel to DD, whereas type “B” grains had mostly <111>//DD orientation.
Distribution of type “A” and type “B” grains in terms of the inclination angle, β.

Grain size distribution of type “A” and type “B” grains in terms of the inclination angle β of their major axis.

OIM discrete IPFs representing the microtexture of (a) type “A” and (b) type “B” grains.

IV. MODELING STRAIN DISTRIBUTION IN DRAWN WIRES
In the wire drawing process using a conical die, the deformation mode involves narrow regions of intense shear emanating from the edges of the die on both the entry and exit sides.Reference Chakrabarty 17 – Reference Avitzur 19 Through the thickness of each of these shear zones, the direction and magnitude of the velocity of a typical particle vary rapidly in a continuous manner. It is well known that the strain distribution in the deforming material in the die is only marginally affected by the strain-hardening characteristic of the material.Reference Chakrabarty 17 , Reference Osakada and Nimi 20 It is reasonable, therefore, to consider an ideally plastic material that does not work harden at all. In that case, the shear zones degenerate into surfaces of discontinuity across which the velocity of a particle changes discontinuously in both direction and magnitude. Only the velocity component tangential to the surface can be discontinuous since the continuity of the material requires the normal component to be continuous. For the analysis of the strain distribution in the drawn wire, it is convenient to adopt a suitable discontinuous velocity field generally used for the derivation of an upper bound estimate for the mean drawing stress.Reference Chakrabarty 17
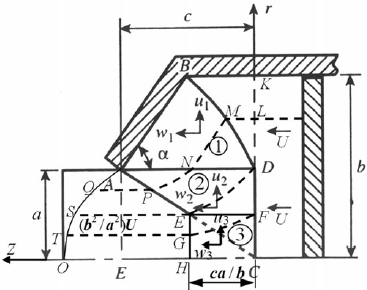
A relatively simple velocity pattern is indicated in Fig. 12, which involves velocity discontinuities not only across surfaces emanating from the extremities of the die but also across a pair of concentric cylindrical surfaces around the axis of symmetry. The assumed velocity field is actually a modification of the one used by Chakrabarty,Reference Chakrabarty 17 in which a region of constant strain rate is introduced near the axis of symmetry to avoid a velocity singularity. The material approaching the die with a uniform velocity U moves nonuniformly through the die and finally attains a uniform exit velocity equal to (b 2/a 2)U to satisfy the condition of plastic incompressibility of the material. The velocity distribution in the deforming regions follows from the velocity boundary conditions and the continuity conditions of the normal component of velocity across the interfaces of the assumed discontinuity pattern.
The geometrical parameters, deformation zones, and velocity components during wire drawing through a conical die (adapted from Ref. Reference Chakrabarty17).

The radial and axial components of the particle velocity in the three separate regions of deformation, designated by the numbers 1, 2, and 3 in Fig. 12, can be expressed in terms of the cylindrical coordinates (r, z), referred to a pair of axes through C, as follows:
 $$u_1 = - U\left( {{{b^2 - a^2 } \over {2cr}}} \right),\,w_1 = U\left( {{{b^2 - a^2 } \over {2cr}}} \right)\cot {\rm{\alpha }}\quad,$$
 $$\!\!\!\!\!\!\!\!u_2 = - U\left( {{{b^2 - a^2 } \over {2ca}}} \right),\,w_2 = U\left\{ {1 + \left( {{{b^2 - a^2 } \over {2ca}}} \right){z \over r}} \right\}\quad,$$
 $$u_3 = - U\left( {{{b^2 - a^2 } \over {2ca}}} \right){{br} \over {a^2 }},\,w_3 = U\left\{ {1 + \left( {{{b^2 - a^2 } \over {ca}}} \right){{bz} \over {a^2 }}} \right\}\,\,\,\,,$$
where a, b, and c are geometrical parameters of the die (see Fig. 12). The continuity of the normal component of velocity along boundary BD requires:
 $${{dz} \over {dr}} = {{w_1 - U} \over {u_1 }} = - \cot {\rm{\alpha }} + {{2cr} \over {b^2 - a^2 }}\quad,$$
which when integrated under the boundary condition z = 0 at r = a yields the equation of curve BD as:
 $$z = c\left( {{{r^2 - a^2 } \over {b^2 - a^2 }}} \right) - (r - a)\cot {\rm{\alpha }}\quad.$$
Using the incompressibility condition expressed by
 ${{\partial u} \over {\partial r}} + {u \over r} + {{\partial w} \over {\partial z}} = 0$
, the effective strain rate in each of the deforming zones is obtained as:
 $$\eqalignb{ & {{\dot \bar \varepsilon }}_1 = {{mU(b^2 - a^2 )} \over {\sqrt 3 cr^2 }},\,m = \sqrt {1 + {1 \over 4}\cot ^2 } {\rm{\alpha }}\quad, \cr & {{\dot \bar \varepsilon }}_2 = {{U(b^2 - a^2 )} \over {\sqrt 3 car}}\left( {1 + {{z^2 } \over {4r^2 }}} \right)^{1/2} \quad, \cr & {{\dot \bar \varepsilon }}_3 = {{U(b^2 - a^2 )b} \over {ca^3 }}\quad. } $$
The streamlines emanating from selected points located on the plane coinciding with the plane DC on the entry side are shown by broken lines in Fig. 12. After passing through the die, these points become located on a convex surface (A–Q–S–T–O). For a smooth die and substantial lubrication, the effect of friction along the die face is relatively small and can be neglected.Reference Chakrabarty 17 , Reference Richmond 21 In this case, the effective strain in an element as it moves along the die face from B to A is obtained as:
 $$({{\bar \varepsilon }})_A = {1 \over {\sqrt 3 }}\left\{ {{\rm{\alpha }} + 2m\ln \left( {{b \over a}} \right)} \right\}\quad.$$
The streamline followed by a particle initially at D(r = a) is given by the differential equation:
 $${{dz} \over {dr}} = {{w_2 } \over {u_2 }},\,{\rm or}\,{{dz} \over {dr}} + {z \over r} = - {{2ca} \over {b^2 - a^2 }}\quad,$$
which is easily integrated under the boundary condition z = 0 at r = a to give the solution:
 $${z \over r} = {{ca} \over {b^2 - a^2 }}\left( {{{a^2 } \over {r^2 }} - 1} \right)\quad.$$
Since z/r = c/a along the exit discontinuity EA, this streamline meets this discontinuity at r = a2/b, which exactly corresponds with point E. The effective strain suffered by a material element in moving from point D to E (in region 2) can be determined from the following relation:
 $${{d{{\bar \varepsilon }}_2 } \over {dr}} = {{{{\dot \bar \varepsilon }}_2 } \over {u_2 }},\,{\rm{or}}\,{{\bar \varepsilon }}_2 = {2 \over {\sqrt 3 }}\int\limits_{a^2 /b}^a {\left\{ {1 + k^2 \left( {{{a^2 } \over {r^2 }} - 1} \right)^2 } \right\}^{1/2} {{dr} \over r},} \,k = {{ca} \over {2(b^2 - a^2 )}}\quad.$$
The integration is facilitated by the substitution ξ = k[(a 2/r 2) − 1], yielding:
 $${{\bar \varepsilon }}_2 = {1 \over {\sqrt 3 }}\int\limits_0^{c/2a} {{{\sqrt {1 + {\rm{\xi }}^2 } } \over {k + {\rm{\xi }}}}d{\rm{\xi }}} = {1 \over {\sqrt 3 }}\left\{ {2\sqrt {1 + k^2 } \left( {\ln {b \over a}} \right) + \sqrt {1 + c^2 /4a^2 } - (1 + {\rm{\lambda }})} \right\}\,\,\,\,\,\,,$$
where
 $${\rm{\lambda }} = \,\sqrt {1 + k^2 } \ln \left\{ {{{1 - kc/2a + \sqrt {(1 + k^2 )(1 + c^2 /4a^2 } )} \over {1 + \sqrt {1 + k^2 } }}} \right\} + k\sinh ^{ - 1} \left( {{c \over {2a}}} \right)\quad.$$
Due to the shear strains produced at the velocity discontinuities, the resultant effective strain in the element becomes:
 $$({{\bar \varepsilon }})_S = {{\bar \varepsilon }}_2 + \tan ^{ - 1} \left| {{{dr} \over {dz}}} \right|_D + \tan ^{ - 1} \left| {{{dr} \over {dz}}} \right|_E = {{\bar \varepsilon }}_2 + {1 \over {\sqrt 3 }}\tan ^{ - 1} \left( {{{b^2 - a^2 } \over {2ca}}} \right) + {1 \over {\sqrt 3 }}\tan ^{ - 1} \left[ {{a \over c}\left( {{{b^2 - a^2 } \over {b^2 + a^2 }}} \right)} \right]\quad.$$
Consider the streamline traced by the particle initially at point L, located at r =
 $\sqrt {ab} $
. The streamline follows the line MN (in region 1), parallel to the die face, to meet AD at N. The distance ND is:
 $${\rm{ND}} = c\left( {{a \over {b + a}}} \right)\quad.$$
The subsequent part NP (in region 2) of this streamline is furnished by the solution of the differential Eq. (6), which is integrated under the boundary condition z = ND at r = a to give the solution:
 $${z \over r} = \left( {{c \over {b + a}}} \right){{a^2 } \over {r^2 }} + {{ca} \over {b^2 - a^2 }}\left( {{{a^2 } \over {r^2 }} - 1} \right)\quad.$$
Following the analysis of Eqs. (8) and (9), the resultant effective strain in the element, including the redundant shear, is given by
 $$({{\bar \varepsilon }})_Q = {{\bar \varepsilon }}_1 + {1 \over {\sqrt 3 }}\left\{ {{\rm{\alpha }} + \tan ^{ - 1} \left| {{{dr} \over {dz}}} \right|_Q } \right\} = {{\bar \varepsilon }}_1 + {1 \over {\sqrt 3 }}\left\{ {{\rm{\alpha }} + \tan ^{ - 1} \left[ {{a \over c}\left( {{{b^2 - a^2 } \over {b^2 + a^2 }}} \right)} \right]} \right\}\quad,$$
where
 $$\eqalign{ {{\bar \varepsilon }}_1 & = {1 \over {\sqrt 3 }}\left\{ {\left( {1 + \sqrt {1 + k^2 } } \right)\ln {b \over a} + \sqrt {1 + u^2 c^2 /4a^2 } - (1 + {\rm{\lambda \prime}})} \right\}\quad, \cr u & = {a \over {(a + b)}},\,k = {{ca} \over {2(b^2 - a^2 )}}\quad, \cr} $$
and λ′ is given by the right-hand side of Eq. (10) with c replaced byuc.
Considering region 3, the streamline passing through point F is given by the differential equation:
 $${{dz} \over {dr}} = {{w_3 } \over {u_3 }},\,{\rm{or}}\,{{dz} \over {dr}} + {{2z} \over r} = - {{2ca} \over {b^2 - a^2 }}{{a^2 } \over {br}}\quad,$$
which when integrated under the boundary condition z = 0 at r = a/b 2 yields:
 $$z = {{ca} \over b}\left( {{{a^2 } \over {b^2 - a^2 }}} \right)\left( {{{a^4 } \over {b^2 r^2 }} - 1} \right)\quad.$$
A particle initially at F will reach the exit discontinuity EH at a point G, corresponding to r = a 3/b 2. The effective strain in an element, as it moves from F to G, is given by:
 $${{d{{\bar \varepsilon }}_3 } \over {dr}} = {{{{\dot \bar \varepsilon }}_3 } \over {u_3 }},\,{\rm{or}}\,{{\bar \varepsilon }}_3 = 2\int\limits_{a^3 /b^2 }^{a^2 /b} {{{dr} \over r} = 2\ln \left( {{b \over a}} \right)}\quad .$$
Following the same procedure as before, the resultant effective strain in the element, including the shear strains at the discontinuities, becomes:
 $$({{\bar \varepsilon }})_T = \,2\ln \left( {{b \over a}} \right) + {1 \over {\sqrt 3 }}\tan ^{ - 1} \left( {{{b^2 - a^2 } \over {2ca}}} \right) + {1 \over {\sqrt 3 }}\tan ^{ - 1} \left[ {{{a^2 } \over {b^2 }}\left( {{{b^2 - a^2 } \over {2cb}}} \right)} \right]\quad.$$
Finally, the particle initially coinciding with C moves along the axis with a speed that varies linearly from z = 0 to z = ca/b, the average speed being (U/2)·(b 2 + a 2)/(b 2 − a 2). Since the particle moving along the axis suffers no redundant shear, the total effective strain in the corresponding element is:
 $$({{\bar \varepsilon }})_4 = {{\bar \varepsilon }}_3 = 2\ln (b/a)\quad.$$
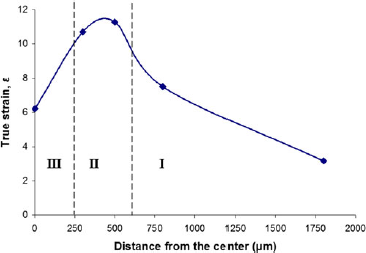
The distribution of the total effective strain for a wire drawn to a nominal strain of 3.1 (for comparison with the intermediate-strained wire) is shown in Fig. 13. It is evident that the maximum value of the total effective strain occurs at the midsection, and the inner core suffers the least amount of strain.
Strain distribution across the intermediate-strained wire based on the upper bound plasticity simulation. The demarcation of the three regions is based on the results of Fig. 1.

V. DISCUSSION
A. As-deformed wires
The results of this work have confirmed that rather than two regions, as was earlier reported,Reference Schamp, Verlinden and Van Humbeeck 5 wire drawing develops three distinct concentric regions across the wire: the inner core, the midsection, and the outer region. Both the nanohardness measurement and the upper bound simulation results have verified that the midsection is the most strained region. A high strain or nanohardness value signifies a high dislocation density, which is a qualitative measure of the amount of stored strain energy. In other words, wire drawing creates a gradient in the stored strain energy across the wire, with the highest value at the midsection. These results are consistent with the work of Cho et al.Reference Cho, Rollett, Cho, Park, Park and Oh 22 who used finite element modeling to simulate wire drawing and showed that the midsection undergoes maximum shear strain, whereas the inner core (center) shows almost zero shear strain. Schamp et al.Reference Schamp, Verlinden and Van Humbeeck 5 and Park and LeeReference Park and Lee 6 have also reported a similar heterogeneity across the transverse section of drawn wires.
Apart from the strain gradient, local texture measurement by the OIM technique has also revealed an associated gradient in the microtexture across the wire. Figure 3 shows a strong <111> + weak <100> duplex fiber texture at the inner core and a progressively weaker texture from the inner to the outer surface. Comparative results have been earlier reported by Park and LeeReference Park and Lee 6 in electrolytic copper rod drawn to 90% in area reduction. They observed a strong <111> + weak <100> duplex fiber texture in the inner core, which is homogeneously deformed, whereas the midsection and the outer region, which are shear deformed, developed weak <111>–<112> and <100> components, respectively. In general, global texture of axisymmetrically deformed FCC materials is characterized by the formation of a strong <111> + weak <100> duplex fiber texture.Reference McHargue, Jetter and Ogle 7 However, it has been observed that this occurs if the deformation is homogeneousReference Dillamore and Roberts 8 , Reference Shin, Jeong and Lee 9 ; shear deformation develops a weak circular texture.Reference Park and Lee 6 , Reference Rollett, Wright, Kocks, Tomé, Wenk and Mecking 10
B. Annealed wires
The annealing behavior of drawn OFHC copper wires depended not only on the degree of deformation but also was significantly influenced by the microstructural inhomogeneity across the transverse section of the wire. Although recrystallization is a complex process, it is well accepted thatReference Humphreys and Hatherly 23 :
-
(i) Recrystallization is an irreversible, thermally activated, solid-state reaction, which occurs by nucleation and growth of recrystallized grains, through the migration of HAGBs.
-
(ii) The driving force for recrystallization is the stored strain energy due to deformation.
-
(iii) Recrystallization nuclei occur in an extremely heterogeneous manner and often predominantly at deformation heterogeneities such as transition bands, shear bands, texture bands, grain boundaries, and triple junctions. These heterogeneities are essential because they possess local variations in dislocation densities and are often bounded by HAGBs.
-
(iv) Recrystallization occurs first in highly strained/disordered structures with high local gradients in dislocation densities and HAGBs. These areas constitute “potential sites” or “embryos” for triggering recrystallization.
-
(v) Growth of recrystallized regions by migration of HAGBs continues until mutual impingement of recrystallized grains—the end of primary recrystallization.
It is apparent then that the stored strain energy in the low-strained wire was insufficient to trigger recrystallization at this low (170 °C) annealing temperature. This is equally true for the inner and outer regions of the annealed intermediate-strained wire. On the other hand, the midsection of the intermediate-strained wire had enough driving force to cause pockets of recrystallized grains but barely sufficient to produce full recrystallization as shown in Fig. 5(b). The fact that these pockets of recrystallized grains were not homogeneously distributed across the midsection of the annealed intermediate-strained wire is strong evidence for the heterogeneous nature of the deformed structure. That is, the strain gradient existed not only across the three regions but also within the same region. Hence, “potential nuclei” were also unevenly distributed.
It is interesting to note that during the initial stages of recrystallization in the annealed intermediate-strained wire, the microtexture of the recrystallizing grains at the midsection was random. Such a randomization of texture has been attributed to shear deformation, which promotes annealing twins,Reference Field, Eames and Lillo 24 , Reference Baudin, Etter and Penelle 25 a phenomenon common in FCC metals with low stacking fault energies such as copper. There is also evidence that nucleation at shear bandsReference Ridha and Hutchinson 26 , Reference Engler 27 leads to a randomization of the recrystallization texture. Apparently, in wire drawing, the midsection and the outer region are regions that undergo shear deformation in addition to axisymmetric plastic extension.Reference Park and Lee 6
The heterogeneous behavior of recrystallization in the annealed wires was mostly revealed in the annealed highly strained wire [Fig. 5(c)]. This wire showed partial recrystallization at the mid and outer regions and pockets of recrystallized grains at the inner core. Evidently, the additional strain provided enough driving force for recrystallization at the mid and outer regions but was inadequate for the lesser-strained inner core. As a result, recrystallization emanated from the highly strained midsection and proceeded to the outer region before commencing at the inner region. In a study of recrystallization of electrolytic tough pitch copper wires at ambient temperature, Schamp et al.Reference Schamp, Verlinden and Van Humbeeck 5 observed a similar trend in which recrystallization started in a cylindrical zone, at about ⅓ of the radius away from the surface, proceeds at the surface, and finally ends in the core material. In a similar investigation of the evolution of annealing textures in 90% drawn electrolytic copper wire, Park and LeeReference Park and Lee 28 noted that the recrystallization rate was highest in the midsection and lowest in the center region.
The microtexture of the partially recrystallized highly strained wire showed a reversal in the texture between the inner core and the mid/outer regions. While the unrecrystallized inner core is a deformed structure with its strong <111> + weak <100> duplex fiber texture, the recrystallized midsection and outer region exhibited a strong <100> + weak <111> duplex fiber texture. The midsection, which showed more extensive recrystallization than the outer region, had a higher fraction of the <100> component than the outer region. This is in agreement with the general observation in most FCC axisymmetric deformed metals where the strong <111> + weak <100> deformation texture changes to strong <100> + weak <111> during recrystallization.Reference Park and Lee 28 , Reference Noda, Grewen and Wassermann 29
Another notable feature of the partially recrystallized highly strained wire is the bimodal distribution of laterally growing “type A” and axially growing “type B” recrystallized grains. Type A grains were mostly oriented at <100>//DD and were larger and of higher frequency than type B grains, which generally had a <111>//DD orientation. In a separate study of these two types of grains,Reference Waryoba, Kalu and Rollett 16 the large size of type A grains was attributed to the high frequency of the mobile boundaries with misorientations in the 40–50° range, and boundaries that were misoriented at 60°<111> (twin boundaries, Σ3) were found to exert the greatest pinning (retarding) effect on the growing grains. This caused recrystallized grains to grow either laterally or axially and sometimes led to “branching.”
VI. CONCLUSION
This work has cataloged the effect of deformation heterogeneity on the recrystallization behavior of drawn and annealed OFHC Cu wires. Although the microstructures of the three as-drawn wires appear similar, consisting of elongated grains aligned parallel to DD, their annealing behavior depended on the deformation strain and was influenced by the deformation heterogeneity, which formed three distinct concentric regimes across the wires: the inner core, the midsection, and the outer region. The midsection had a relatively higher hardness than the inner core and outer regions. While the microtexture of the inner core was dominated by a strong <111> + weak <100> duplex fiber texture, the midsection and the outer region had a comparatively weaker texture. Upon annealing, the low-strained wire did not recrystallize, whereas the intermediate-strained wire showed pockets of recrystallized grains with random orientations. On the other hand, the highly strained wire exhibited partial recrystallization. Recrystallization started at the midsection and proceeded toward the outer region. The inner core was unrecrystallized with a strong <111> + weak <100> fiber texture, whereas the mid and outer regions recrystallized with a strong <100> + weak <111> fiber texture. The recrystallized grains consisted of type “A” grains, which mostly grew laterally with <100>//DD orientation, and type “B” grains, which generally grew axially with <111>//DD orientation. Type “A” grains were larger and of higher frequency than type “B” grains.
ACKNOWLEDGMENTS
The financial supports given by the National Science Foundation (NSF) through the PREM program, Grant No. DMR 0351770, the Department of Energy (DOE) Grant No. DE-FG02-04ER8390, and that of the DuBois Educational Foundation (Academic Excellence grant) through Director of Academic Affairs (DAA), are gratefully acknowledged. Regrettably, J.C. passed before the publication of this manuscript.