Introduction
Echinococcosis, also known as hydatid disease, is a globally distributed zoonotic parasitic infection caused by the larval stages of Echinococcus species (Mandal and Mandal Reference Mandal and Mandal2012). Transmission occurs through the fecal-oral route, with definitive hosts such as dogs, wolves, and foxes shedding parasite eggs that infect intermediate hosts, including humans. The two primary clinical forms of the disease are cystic echinococcosis (CE) caused by E. granulosus and alveolar echinococcosis (AE) caused by E. multilocularis (Zhang et al. Reference Zhang, Lu, Ji, Zhao and Li2015), which primarily utilize livestock and wild small mammals as their main intermediate hosts, respectively(Deplazes et al. Reference Deplazes, Rinaldi, Alvarez Rojas, Torgerson, Harandi, Romig, Antolova, Schurer, Lahmar, Cringoli, Magambo, Thompson and Jenkins2017; Lundström-Stadelmann et al. Reference Lundström-Stadelmann, Rostami, Frey, Torgerson, Riahi, Bagheri, Kaethner, Lachenmayer, Beldi, Gasser and Hemphill2025). The latest estimate for the global burden of CE is 188,000 new cases annually, compared to a markedly lower median of 10,489 cases for AE(Deplazes et al. Reference Deplazes, Rinaldi, Alvarez Rojas, Torgerson, Harandi, Romig, Antolova, Schurer, Lahmar, Cringoli, Magambo, Thompson and Jenkins2017; Lundström-Stadelmann et al. Reference Lundström-Stadelmann, Rostami, Frey, Torgerson, Riahi, Bagheri, Kaethner, Lachenmayer, Beldi, Gasser and Hemphill2025). In regions with limited medical resources, CE has a mortality rate of 2–4%, in contrast to AE, which has an untreated 10-year mortality rate of up to 94%(Gao Reference Gao2013; Talafuhan et al. Reference Talafuhan, Tuoheti, Lixia, Shuang, Yeerjiang, Aizezi, Jingjing and Mijiti2024). The combined global disease burden of CE and AE was estimated at 871,396 disability-adjusted life years (DALYs) in 2015 (Torgerson et al. Reference Torgerson, Devleesschauwer, Praet, Speybroeck, Willingham, Kasuga, Rokni, Zhou, Fèvre, Sripa, Gargouri, Fürst, Budke, Carabin, Kirk, Angulo, Havelaar and de Silva2015).
From 2004 to 2012, China reported 28,364 echinococcosis cases nationwide, with six provinces – Sichuan, Gansu, Xinjiang, Ningxia, Qinghai, and Inner Mongolia – accounting for 98.1% of all cases(Yan et al. Reference Yan, Hu and Lei2015). More notably, China bears a disproportionate share of the global AE burden, accounting for more than 90% of reported AE cases worldwide. In fact, research has demonstrated that active surveillance using mass ultrasound screening uncovers a much larger number of echinococcosis cases(Fasihi Harandi et al. Reference Fasihi Harandi, Budke and Rostami2012; Torgerson et al. Reference Torgerson, Devleesschauwer, Praet, Speybroeck, Willingham, Kasuga, Rokni, Zhou, Fèvre, Sripa, Gargouri, Fürst, Budke, Carabin, Kirk, Angulo, Havelaar and de Silva2015). Consequently, the true incidence and disease burden of echinococcosis in China may be higher than officially reported cases, presenting a severe public health challenge that must be confronted.
Echinococcosis poses severe physical and psychological challenges to affected individuals and families, while also contributing to poverty due to healthcare costs and productivity losses in endemic regions (Yan et al. Reference Yan, Hu and Lei2015). Despite its substantial health and socioeconomic impact, research on echinococcosis in China remains limited in scope. Most studies have focused on high-incidence regions such as Xinjiang and Xizang, with few addressing their broader spatiotemporal patterns across the country.
This study aimed to investigate the national-level epidemiology and spatial dynamics of echinococcosis in China between 2016 and 2020. Using spatial autocorrelation, hotspot analysis, and gravity centre shift model, we sought to characterize disease distribution trends and provide evidence-based insights to inform future surveillance and control strategies.
Data and methods
Data sources
Echinococcosis incidence data for this study were obtained from the Chinese Open Access Notifiable Infectious Disease Reporting system, accessible via the Chinese Public Health Science Data Center. Specifically, the dataset includes reported cases from 31 provincial-level administrative divisions in mainland (excluding Hong Kong SAR, Macao SAR, and Taiwan province) spanning the period from 2006 to 2020. Incidence rate, defined as the number of cases per 100,000 population, was used as the primary analytical indicator. The base map used for spatial analysis was an electronic map of China (review NO. GS (2024) 0650), sourced from the National Basic Geographic Information Database. All data utilized in this study are publicly available and do not involve human subjects, thus exempting the study from ethical review requirements.
Analytical methods
Spatial autocorrelation
Spatial autocorrelation is a statistical technique used to evaluate the spatial distribution pattern of variables by examining the similarity of spatial location and attributes. It helps detect spatial clustering and anomalies, typically through two main components: global autocorrelation and local autocorrelation (Liu et al. Reference Liu, Huang, Chang and Wang2020). Among widely used indices, Moran’s I identifies four spatial clustering patterns: High-High (H-H), denoting areas of high incidence surrounded by other high-incidence areas (hot spots); Low-Low (L-L), indicating low incidence among neighbouring low-incidence areas (cold spots); High-Low (H-L), a high-incidence area surrounded by low-incidence ones; and Low-High (L-H), a low-incidence area surrounded by high-incidence ones. When the value deviates from random distribution expectations under significance testing, it indicates the presence of significant spatial clustering (Moran’s I > 0) or dispersion (Moran’s I < 0). The precise formula for Moran’s I is as follows (Huo et al. Reference Huo, Zhang, Sun, Li, Zhou and Li2011):
 $$ I=\frac{n}{\sum_{i=1}^n{\sum}_{j=1}^n{w}_{ij}}.\frac{\sum_{i=1}^n{\sum}_{j=1}^n{w}_{ij}\left({x}_i-\overline{x}\right)\left({x}_j-\overline{x}\right)}{\sum_{i=1}^n{\left({x}_i-\overline{x}\right)}^2}\hskip1.32em \left(i\ne j\right) $$
where n is the total number of provinces (or autonomous regions), w
ij represents the spatial adjacency relationship between units, and
 $ \overline{x} $
is the mean value of all attribute values.
Hotspot analysis
Hotspot analysis is a spatial statistical method used to detect areas where high or low values of geographic data are significantly clustered, commonly referred to as ‘hotspots’ or ‘cold spots’. One widely used approach is the Getis-Ord Gi* statistic, which reveals spatial clustering patterns and supports the interpretation of spatial distribution characteristics or phenomena such as echinococcosis. The Gi statistic is calculated using the following formula (2), and the Z(Gi) statistic is used to test whether it has statistical significance (Yu et al. Reference Yu, Fan, Wang, Bao, Wang, Hua and Hao2019).
 $$ {G}_i(d)=\frac{\sum_i{w}_{ij}(d){x}_i}{\sum_i{x}_j}\left(i\ne j\right)\hskip0.84em Z\left({G}_i\right)=\frac{G_i-E\left({G}_i\right)}{\sqrt{VAR\left({G}_i\right)}} $$
where xi and xj represent the observed values of spatial locations i and j for a specific indicator, and wij represents the degree of association between spatial locations i and j within a distance range d. The spatial weight coefficient wij is set to 1 if regions i and j are adjacent, and 0 otherwise.
Standard deviation ellipse
The Standard Deviation Ellipse (SDE) is a spatial analysis tool used to virtually represent the distribution characteristics and directional trends of point features. The major axis indicates the primary direction of spatial distribution, while the minor axis reflects the degree of dispersion perpendicular to that direction. A greater display between the lengths of the major and minor axes suggests strong directional concentration. In contrast, a longer minor axis indicates a higher degree of spatial dispersion across the areas (Li and Peng Reference Li and Peng2024).
Gravity centre shift model
The gravity centre shift model can be used to analyze the characteristics and patterns of changes in the centroid of a certain attribute, facilitating an understanding of the geographic distribution characteristics of that attribute (Xu and Lu Reference Xu and Lu2024). The standard deviation ellipse is commonly used in geography and epidemiology to analyze the spatial distribution characteristics of phenomena such as disease or crime. This method calculates the central position and range of data points to draw an ellipse representing their central tendency and degree of dispersion.
Trend surface analysis
Trend surface analysis is a statistical approach based on multivariate regression theory. This method decomposes spatial distribution data at the overall level into trend components and residual components, reflecting systematic spatial variation characteristics of the region. By constructing a binary polynomial regression model, it can filter out interference from random factors and local variations, thereby revealing the overall pattern of disease distribution within the study area and indirectly reflecting spatial variations at the local scale (Zhang et al. Reference Zhang, Bai, You, Wu, Feng and Zhu2009).
Statistical analysis
Spatial autocorrelation was employed to assess the spatial clustering patterns of echinococcosis, while hotspot analysis was used to identify its high- and low-risk areas. The Standard Deviation Ellipse, in combination with the gravity centre shift model, was applied to reveal spatial distribution patterns and dynamic evolution of the disease. Additionally, trend surface analysis further captured both broad spatial trends and localized variations. All spatial data processing was conducted using ArcGIS 10.7 and GraphPad (version 9.0), and all statistical analyses were performed with SPSS (version 26.0).
Results and discussion
Age and time distribution
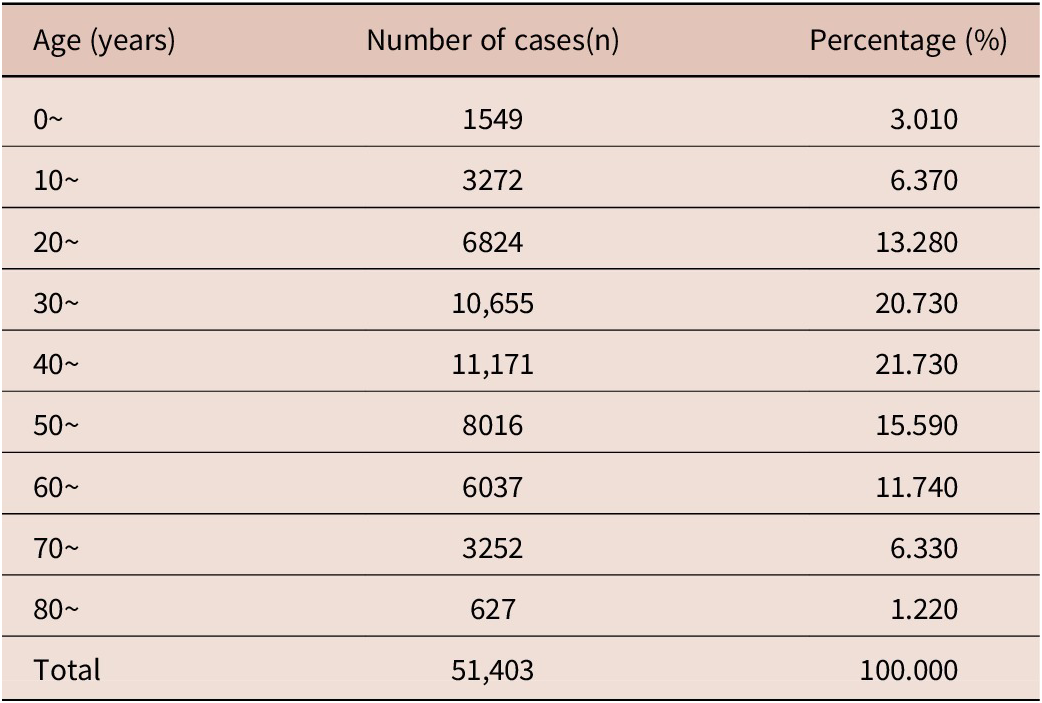
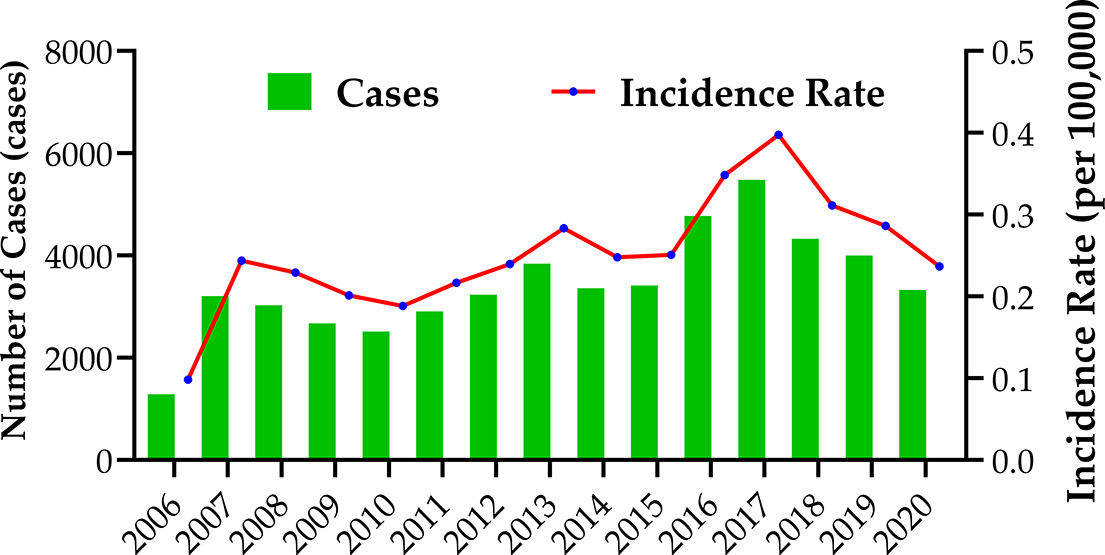
From 2006 to 2020, a total of 51,403 cases of echinococcosis were reported nationwide, with an average annual incidence rate of 0.252 per 100,000 population. The age range affected by echinococcosis is wide, but the majority of cases (71.33%) occurred among individuals aged between 20 and 60 years. Within this group, those aged 30–60 accounted for 58.05% of all reported cases, indicating that young and middle-aged adults are particularly susceptible (Table 1). In contrast, relatively fewer cases were reported in children and the elderly. From the time distribution characteristics (Figure 1), the reported incidence rate shows significant stage-specific fluctuations: prior to 2017, both the incidence rate and the total number of cases showed a fluctuating upward trend, and then a downward trend. Epidemiologic analysis shows that the number of cases and the incidence rate curve show a significant positive correlation (r = 0.98, P <0.01), with marked synchronous characteristics. January, March, and December had slightly higher case numbers than other months (Figure S1).
Age distribution of echinococcosis in China from 2006 to 2020

The number of echinococcosis cases and incidence rates in China from 2006 to 2020.

This nationwide spatiotemporal analysis revealed persistent clusters of echinococcosis cases in western and northwestern China, with a geographic epicentre consistently located in Qinghai province. Although both incidence and total case numbers declined from 2017 to 2020, the disease burden remains considerable. Moreover, the spatial distribution pattern has shown a gradual southward shift, emphasizing the need for enhanced surveillance and regionally adapted prevention strategies.
Wang et al. reported a significantly higher prevalence of alveolar echinococcosis among individuals aged ≥30 years (6.41, 95% CI: 3.50–10.12%) compared to those under 30 (1.64, 95% CI: 0.36–3.83%) (Wang et al. Reference Wang, Dai, Li, Jia, Guo and Lu2020). Consistently, an epidemiological survey in Xizang showed that individuals aged 30–59 accounted for 55% of both male and female echinococcosis cases (Li et al. Reference Li, Quzhen, Xue, Han, Chen, Yan, Li, Quick, Huang, Xiao, Wang, Wang, Zuoga, Zheng, Wu and Zhou2019). These findings align with the results of our study, where individuals aged 30–60 comprised 58.05% of the total reported cases. This age-related trend may be attributed to increased occupational exposure among adults engaged in livestock-related activities such as herding or slaughtering, which elevates the risk of infection. Furthermore, the long incubation period of AE (5–15 years) and CE (10–14 years) may delay clinical manifestation, contributing to higher detection rates among those aged ≥30 years (Kern et al. Reference Kern, Menezes da Silva, Akhan, Müllhaupt, Vizcaychipi, Budke and Vuitton2017; Wang et al. Reference Wang, Zhu, Cai, Liu, Xie, Jiang, Zhang, Xie, Guan, Bergquist, Wang, Li and Wu2021). Temporally, a fluctuating upward trend was observed in both the incidence rate and reported Echinococcus cases prior to 2017, likely due to enhancements in healthcare and surveillance during a period of rapid national development(Han and Li Reference Han and Li2025). Between 2017 and 2020, a national decline in Echinococcus incidence was observed, likely due to the combined effects of disease dynamics and China’s robust public health interventions. These efforts have yielded substantial progress in disease control. Nonetheless, the overall number of existing cases in endemic regions has remained high over the past three years. Compounding the risk is an increased infection rate among wild canids, while livestock infection rates have remained relatively stable – factors that raise concern for a potential resurgence (Han and Li Reference Han and Li2025). Our findings also indicate no significant seasonal variation in case numbers, which is consistent with previous observations by Sun and Liu (Shun and Liu Reference Shun and Liu2018). This pattern may reflect the stable nature of the parasite’s transmission cycle (i.e. eggs to intermediate host to human), coupled with its extended latency period and high environmental resilience.
Regional distribution and spatial analysis of incidence rates for echinococcosis
Spatial and local autocorrelation analysis
The high-incidence areas for echinococcosis are mainly concentrated in western and northwestern China, with Xinjiang, Qinghai, Sichuan, Gansu, Ningxia, Xizang, and Inner Mongolia accounting for 70.00% of the total reported cases nationwide during 2006–2020 (Figure 2). The results of the global spatial autocorrelation analysis indicate that, from 2006 to 2020, the Moran’s I values for the incidence of echinococcosis nationwide were statistically significant (P <0.05) in all years except 2006 and 2009 (Table 2). These findings indicate a strong positive spatial autocorrelation throughout the study period, suggesting consistent spatial clustering of the disease in most years. The local spatial autocorrelation analysis of echinococcosis (Figure 3) shows that Gansu and Ningxia exhibited L-H outliers in 2006 and 2020, while Xizang also exhibited L-H outliers in 2006 and 2008. From 2008 to 2018, Gansu and Ningxia consistently showed H-H clusters, and Xizang maintained H-H cluster characteristics from 2010 to 2020. Qinghai showed H-H clusters in 2016 and 2018. From 2006 to 2020, there were stable L-L clusters in the central and eastern regions. These changes may reflect the dynamic evolution of spatial association patterns of echinococcosis across different regions over time.
(A) Cumulative number of echinococcosis cases and (B) regional distribution of cumulative incidence rate for echinococcosis, 2006–2020.

Global spatial autocorrelation analysis of echinococcosis incidence rates in China from 2006 to 2020

Local spatial autocorrelation of echinococcosis in China from 2006 to 2020.

The local spatial autocorrelation analysis revealed that Xizang, Gansu, and Ningxia consistently exhibited an ‘H-H’ clustering pattern of echinococcosis throughout the study period. These findings align with previous analyses, including the study by Zhao (Zhao et al. Reference Zhao, Zhang, Zhao, Zhang, Ciren, Li, Liu and Long2023), which reported similar patterns in Xizang from 2010 to 2018. This persistent clustering may be attributed to the expansive geographic areas of these provinces, limited healthcare infrastructure, and lower public awareness of disease prevention. Additionally, the predominantly pastoral lifestyle in these regions – characterized by frequent contact with livestock – heightens the risk of echinococcosis transmission.
Getis-Ord Gi* analysis
The Getis-Ord Gi* statistical analysis reveals that the Qinghai region has consistently been a hotspot for echinococcosis (99% confidence interval, P <0.05) from 2006 to 2020. This finding indicates that Qinghai is a high-risk area with concentrated disease incidence. From 2006 to 2020, the majority of identified hotspot regions were located in western and northwestern China, particularly in the provinces of Qinghai, Xinjiang, Xizang, Gansu, and Ningxia. The extent of these hotspots expanded notably in 2008 and 2010 but remained relatively stable between 2012 and 2016. By 2018 and 2020, the scope of hotspot regions had decreased. The cold spots were mainly located in central and eastern China, especially in provinces such as Jiangxi, Hunan, Hubei, Anhui, and Jiangsu. The number of cold spots increased significantly in 2012, but decreased significantly by 2020, with only the Hubei region maintaining cold spot status (Figure 4).
Distribution of cold and hot spots for echinococcosis incidence in China, 2006–2020.

Hotspot analysis further confirmed that high-incidence zones are concentrated in western China, particularly in Xinjiang, Xizang, and Qinghai. The absence of a significant hotspot in Sichuan, a known high-risk province, is likely due to its sharp internal east-west divergence. The high incidence in the sparsely populated western prefectures (e.g. Garze and Ngawa) may be diluted when aggregated at the provincial level with the massive population and low incidence of the eastern basin, potentially preventing the detection of a statistically significant cluster. Consequently, the overall burden of echinococcosis in Sichuan remains substantial and must not be underestimated. Future studies employing granular, sub-provincial data are warranted to delineate the high-risk clusters within these specific prefectures. The elevated prevalence in western regions likely results from a confluence of environmental, behavioural, and systemic factors. From a geographical and climatic perspective, high-altitude areas in China experience colder temperatures, which enhance the environmental stability and viability of Echinococcus multilocularis eggs, thereby facilitating the transmission of AE (Sioutis et al. Reference Sioutis, Reppas, Bekos, Soulioti, Saranteas, Koulalis, Sapkas and Mavrogenis2021). In contrast, the transmission of CE is closely linked to traditional nomadic pastoralism, where the persistence of these herding practices – with sheep and goats serving as key intermediate hosts – further amplifies the disease risk (Fayisa et al. Reference Fayisa, Sarba, Borena, Gebremedhin and Tola2024; Grosso et al. Reference Grosso, Gruttadauria, Biondi, Marventano and Mistretta2012). In terms of health behaviours and sanitation, a study found that awareness of echinococcosis transmission routes was limited among farmers and herders in Xinjiang, Qinghai, Gansu, Sichuan, and Xizang. Only 30.8% understood how the disease is transmitted, while just 28.2% and 29.5% recognized the risks associated with not washing hands before meals or drinking untreated water, respectively (Liu et al. Reference Liu, Wu, Zhang, Wang, Kang, Huang, Xu, Gao and Shun2021). Additionally, Wang et al. (Reference Wang, Qiu, Yang, Schantz, Raoul, Craig, Giraudoux and Vuitton2006) identified several risk factors, including the number of household dogs, contact with fox fur, inadequate food hygiene, consumption of untreated river water, and close contact with canines. Healthcare resource limitations further compound the issue. Many rural communities in western China lack sufficient medical personnel and diagnostic facilities, leading to delayed detection and treatment. These challenges –combined with traditional lifestyle practices, limited health education, poor sanitation, and underdeveloped health infrastructure – contribute to the persistently high incidence of echinococcosis in these areas.
Standard deviation ellipse and shift of disease centre and trend surface analysis
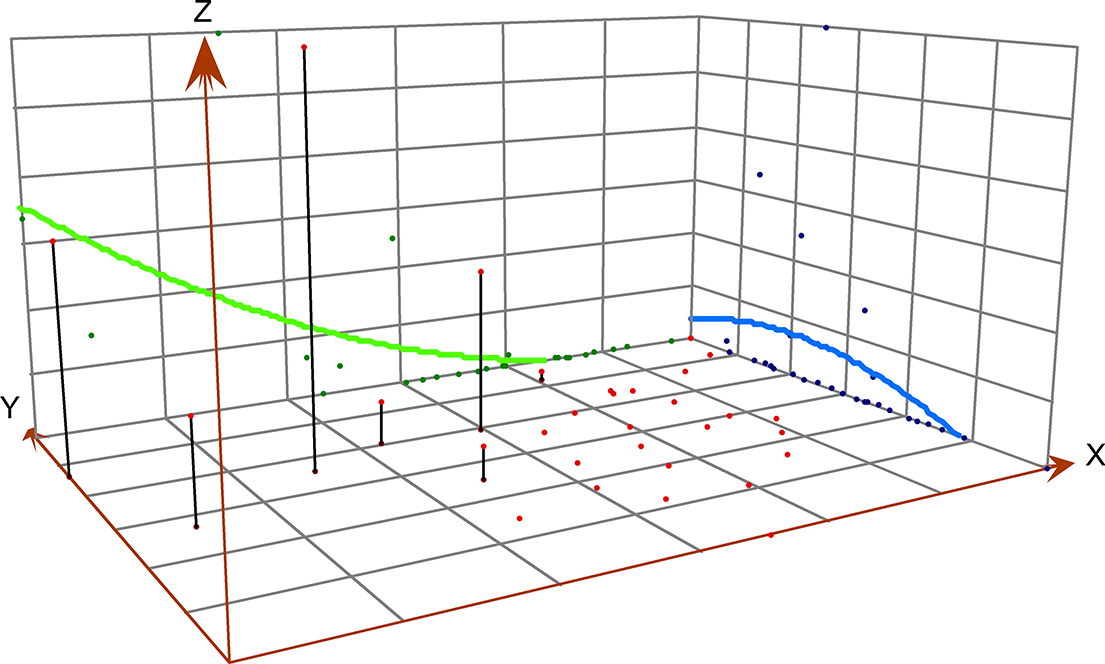
The centre point of the ellipse represents the geographic centroid of Echinococcus case distribution. The national average centre (geometric centroid) is consistently located within Qinghai Province (Figure 5). The different coloured ellipses in the figure represent the distribution of Echinococcus cases for different years from 2006 to 2020. Over the past four years, compared to the preceding four-year period, there has been a decrease in the difference between major and minor axes (reduction in eccentricity) and also a reduction in the area of the ellipse. This indicates that the directionality of Echinococcus case distribution is becoming less pronounced and more concentrated. However, the ellipses show signs of southward migration; that is, the disease’s centroid has been shifting towards the southeast in recent years, suggesting a trend of moving southwards. The trend surface analysis results from 2006 to 2020 reveal a distinct spatial pattern in the national incidence of echinococcosis, characterized by lower prevalence in the southeast and higher prevalence in the northwest (Figure 6). Along the east-west axis, incidence rates are notably higher in western regions compared to eastern ones. Regarding the north-south areas, the central regions exhibit higher prevalence, while both northern and southern regions show lower rates, with the northern areas slightly exceeding the southern side in incidence. These results underscore that high-incidence areas for echinococcosis remain predominantly concentrated in western and northwestern China.
Shift in the centre of gravity of echinococcosis in China from 2006 to 2020.

China’s cumulative incidence rate of echinococcosis trend surface (2006–2020).

Analysis using the Standard Deviation Ellipse method showed that the spatial extent of echinococcosis cases has contracted in recent years, accompanied by a discernible southward migration trend. Trajectory mapping of the epidemic centre revealed that from 2006 to 2020, the geographic centroid remained within Qinghai province. Trend surface analysis indicated lower values in the northern and southern regions, with a central band of higher intensity. This spatial shift may reflect the success of targeted intervention strategies in Xinjiang, including systematic registration and deworming of domestic dogs and vaccination of newborn lambs (Zhang et al. Reference Zhang, Zhang, Maiwulan, Yang and Yang2025). It may also reflect limited surveillance in regions like Qinghai and Xizang, potentially underrepresenting fluctuations in incidence. For instance, a study in Dulan County, Qinghai Province, reported a persistently high sheep infection rate of 1.89% during the period of 2018 and 2020 (Gabu Reference Gabu2021). In contrast, the infection rate in domestic dogs in Xizang declined from 7.3% in 2016 to under 2.35% in 2020, accompanied by a notable decrease in both stray dog populations and Echinococcus positivity rates among domestic dogs between 2017 and 2019 (Wang et al. Reference Wang, Gongsang, Pang, Qin, Wang, Li, Frutos and Gavotte2022). These findings suggest that while source control measures have been effective in some areas – particularly targeting the dog population in Xizang – the broader regional burden remains substantial, with livestock infection rates still relatively high.
Current strategies and future directions for echinococcosis control in China
To mitigate the southward spread of echinococcosis and reduce incidence rates in high-prevalence regions of China, it is imperative to increase the frequency and coverage of echinococcosis screening, expand the scope of preventive interventions, implement evidence-based control strategies, and enhance public education and awareness. These efforts aim to improve community understanding of the disease, promote behavioural change, and address poor hygiene and sanitary practices that facilitate transmission (Gu et al. Reference Gu, Hu, Guo, Jin, Chen, Huang, Hu, Li and Liu2024). The development of effective vaccines targeting livestock could substantially reduce infection rates in intermediate hosts, further disrupting the parasite’s life cycle. Additionally, full implementation of the updated 2019 policy is critical, including key components such as expanding control measures for stray and wild dog populations, optimizing deworming protocols, improving screening technologies to align with evolving epidemiological patterns, and strengthening surveillance of echinococcosis in both wildlife and human populations (Gu et al. Reference Gu, Hu, Guo, Jin, Chen, Huang, Hu, Li and Liu2024). The continued geographic clustering and expansion of high-risk areas underscore the urgency for regionally tailored policies. These may include community-based interventions, mobile veterinary services in remote pastoral zones, and sustained public education campaigns. A coordinated One Health approach – integrating animal, environmental, and human health sectors – is essential for long-term control and eventual elimination of echinococcosis.
The limitation of this study relied on echinococcosis case data sourced from the Public Health Scientific Data Center, with the most recent dataset extending only through 2020. Given the prolonged incubation period of echinococcosis (ranging from several months to over a decade), the temporal distribution of reported cases may not accurately reflect the actual time of infection, potentially limiting the ability to assess the impact of recent public health interventions and policy changes. Additionally, dependence on reported case data likely underestimates the true disease burden, especially in resource-limited or underdiagnosed regions.
Conclusions
Echinococcosis remains a major public health challenge in China, with persistent high-prevalence clusters in the western and northwestern provinces – particularly Qinghai, which continues to be the geographic epicentre. While both reported incidence and cases declined from 2017 to 2020, spatial analyses reveal a southward shift in distribution, reflecting the evolving dynamics of transmission. To mitigate the risk of resurgence, it is essential to strengthen prevention, control, and surveillance in endemic regions, especially Xizang, Qinghai, and surrounding high-risk areas. Key strategies include intersectoral coordination, targeted control of definitive hosts (e.g. stray and domestic dogs), improved diagnostic capacity, and sustained community engagement. Continuous spatial monitoring and the implementation of integrated One Health approaches are critical to reducing the long-term burden of echinococcosis in China.
Supplementary material
The supplementary material for this article can be found at http://doi.org/10.1017/S0022149X25101016.
Financial support
Nanchang Centre for Disease Control and Prevention (Grant No. HX202405310002); Nanchang Centre for Disease Control and Prevention (Grant No. HX202405310003); 2024 Jiangxi Provincial College Student Innovation Training Program (Grant No. 2024CX247). The funders had no role in study design, data collection and analysis, decision to publish, or preparation of the manuscript.
Competing interests
The authors declare that the research was conducted in the absence of any commercial or financial relationships that could be construed as a potential conflict of interest.