


How much do the values of politicians endure throughout their careers? And how might the endurance and changes be explained? Values are basic building blocks of political ideologies as well as fundamental drivers of political thinking and behavior (Berlin Reference Berlin1969; Chong Reference Chong2000; Feldman Reference Feldman, Sears, Huddy and Jervis2003; Freeden Reference Freeden1996; Halman Reference Halman, Dalton and Klingemann2007; Maio et al. Reference Maio, Olson, Bernard, Luke and DeLamater2003; Rohan Reference Rohan2000; Stone Reference Stone2012). Political elites engineer the prominence and applications of specific values within ideological world-views (Freeden Reference Freeden2003; Zaller Reference Zaller1992). Because they determine the political utilization of values, it is important to investigate the structure and endurance of their own value systems. This creates a dilemma because virtually all research on values has focused on general publics. It is difficult to gain access to elites to measure their values directly.
A second limitation in value research is that many studies simply examine feelings about individual values (e.g., Feldman Reference Feldman1988; Lupton, Singh, and Thornton Reference Lupton, Singh and Thornton2015; Kinder and Kalmoe Reference Kinder and Kalmoe2017). This is problematic because psychological theory holds that people are rarely affected by single values alone. Instead, it is how values are regarded relative to other values that shapes their impact upon behavior (e.g., Schwartz and Bilsky Reference Schwartz and Bilsky1987; Schwartz Reference Schwartz1992; Verplanken and Holland Reference Verplanken and Holland2002; Davis and Silver Reference Davis and Silver2004). Therefore, we need to study individuals’ rank-ordered value structures (Rokeach Reference Rokeach and Rokeach1979).
The third and most pressing deficiency concerns the long-term persistence of individual value systems. Nearly all research conducted in psychology and political science assumes that values are relatively enduring throughout the life course, (Bardi et al. Reference Bardi, Lee, Hofmann-Towfigh and Soutar2009; Feldman Reference Feldman, Huddy, Sears and Levy2013; Vecchione et al. Reference Vecchione, Schwartz, Alessandri, Doring, Castellani and Caprara2016) else how could they structure beliefs and behaviors over time? And yet in neither discipline are there any empirical studies of value persistence across decades. Even shorter-term longitudinal data on value systems are rare (Feldman Reference Feldman, Sears, Huddy and Jervis2003, 497). For core values, the most basic and influential components of elites’ political belief systems, we know virtually nothing at all about their development throughout political lives and careers.
Our study surmounts all three shortcomings by using a unique dataset addressing the value structures of members of the British House of Commons. A sample of MPs, including both backbenchers and ministers, participated in face-to-face interviews during 1971–73. The survivors were re-interviewed 40 years later in 2012–16. Both interviews included measures of the MPs’ choices across identical sets of party-political and personal values.
With these data, we investigate the persistence hypothesis with regard to politicians’ value systems. The persistence hypothesis has guided research in a number of areas including political socialization, voting behavior, and symbolic political predispositions (Inglehart Reference Inglehart1990, Reference Inglehart1997; Sears and Funk Reference Sears and Funk1999). For MPs, the prediction is that value systems have crystallized by the time they enter Parliament and will thereafter remain relatively stable throughout their lives. Our 40-year panel data offer a robust test of this hypothesis because, to stick to their guns over these four decades, British MPs would have had to withstand extreme political turbulence, conflicting pressures, and ideological schisms in their parties.
We find strong evidence in favor of the persistence hypothesis. There is remarkable stability over time in the MPs’ political and personal value structures. Our findings have important implications for scholarly understandings of elite political behavior, as well as the basic concept of core values.
BACKGROUND
Building upon the pioneering studies by Milton Rokeach (Reference Rokeach1973; Reference Rokeach and Rokeach1979), Shalom H. Schwartz (Reference Schwartz and Bilsky1992; see also Schwartz and Bilsky Reference Schwartz and Bilsky1987), and Schwartz et al. (Reference Schwartz, Cieciuch, Vecchione, Davidov, Fischer, Beierlein, Ramos, Verkasalo, Lonnquivst, Demirutku, Dirilem-Gumus and Konty2012), we define “values” as abstract, general conceptions about desirable and undesirable end states (e.g., freedom, equality, etc.), and modes of conduct (e.g., compassion, duty) in human life. Value systems provide criteria for evaluating external stimuli and interacting with the social environment. They define what is “good” and “bad” in the world and motivate dispositions to act upon these evaluations.
Values are related to, but theoretically distinct from, phenomena like norms (Spates Reference Spates1983), beliefs (Fishbein and Ajzen Reference Fishbein and Ajzen1975), and attitudes (Eagly and Chaiken Reference Eagly and Chaiken1993). The latter typically refer to behavioral, cognitive, and affective responses to specific situations and stimulus objects. By contrast, values are nonspecific. To use Schwartz’s (Reference Schwartz, Seligman, Olson and Zanna1996) term, they are “transsituational.” Values do, nevertheless, share with other important orientations expectations for substantial stability over time (Vecchione et al. Reference Vecchione, Schwartz, Alessandri, Doring, Castellani and Caprara2016, 111).
The persistence hypothesis holds that after basic traits and values “crystallize” they are relatively enduring, changing only gradually throughout life. There is disagreement about precisely when the crystallization takes place. Some analysts suggest that it occurs very early in life when people are coming of age (Nie, Junn, and Stehlik-Barry Reference Nie, Junn and Stehlik-Barry1996), while others argue that crystallization develops during young adulthood, (Vecchione et al. Reference Vecchione, Schwartz, Alessandri, Doring, Castellani and Caprara2016; Stoker and Jennings Reference Stoker and Jennings2008), and still others say that high levels of stability do not exist until mid-life, after age 35 (Alwin Reference Alwin, Krebs and Schmidt1993). We do know that, by the time politicians first stand as serious candidates in a general election, many of their political attitudes and values are quite similar to those of their party’s elected representatives (Searing Reference Searing1978; Rush and Giddings Reference Rush and Giddings2011). After this, however, we know virtually nothing at all empirically about the post-crystallization endurance of politicians’ value systems.
Despite long-standing and widespread assertions of the persistence hypothesis, it remains remarkably vague and theoretically underdeveloped. How enduring is “relatively enduring?” Much the same, somewhat the same, recognizable traces? Over years, decades, lifetimes? Social psychologists provide the most serious theoretical contributions (Bardi and Goodwin Reference Bardi and Goodwin2011). Political science has not had much to say beyond signposting social learning theory (Jennings, Stoker, and Bowers Reference Jennings, Stoker and Bowers2009), while sociologists have suggested that reference groups might be an important part of the explanation (Alwin, Cohen, and Newcomb Reference Alwin, Cohen and Newcomb1991). Using these suggestions, we construct a general theory of persistence, apply it to politicians, and fit it empirically to the British House of Commons.
Mechanisms Promoting Persistence and Change
Politicians’ value systems are stabilized by two psychological anchors. One is their centrality, constituted by their many connections with other norms, beliefs, and attitudes (Rokeach Reference Rokeach1973). These connections threaten costly disruptions from changing one’s values. The other anchor is the politicians’ wariness of seeming inconstant. Presumably that is why so many of the re-interviewed MPs denied that their views had changed at all since 1973, and why more than a dozen MPs wanted copies of the value survey they completed in 1973 before agreeing to do another in 2013 (They didn’t get them).
Nevertheless, value systems, like many basic orientations and personality traits, are unlikely to persist unchanged over decades without reinforcements (Bandura Reference Bandura1986; Jennings, Stoker, and Bowers Reference Jennings, Stoker and Bowers2009; Sears and Funk Reference Sears and Funk1999). When value structures and their consequences are reinforced by rewards, the likelihood of maintaining those value structures increases. When disagreeable consequences follow, this likelihood diminishes. Thus, the persistence hypothesis is grounded theoretically in psychological mechanisms of social learning: Direct reinforcement employs tangible rewards and punishments. Vicarious reinforcement involves observing the behavior of others and its consequences. Self reinforcement relies upon self-satisfactions from defending one’s values or acting in accordance with them, which in turn interacts with the wariness of value change.
Within parliaments, direct and vicarious reinforcements are generated by parties and their whips and by intra-party reference groups. During ideologically stable decades, all these agents support the persistence principle by positively reinforcing policies and values that resonate with most MPs. By contrast, during ideologically turbulent times, different reinforcement agents may pull in conflicting directions. When new party leaders with new ideas re-structure their parties’ ideologies, they seek to modify their MPs’ preferences and priorities, while intra-party reference groups may help MPs resist. First we will consider reinforcement agents and mechanisms that ordinarily support the persistence principle by strengthening MPs’ established value structures. Then we shall consider the ideological turbulence between 1973 and 2013 that subjected the persistence principle to a robust stress test.
Parliamentary parties at Westminster employ direct reinforcement mechanisms, vigorously and continually, to keep MPs in tune with their leaders’ priorities. Whips engage backbenchers in discussions where the party’s political goals, accompanied by hints about rewards and sanctions, legitimize leadership policies (Searing Reference Searing1995). MPs vicariously observe backbenchers who accept the party’s priorities and win promotions, along with successful ministers who follow the leader’s line. Furthermore, self-satisfactions from defending the party leadership’s value priorities—when they are also one’s own—can be even more influential than the direct and vicarious reinforcements (Bandura Reference Bandura1986).
During 1973–2013, Westminster had a multitude of intra-party reference groups. These included formal ideological organizations like the Fabian Society, Tribune, the Bow Group, the Monday Club or P.E.S.T, informal groups such as Social Democrats, Miners, One-Nation Tories, or Nick’s Diner, and collections of like-minded friends. The contexts in which these kindred spirits gathered included meeting rooms, lobbies and corridors, the Tea Room, Dining Room and bars, or outside Westminster in London clubs or members’ homes. Such groups can function like the perspective-maintaining reference groups analyzed by Newcomb and his collaborators (Alwin, Cohen, and Newcomb Reference Alwin, Cohen and Newcomb1991) and suggested by Bardi and Goodwin’s (Reference Bardi and Goodwin2011) similar accounts of adopting identities. When individuals identify with a group of like-minded colleagues or friends, they tend to absorb the group’s values through direct, vicarious and self-reinforcement.
Reinforcements are often experienced in these contexts through the learning mechanisms discussed in social psychological theories of social influence and attitude change (e.g., Cialdini Reference Cialdini2007). Messages and cues are processed either by deliberative pathways, most likely used when subjects have retrieved a value from memory and discussed it before, or by automatic pathways, most likely used for values that are rarely questioned and rarely debated (Bardi and Goodwin Reference Bardi and Goodwin2011).
Deliberative Processes
In politics, direct deliberation is the most pervasive learning mechanism promoting persistence or change. Cues from respected sources strengthen the plausibility of well-constructed arguments. Such efforts are especially successful in hierarchical organizations like parliamentary parties where a good deal of conformity is expected and where top leaders claim authority for maintaining the organization’s values and goals (Bardi and Goodwin Reference Bardi and Goodwin2011).
One would be hard pressed to imagine contexts with more frequent deliberative party-political and intra-party reference group reinforcements than the British House of Commons. From discussing backbenchers’ and party leaders’ performances, partisan baiting in the Chamber and fencing in committees, to citing party manifestos, to engaging in endless political talk in bars, dining rooms, group meetings, or on the terrace, to one-on-one lectures from party whips, MPs know what the party leadership expects of them. They also know the potential rewards and sanctions. Guided by the party’s whips, these rewards include (for “young” MPs) recommendations for promotion to ministerial office and (for “old” MPs) honors including comfortable semi-retirements in the House of Lords. With intra-party reference groups, the rewards are less tangible, more social, and more likely to nurture self-reinforcement.
Automatic Processes
Automatic processes are less conscious and model comparatively passive learners. Socialization here is a nonrational process of “internalization.” If learners deliberate at all, they do so casually and inefficiently (Bardi and Goodwin Reference Bardi and Goodwin2011).
Social psychologists emphasize automatic processes because they find so many examples of successful resistance to deliberative persuasion in studies of attitude change (Haidt Reference Haidt2013). Their research shows that less conscious automatic processes like social proof (the tendency to see a value priority as appropriate when many others like oneself normally believe it) and cognitive dissonance (when performing behaviors inconsistent with one’s values, the less the compulsion, the more likely one is to modify one’s values to fit the behaviors performed) are more effective (Cialdini Reference Cialdini2007).
An important source of repeated cues supporting automatic value persistence among our politicians is voting at least several times a day by walking through a House of Commons division lobby, en masse with one’s party colleagues and leaders, to support policies that are often linked to the party’s political values. Social proof is in the air, particularly absent deliberative discussions about the issue. And when these supportive votes, especially if uncoerced by three-line whips, are inconsistent with heretical reservations in one’s value system, cognitive dissonance can pull the values back in line (Aronson Reference Aronson and Pratkanis2007). For successful long-term value persistence on the automatic pathway, politicians are moved more by subtle cues than by deliberative declamations.
Political Complications
By integrating suggestions from social psychology, political science, and sociology, we have constructed a theoretical foundation to support the long-standing assumption that post-crystallization persistence is the usual state of affairs in human development. Does this fit the experience of British MPs from the 1970s through the first decade of the twenty-first century? Reinforcement agents can sometimes work to undermine value persistence rather than support it. And for substantial periods during these decades, the Conservative and Labour party leaderships and their influential whips did just that. When important conditions of life change, value priorities can change too (Schwartz and Bardi Reference Schwartz and Bardi1997). One might think that there was more than enough radical change in our politicians’ life conditions over this period to bulldoze the persistence model.
Between 1975 and 1990, the Conservative Party was transformed by its new leader Margaret Thatcher, a “conviction politician” with very strong and—for 1975— quite idiosyncratic, neo-liberal values (Young Reference Young2013). She stunned and alarmed many Conservative MPs who complained that her ideology was not Conservative. And they resented the changes in the terms of the party’s reinforcement contingencies (patronage and promotion) on which they had planned their careers. On the Labour side, the parliamentary party’s left wing captured the leadership under Michael Foot in 1980, while the party in the country was infiltrated by the hard left from the late 1970s. This produced de-selections of moderate Labour MPs and eventually a party split as Labour’s embattled social democrats bolted in 1981 to form a new party, the SDP (Crewe and King Reference Crewe and King1995). Labour’s lurch to the left was eventually followed by a long march to the right during the 1990s under Tony Blair and Gordon Brown, who took on board free market values and some other aspects of Thatcherism (Heffernan Reference Heffernan2001).
The political turmoil of these four decades necessarily divided and repositioned the persistence principle’s reinforcement agents. The powerful parliamentary parties and whips now worked on behalf of new leaderships and new orthodoxies—not to reinforce their MPs’ 1973 core ideals and preferences but instead to restructure them. Ideological twists and turns during these years were not just about policies. They were about ideas embedded in these policies and used to justify them. Thatcherism, Democratic Socialism, Social Democracy, and Blairism were “isms” whose values and ideals ran through manifestos, memoirs, and parliamentary debates (Bevin Reference Bevin2000; Crewe and Searing Reference Crewe and Searing1988; Freeden Reference Freeden1999; Heppell Reference Heppell2002; Norton Reference Norton1990). Did these upheavals in the parliamentary parties’ political objectives and negative reinforcement programs override the persistence model which had presumably stabilized the MPs’ value systems before all the tumult began? Or were the politicians’ 1973 value systems successfully sustained by their centrality, self-reinforcements, and positive reinforcements from intra-party reference groups, kindred spirits, and friends? The MPs’ experiences during these four decades present the persistence hypothesis with a rigorous stress test.
DATA AND ANALYTIC STRATEGY
Psychological theory emphasizes that people think about multiple values rather than values in isolation from one another (Hitlin and Piliavin Reference Hitlin and Piliavin2004). And most researchers who study values believe that people hold them in relatively stable clusters or systems (Feldman Reference Feldman, Huddy, Sears and Levy2013; Jacoby Reference Jacoby2006). Psychologists, economists, and political scientists theorize these systems in terms of priorities, hierarchies, and trade-offs (Tetlock Reference Tetlock, Lupia, McCubbins and Popkin2000): “People usually make value-driven decisions about how to behave not based on the absolute importance of a value but rather on its importance relative to other values” (Parks-Leduc, Feldman, and Bardi Reference Parks-Leduc, Feldman and Bardi2015, 9; also see Rokeach Reference Rokeach1973; Davis and Silver Reference Davis and Silver2004). For instance, evaluations of domestic surveillance policies may be shaped by whether we prioritize freedom over security or security over freedom.
Core Values and Our Value Instrument
A primary issue in value research is determining which values to study (Kuklinski Reference Kuklinski and Kuklinski2001). We use values and ideals that were regarded as important by the politicians in the panel study (Searing Reference Searing1978).
British politicians, on their own, write many memoirs, autobiographies, political biographies, and political columns in newspapers and magazines. The inventory of their values began there. Items also were extracted from parliamentary debates, commentaries by parliamentary correspondents, and academic publications. The end result was four sets of nine values each, shown in Figure 1, arranged alphabetically within each of the four lists. They are all prominent in British political discourse, but Lists A and B are more party-political and ends-oriented, while C and D are more personal and means-oriented. The party-political values correspond to what Rokeach characterized as “terminal” values while the personal values correspond to his “instrumental” values.
Values Lists, as Presented to MPs in Face-To-Face Interviews

For convenience, we will refer to the 1971–73 period as 1973 and the 2012–16 period as 2013; and we will refer to all politicians, whether current MPs, members of the House of Lords, or retirees, as MPs. In both 1973 and 2013, respondents to the values survey were presented with the following instruction:
It would help us a great deal if you could rank the ideals in each group in the order of their importance to you. For each list, could you write the number one alongside the ideal which is most important to you? Then write two alongside the ideal which is second most important to you, and so on. In each group, the ideal which is least important should be given the number nine.
The value inventory took from six to twenty minutes to administer in 1973. This led to the decision in 2013 to use only two lists (A and C) rather than the full four.
The 1973 interviews were completed with a “saturation sample” of the British House of Commons’ 630 members, 83% of whom (521) were interviewed in face-to-face, transcribed sessions lasting on average an hour and a half. The sample included, at the same response rate, ministers and opposition front bench spokesmen. All were given written guarantees of anonymity. The interviews probed political careers and institutional practices as well as character traits and other psychological characteristics.
During the course of the interviews, respondents completed paper and pencil forms, including the value survey, which was returned by 84%. Seventy-nine percent returned a 58-item mailback questionnaire that included psychological scales, policy beliefs, and attitudes toward the institution of Parliament. In 2013, face-to-face re-interviews were completed with 114 out of the 127 living and “interviewable” (some were too ill) original participants (a response rate of 90%). Six were still serving in the House of Commons and 50 had moved to the House of Lords. These re-interviews lasted approximately an hour and covered a subset of identical questions from the 1973 interviews, some new ones on character traits, the original mailback questionnaire and the value survey, which were completed by 71% and 73%, respectively.
With panel data, there is always concern about sample attrition over time, especially when the panel waves are widely separated, as they are here. The 1973 interviewees who survived to become members of the 2013 sample differ from the nonsurvivors on several characteristics, including party, length of tenure in Parliament, education, and age of entry. These differences, however, should not be problematic for the current analyses because they are all uncorrelated with the outcome variables. Details are provided in Appendix A.
Potential Issues with Rank-Ordered Value Choices
Empirical representation of the value structures is provided by the individual MPs’ rank orders of the values—that is, each person’s statement of which value is most important, which is next most important and so on, down to the value he or she considers least important. While ranking instruments have been used in pioneering studies of human values (e.g., Rokeach Reference Rokeach1973; Reference Rokeach and Rokeach1979) and in more recent research (Jacoby Reference Jacoby2014), they have their critics.
One potential problem is that rank-orders may force a subject to make distinctions among values that she considers equally important (Krosnick and Alwin Reference Krosnick and Alwin1988). Empirically, this is not much of an issue. Several studies have constructed individual rankings by aggregating pairwise value choices and have shown that the latter are overwhelmingly consistent and transitive (Ciuk and Jacoby Reference Ciuk and Jacoby2015; Jacoby Reference Jacoby2006). This means that an individual’s pairwise choices can be combined to form a full ordering of the separate values. And the aggregated pairwise value choices produce rank-ordered structures that generally are very similar to those obtained from direct ranking instruments (Jacoby Reference Jacoby2011). Results like these would not occur if people were generally indifferent or ambivalent when weighing separate values against one another.
Although a few MPs complained about the ranking tasks in 1973 and in 2013, “artificial distinctions” among values did not seem to be a pervasive or serious problem (Searing Reference Searing1978). The first-wave version of our instrument passed social desirability, order effects, and validity tests (Searing Reference Searing1978). And, the vast majority of our MPs provided full rank-orders when asked to do so. From the total 341 administrations of the values instruments (i.e., by all MPs across two sets of values and two panel waves), 304 or just over 89% provided fully ranked sets of values. Given the ease with which the interviewees were able to provide them, we strongly believe that the rank-ordered values represent meaningful psychological distinctions for these respondents.
The second potential issue is that rank-ordered values are difficult to analyze because they produce ipsative measures (Alwin and Krosnick Reference Alwin and Krosnick1985). That is, the rank assigned to each value is not independent of the ranks assigned to the other values. Our response is that this is not a problem with rank-ordered values per se; rather, it is the use of statistical models that are not appropriate for that type of data (e.g., factor analysis). We use methods for which ipsativity is not a concern, primarily Spearman rank-order correlations for assessing stability in each MPs’ value structure, and Jacoby’s (Reference Jacoby2014) vector model for measuring the individual value structures themselves.
The Vector Model for Rank-Ordered Value Choices
The vector model provides a geometric representation of the MP’s rank-ordered value choices.Footnote 1 The values are shown as points in a two-dimensional space. The points are arranged such that pairs of values that receive similar rankings (i.e., MPs who rank one value highly also tend to rank the other value highly, and vice versa) across MPs are shown as pairs of points located close together, while pairs of values that receive different rankings (i.e., MPs who rank one value highly tend to place the other value low in their ranked hierarchy, and vice versa) are shown as pairs of points located farther apart within the space. Individual MPs are shown as unit-length vectors emanating from the origin of the same two-dimensional space.
Each MP’s vector is oriented so that it points toward the points representing that person’s highly ranked values and away from the points for values that are placed at lower ranks in that person’s structure. Specifically, an MP’s vector is located so that the ordering of the perpendicular projections from the value points onto the vector corresponds as closely as possible to the ordering of the values in that MP’s rank order; the person’s most important value is the point that projects closest to the tip of the vector, the second-highest ranked value corresponds to the point that projects to a position along the vector that is next closest to the tip, and so on down to the person’s least important value which projects onto (the line collinear to) the vector at a point that is farthest away from the vector’s tip. In this manner, the full set of vectors succinctly represents the MPs’ value structures. Jacoby’s (Reference Jacoby2014) nonmetric procedure estimates the positions of the value points and the MP vectors simultaneously to produce a geometric representation that represents as closely as possible (in the least-squares sense) the full set of MPs’ rank-ordered value choices. A simple hypothetical example of the vector model is presented in Appendix B.
EMPIRICAL RESULTS
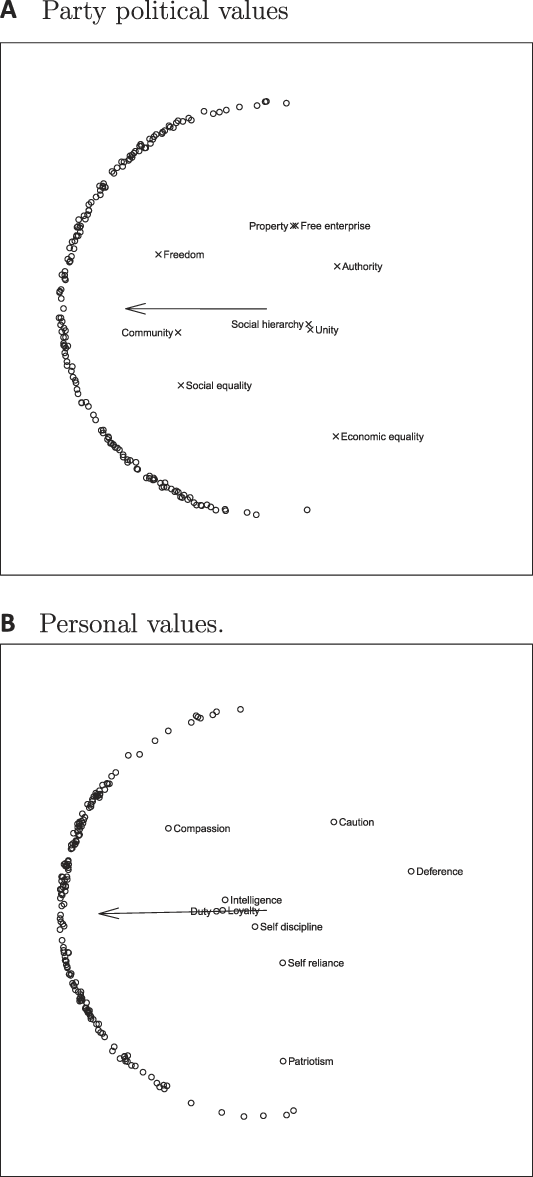
Let us begin by looking directly at the value structures of all the MPs, combining the data from the two time points. We do so using the geometric model, which is estimated separately for the two sets of values. The model of party-political values (from List A) is shown in Figure 2A and the model of personal values (from List C) is shown in Figure 2B. In each figure, the value points are shown as labeled Xs. The terminal points for the MPs’ vectors are shown as small open circles. (The left-pointing vectors drawn into both figures are mean vectors that will be explained below.) Note that the terminal points of the individual MPs’ vectors are jittered (i.e., a small amount of random noise is added to the terminal point coordinates) to break up their plotting positions; this makes it easier to discern variations in the relative concentration of vectors at different locations around the unit circle. Note also that, if an MP provided a rank order at both time points, then he or she is shown as two vectors—one representing the 1973 value structure and the other summarizing the 2013 value structure. The two time points are treated as independent observations and the corresponding vector positions are estimated independently of each other; that is, there is no analytic connection between an MP’s vector orientation in 1973 and the same person’s vector orientation in 2013. The relative positions of the two vectors are determined solely by the value choices that the individual reported at each of the two time points.Footnote 2
Vector Model of MP Value Structures, Showing all MPs, 1973 and 2013. Mean Vectors Also are Shown

Consider the party-political value structures in Figure 2A. Here, the vectors are arrayed more or less continuously around the left side of the unit circle. Those pointing toward the upper left (say, between the 10:00 and 12:00 positions) represent MPs who rank some combination of freedom, property, and free enterprise over the other values, with social and economic equality at the lowest positions within their rank orders. The vectors pointing toward the lower left (between about the 7:30 and 9:00 positions) depict MPs who rank social equality, freedom, and community highest in their structures, with property, free enterprise, and authority falling in the lowest ranks. Those vectors pointing downward (say between 6:00 and 7:00) are from MPs who rank economic equality highest, followed by social equality, and community. Once again, authority, property, and free enterprise are least important to this subset of MPs.
Turning to the MPs’ rank-ordered structures of personal values in Figure 2B, the vector terminal points fall into several clusters. First there is a small group of vectors centered around the 11:00 position. These people rank compassion and caution most important, followed by deference. A larger concentration of vectors terminate between the 9:00 and 10:30 positions. These MPs also rank compassion as most important. But they rank duty, intelligence, and loyalty above caution and the other values. A distinct cluster of vectors falls in the interval from just below the 9:00 position to about 8:00. These MPs still rank compassion first, followed by duty, intelligence, and loyalty. But they also rank self-discipline, self-reliance, and patriotism higher than the preceding sets of MPs. Finally, the small set of MPs with vectors pointing downward (say between 6:00 and 7:00) rank patriotism first, followed by self-reliance and self-discipline. In contrast to the other MPs, they also place compassion at the bottom of their rankings.
The mean vectors in the two panels of Figure 2 show the “average” structures for political and personal values, respectively. In each case, the mean vector is obtained simply by taking the mean of the individual vector coordinates. Substantively, the mean vector is interpreted like any other measure of central tendency. Considering the party-political values first, MPs on average rank freedom, community, and social equality (in that order) highest, followed by property, free enterprise, social hierarchy, and unity. Economic equality and authority were ranked at the bottom. The average across MPs for personal values places compassion in the most important position, followed by duty, loyalty, intelligence, self-discipline, patriotism, and self-reliance. Caution and deference occupy the least important positions in the average personal value structure.
The two geometric models show that there is wide variability in the individual structures underlying choices among both party-political and personal values. Differences across MPs, however, are not as extreme as they could be. While there clearly is disagreement about which core values are most important, there appears to be fairly wide consensus that certain values are less important. In addition, it is interesting that the consensus is greater on personal, rather than party-political, values. This makes sense: it is not unreasonable that MPs from different parties have varying ideas about desirable political end-states, while still maintaining similar ideas about the kinds of personal standards of behavior that should be exhibited in everyday life.
So far, we have examined variability across individual value structures without taking the two time points into account. Next we will examine the amount and type of change that occurred in the value structures from 1973 to 2013.
TEMPORAL STABILITY IN INDIVIDUAL MPS’ VALUE SYSTEMS
To examine the degree of stability and change in the MPs’ value structures over time, we calculate the Spearman rho correlation between the 1973 and 2013 rank orders for each individual politician—separately for the party-political and personal values. Of the 114 MPs in the sample, 72 gave complete rank orders (at both time points) for the party-political values, and 70 gave complete rank orders (again, at both time points) for the personal values.Footnote 3
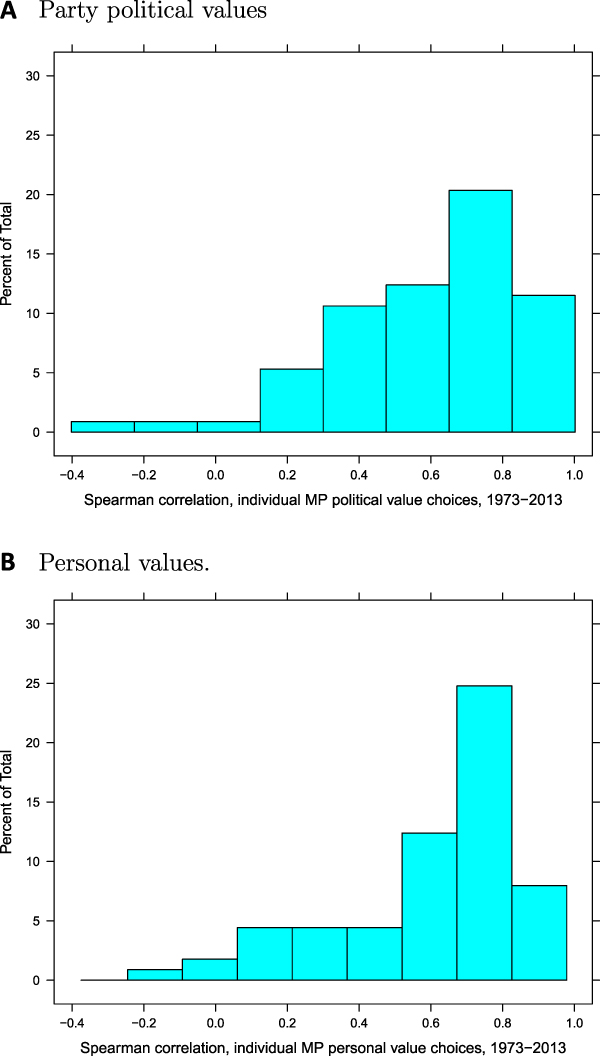
Figure 3 shows the histograms of the individual-level correlations for party-political values (Figure 3A) and personal values (Figure 3B). With both the party-political and personal values, there are wide distributions. Several MPs produced 2013 rankings that are almost identical to their 1973 rankings, improbable as this may seem. By contrast, a small subset of MPs produced 2013 value rankings that are negatively correlated with their 1973 data, albeit they are so few that we suspect measurement error instead of profound shifts in perspectives. The correlations for party-political values range from −0.35 to 0.95, with a median of 0.667 and a mean of 0.592. The correlations for personal values range from −0.20 to 0.93, with a median of 0.698 and a mean of 0.605. These are very impressive individual-level correlations, offering substantial support for the persistence hypothesis and for Rokeach’s and Schwartz’s expectations about long-term continuity in value systems.
Histograms Showing Distributions of Spearman Correlations for Individual Value Rank-Orders Between 1973 and 2013

Interestingly, the overall level of temporal stability in the rankings for one set of values is not very strongly related to the stability of the rankings for the other set of values. The correlations between the Spearman coefficients for party-political and personal values is only 0.294. This result suggests that the two value structures really are manifestations of different psychological processes. It does not appear to be the case that some MPs simply are more consistent in all their value choices over time while others are less so. And the low correlation also is consistent with other recent evidence that core political and personal values should be regarded as conceptually distinct from each other (Hitlin and Piliavin Reference Hitlin and Piliavin2004; Rathbun et al. Reference Rathbun, Kertzer, Reifler, Goren and Scotto2016). So the result makes sense from the general perspective of values theory.
How much stability or change should we reasonably expect to see, on average? Certainly not perfect stability, for the world changes over 40 years, and it is difficult not to notice. But even in the most tumultuous times, the world does not change totally and as we have already noted, politicians are particularly wary about the stigma of inconsistency.
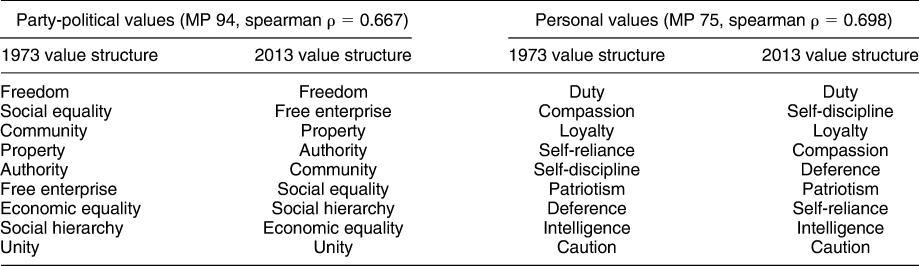
One way to evaluate the nature of temporal change in value structures is to examine some specific MP value structures over time. Table 1 shows the actual rank-orders given by two MPs whose temporal correlations are actually equal to the median correlations for the political and personal values, respectively.Footnote 4 MP 94 gave political value structures at the two time points that are correlated at 0.667 (the median level correlation for individual political value structures). The leftmost two columns of Table 1 show that this person ranked the same two values as most- and least-important across the 40-year time span, and that most other values only differ by one or two ranks. The biggest exception is that social equality and free enterprise switch places from 1973 to 2013, jumping across four ranks (from second to sixth and vice versa) in the overall ordering.
1973 and 2013 Rank-Orders Given by Individual MPs Whose Test-Retest Correlations are Equal to the Median Correlation for Party-Political Values and Personal Values, Respectively

Note: Within each column, the values are ordered by their importance within the MPs value structure for that year. The first row gives the most important value, the second row gives the second-most important value, and so on down to the least-important value for each MP in each year. The values shown within boxes in the rightmost columns were given tied ranks by MP 75 in 2013.
The two right-hand columns of Table 1 show the rank-orders for MP 75, whose temporal correlation for personal values structures is equal to the median for that value set (i.e., 0.698). Here, the situation is complicated by the fact that there are several ties in the ranking, indicated by the rectangular boxes in the rightmost column (i.e., values within a box are tied in MP 75’s rank-order). Despite the ties, it is still easy to see the similarity in the value structures across the two time points. For example, duty is ranked most-important in 1973 and tied for most-important in 2013, while loyalty is third, and intelligence and caution are the two least important values for this person in both years. Again, most of the intermediate-ranked values occur in similar, if not identical, positions in both years.
Thus, direct examination of value structures over time leads to a reasonable conclusion: MPs do change their value choices over time. But these changes are relatively minor differences in the relative positioning of values within the individual structures. For most MPs the overall contours of their value choices—that is, the subsets of values that they consider to be most and least important—are quite stable across the 40-year period.
Comparative Evidence Regarding Temporal Stability
But how stable is “quite stable?” We contextualize the significance of the MPs’ performance with panel-data benchmarks from general publics, other elites, and their own beliefs about policies and institutional arrangements.
General Publics
We begin with individual-level consistency correlations from values tests using members of the public. Over a one-month period, Braithwaite and Law (Reference Braithwaite and Law1985) discovered median test-retest reliabilities for Rokeach’s personal and socio-political values of 0.61 and 0.62. Median test-retest reliabilities reported by Rokeach (Reference Rokeach1973) for a period of 14 to 16 months were higher still: 0.74 and 0.69. In a two-year longitudinal study with Schwartz’s value instrument, Bardi and her colleagues (Reference Bardi, Lee, Hofmann-Towfigh and Soutar2009) found test-retest correlations ranging from 0.26 to 0.58, while Vecchione et al. (Reference Vecchione, Schwartz, Alessandri, Doring, Castellani and Caprara2016), using the same instrument, realized a mean of 0.66 over a four-year period. Testing the stability of Rokeach’s values over two months to seven years, Inglehart (Reference Inglehart1990) reported coefficients that fell off to 0.38 at the seven-year mark.
Thus, compared to consistency correlations with the public’s values, our politicians’ means (0.61 personal, 0.59 party-political) and medians (0.70 personal, 0.67 party-political), over 40 years are equal to or higher than the public’s means and medians in test-retest reliabilities over weeks and months. And these test-retest correlations were regarded as strong at the time by the researchers. When a public’s test-retest performance is stretched out to seven years, the consistency correlation sticks at approximately 40 percent lower than the MPs’ over four decades.
Elites
It is perhaps not surprising that the politicians’ values are more stable than the publics’, for panel studies comparing general attitudes of political elites and publics find the same thing. Several report elite correlations for left–right self-placements that exceed our politicians’ value correlations, but over much shorter periods of time ranging from one to six years: Italian regional councillors, 0.85 (Putnam, Leonardi, and Nanetti Reference Putnam, Leonardi and Nanetti1979); French deputies, 0.85 (Converse and Pierce Reference Converse and Pierce1986); Swedish parliamentarians, 0.88 (Granberg and Holmberg Reference Granberg and Holmberg1996); and American national convention delegates, 0.89 (Jennings Reference Jennings1992). Most other general attitudes in these shorter-term elite studies (toward conflict, political movements, and actors) produce continuity correlations in the 0.57–0.71 range, which are similar to our politicians’ correlations over four decades, and which Putnam et al. (Reference Putnam, Leonardi and Nanetti1979) characterized as “remarkable” and “astounding.”
Still, our benchmark value-system panel data are from publics, not political elites. And our benchmark elite panel data do not measure value systems. We therefore triangulate with a third benchmark: comparisons between the endurance of the MPs’ values and the endurance of their own beliefs about policies and institutional arrangements.
Policy and Institutional Beliefs
Values are expected to be more enduring than policy and institutional beliefs because values are broader and more abstract and hold more central positions in people’s schemas. True, significant changes took place in both British policies and institutions over these four decades. Yet significant changes took place in Conservative and Labour ideologies as well.
The 1973 and 2013 mailback questionnaires included survey items measuring eight policy beliefs and twelve attitudes about institutional arrangements. The full set is shown in Appendix D, which also reports the comparative analysis of stability in these items and the value data. This analysis shows that value choices are much more stable than either the policy attitudes or the institutional beliefs. 80% to 85% of MPs show more proportionate change in policy orientations than in party-political or personal value vector orientations. And 87% to 89% show more proportionate change in institutional beliefs than in the value structures.
Value Structure Persistence and Length of Tenure
When people find themselves in new worlds with more heterogeneous or quite different value structures, their views often change to better fit those of their new social circles (Rohan Reference Rohan2000). Hence we might expect MPs who left Parliament and distanced themselves from Westminster and its intra-party reference groups to show much lower levels of value structure stability than those who remained in the same parliamentary environment for longer periods of time. The MPs’ lengths of tenure vary widely, ranging from four to 60 years.Footnote 5 Comparing the stability of their political values by the length of time they spent in the Houses of Parliament provides another powerful test for the crystallization claims of the persistence hypothesis.
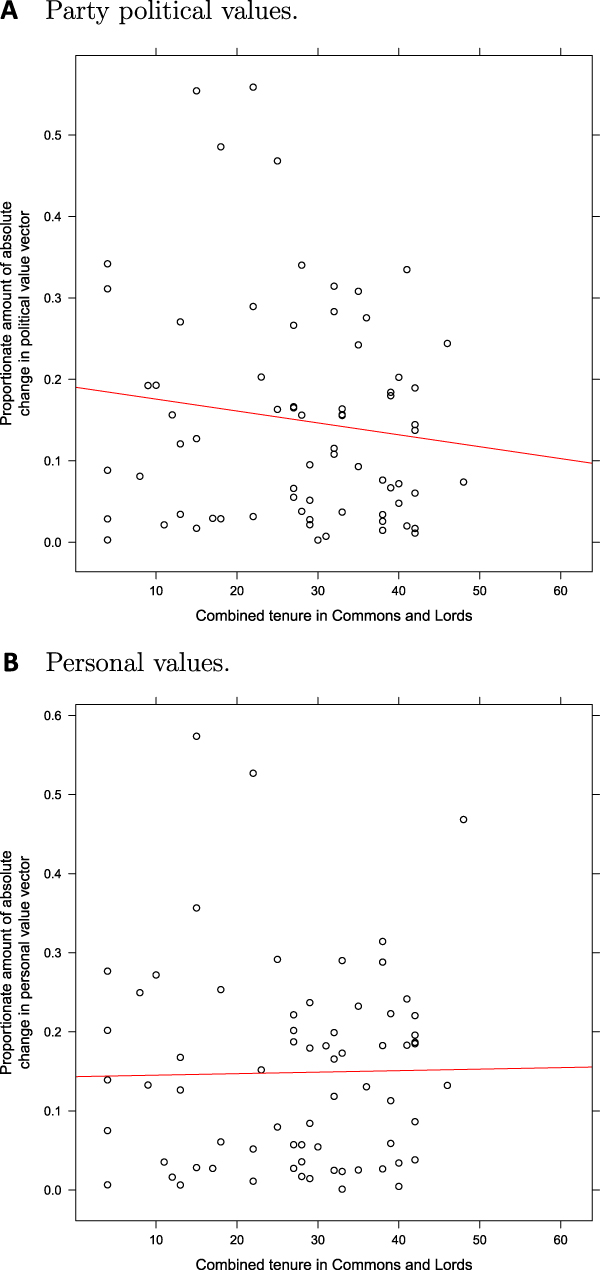
Figure 4 shows change in individual value structures as a function of tenure at Westminster. Value change is measured as the absolute difference in the direction of an MP’s vectors at the two time points, expressed as a proportion of the largest difference between value vectors. Parliamentary tenure (counting time in both Commons and Lords) is measured in years. Figure 4A shows party-political value structure change and Figure 4B shows change in personal values. In each panel of the figure, an OLS line is superimposed over the points to summarize the relationship.
Proportionate Absolute Change in Value Vector Directions 1973–2013 versus Combined Tenure in Commons and Lords

The results are very similar for both types of value structures. With regard to party-political values (Figure 4A), there is a very slight tendency for the absolute amount of value structure stability to increase with increasing length of tenure. This might reflect the whips’ weakening grip on older MPs in the Commons (which weights reinforcement equations in favor of value-supporting reference groups) and the generally weaker partisanship in the House of Lords. Still, the relationship is not statistically reliable: When proportionate value change is regressed on combined tenure in Parliament (Commons and Lords), the F-test for the equation is not significant (the observed P-value is 0.279) and the R-squared is very small at 0.017 (corresponding to a bivariate correlation of −0.130). The lack of any real relationship between value change and parliamentary tenure is even clearer when personal values are considered. In Figure 4B, the OLS line is effectively flat. The regression of proportionate change in personal value vector orientations on combined tenure in Parliament produces a nonsignificant F-test (the observed P-value is 0.881) and an even smaller R-squared that is effectively zero (the bivariate correlation is 0.0003).
Our results suggest that, compared to years lived in the wider world, serving in multiple Westminster Parliaments during 1973–2013 may have added a little to the stability of one’s party-political values, albeit this relationship is very weak and not statistically significant. And there is no discernible relationship at all between personal value stability and tenure in Parliament. We described this as a particularly powerful test for the persistence hypothesis whose crystallization claims are supported by the results: MPs who left Westminster’s world early on and lived for decades in very different environments nevertheless maintained their 1973 political value systems almost as steadily as did their former colleagues who stayed the course and enjoyed continuity in their reference group reinforcements in the Houses of Parliament. Given the political turbulence of these years, our parliamentary veterans experienced a good deal of negative reinforcement too. But the fact remains that pushes and pulls in either the wider world or at Westminster did not much move the leavers or lodgers. This suggests that politicians’ value orientations are remarkably resistant to change that the MPs did indeed get value-inoculated early on, and that their crystallized schemas stuck even for those who lived other types of lives in new social circles.
Value Structures and Parliamentary Parties
We close out our empirical analysis by turning to an important implication of the persistence hypothesis for comparative legislative behavior. “Crystallized cohorts” of MPs, whose value structures are relatively impervious to change, would be impediments to party leaders who want to lead their parliamentary parties in new directions. This was a problem that confronted both Margaret Thatcher and Tony Blair when they first assumed the leadership of their parliamentary parties. To test the degree to which this problem actually occurs, we will examine aggregate patterns in the value structures of Labour and Conservative politicians. Our hypothesis is that, on average, the respective partisan groups in the panel will show the same value choices in 2013 as they did in 1973.
The vector model is particularly well-suited to test this hypothesis because we can calculate the mean vector for each party’s MPs at each time point. The projections from the value points onto the mean vector represent the “average” value ranking for that party’s MPs in that year. Figures 5A and 5B show the models for party-political and personal values structures, respectively, with the mean vectors for the two parties, at the two time points, drawn in. The angles between mean vectors are directly interpretable. Just as with the individual vectors, the cosine indicates the correlation between the mean rankings between any two party/years.
Vector Model of MP Value Structures, Showing Mean Vectors for Parties, by Year

In Figures 5A and 5B, the first observation is that the two parties do not exhibit completely opposing value structures: their mean importance rankings definitely are not mirror images of each other (which would have been shown as mean party vectors that pointed in opposite directions from each other). Instead, for political values (Figure 5A), the angles between the Labour and Conservative mean vectors are closer to 90 degrees than to 180 degrees. The correlations between the Labour and Conservative mean vectors are 0.139 in 1973 and 0.476 in 2013. Although the rankings for key values differ sharply across the parties (e.g., economic equality, social equality, free enterprise, and property), overall, the parties do not exhibit wholly opposing party-political value structures.
Turning to the mean structures for personal values, Labour and Conservative MPs actually are fairly similar to each other. Figure 5B shows that the angles separating the two parties are quite a bit smaller than 90 degrees. The correlation between the personal value mean vectors for Labour and Conservatives is 0.740 in 1973 and 0.862 in 2013. Far from opposing each other, the parties are in substantial agreement on the most important (compassion and duty) and least important (deference) values; the only differences occur among the values that fall in the middle of the respective mean rank-orders. Overall, the evidence from the geometric model shows that the two parliamentary parties share a common political culture.
How shall we characterize the value change that occurred between 1973 and 2013, which is our ultimate concern here? The figures show that the party mean vectors for both party-political and personal value structures are closer together in 2013 than they were back in 1973. This might suggest partisan convergence in value structures. But, are the differences large enough to be meaningful? Clearly each party’s mean vectors for 1973 and 2013 are quite close together. That is particularly the case for Labour with the party-political values in Figure 5A and for Conservatives with the personal values of Figure 5B. Looking first at the party-political values (Figure 5A), the difference in the mean vector orientations for Labour MPs in 1973 and 2013 is not statistically significant (in a nondirectional test). The difference in the mean vectors for Conservatives across the same time period is statistically significant at the 0.05 level, but not at the 0.01 level (again, a non-directional test). For the personal values shown in Figure 5B, the orientations of the respective party mean vectors are not significantly different between 1973 and 2013. So between 1973 and 2013 there is only a very weak tendency for convergence in political values between Labour and Conservatives, and no evidence of significant convergence across the parties on personal values. Instead, the predominant result shows that there is very high stability in the party patterns of value rankings.
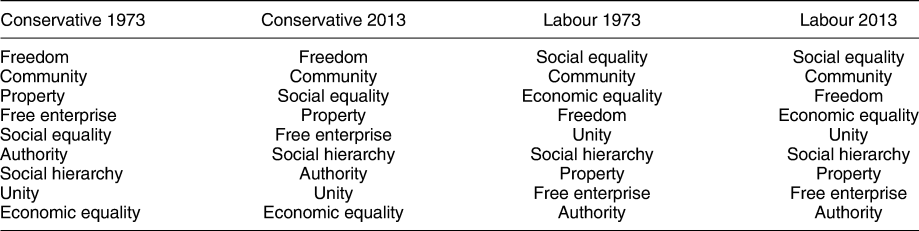
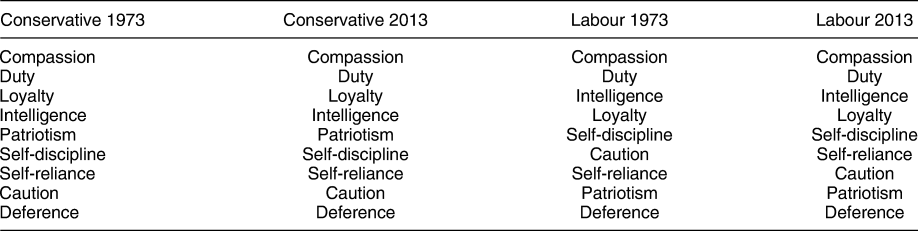
On average, the two sets of party members show nearly the same value rankings at the two time points. This is striking evidence of great stability in value choices, particularly given the time span of four decades along with the political convulsions that occurred during that period. We unpack these patterns of value rankings in Tables 2 and 3, which show the mean ranking of the nine political values in each list for the two parties at the two time points.
Average Rank-Orders of Nine Party-Political Values, by Party and Year

Note: Each column of the table gives the order in which the value points project onto the given party vector in the geometric model depicted in Figure 5A. The higher the row within the table, the higher the priority for that value, on average, within that party in that year.
Average Rank-Orders of Nine Personal Values, by Party and Year

Note: Each column of the table gives the order in which the value points project onto the given party vector in the geometric model depicted in Figure 5B. The higher the row within the table, the higher the priority for that value, on average, within that party in that year.
The rankings in each column in Tables 2 and 3 give the order in which the value points project onto each mean vector. The aggregate stability shown in these tables is extremely impressive. With regard to the Conservatives’ personal values in Table 2, all nine items are ranked in 2013 exactly as they were in 1973, while for Labour only two out of nine—self-reliance and caution—change places in the ranking.
There is more variability in the rankings of party-political values in Table 2 but not much more. Among Conservatives, Freedom and Community are ranked highest at both time points, while Unity and Economic Equality are ranked lowest. All the “action” occurs within the five middle ranks. Among Labour MPs there is even more stability: only two values switch places in the mean rankings over time: in 1973, Labour MPs ranked Economic Equality over Freedom on average. In 2013, those two values switch places in the ordering. Again, these are “middling” values—the two most important and the five least important remain perfectly stable in Labour’s average ranking over time. And among the rank changes, only one value shifts more than one rank between 1973 and 2013. Overall, there is no significant change in the party means over the time interval.
Could it be the case that we merely are observing the effects of partisanship? That is, party leaders articulate stable positions for their followers—positions that include value choices as well as policy positions. This seems unlikely, for the value priorities of both parties’ leaderships changed radically between 1973 and 2013, while those of our politicians did not follow suit. From an analytic perspective, if such partisan effects do exist, we should see the parties become more homogeneous with respect to value choices over time. That does not occur with our data. The length of a mean vector is inversely related to the variability in the orientations of the individual vectors contributing to the mean. So, greater intra-party homogeneity in value choices would be manifested in longer mean vectors for the relevant parties. Yet, in our data, the mean vectors in 2013 are always shorter than the mean vectors in 1973. That is the case for both parties and both sets of values. This shows that the parties actually become more heterogeneous over time with respect to value choices which is precisely the opposite of what should occur if the MPs’ expressed value choices are simply reflecting their party memberships.
The results in Figure 5 and Tables 2 and 3 show that, on average, party members’ value structures are highly stable. But this does not mean that the parties, themselves, are stable over time. The latter will be affected by temporal changes in composition, as incumbents suffer electoral defeat or retire, and “new blood” moves into Westminster. The evidence presented here does, however, support a very important political implication. Given the very high levels of aggregate stability in the panel, radical changes in aggregate party ideologies must have more to do with new views among new waves of recruits than with conversions among old members. Incumbent MPs who stay on at Westminster introduce an inertia into the predominant value orientations of the Labour and Conservative parliamentary parties that can only be overcome by replacement rather than resocialization.
DISCUSSION AND CONCLUSION
Virtually everything that is known empirically about value choices and structures comes from research on ordinary citizens. This study has provided important insights about stability and change in the political and personal value structures of politicians. How much do the values of politicians endure throughout their political careers? The answer seems to be quite a lot: more than the value systems of ordinary citizens, as much as other general elite attitudes measured over much shorter time intervals, and more than their own beliefs about policy and institutional arrangements.
Do these panel data confirm the long-standing and under-theorized persistence principle? Yes they do. Are the results nevertheless surprising? Yes they are. What is surprising is: (a) the very robust magnitude of persistence; (b) over four decades; (c) despite measurement error with subjects over 60 years of age; and (d) in the face of authoritative negative reinforcements. Let us consider each of these points.
Substantial endurance is what both Rokeach and Schwartz predicted, and this is what we find in our analysis of MPs’ value choices over a 40-year period. Of course there is change: a wide range at the individual level from virtually no change in four decades to a good deal. But, all in all, the MPs seem to have crystallized their value systems by their early thirties and generally maintained those values into retirement. This is consistent with the view that learning in parliamentary organizations is typically modest, albeit modest modifications can be politically significant. Similar findings have been reported for civil servants in the European Commission (Hooghe Reference Hooghe2005).
At the individual level, we find consistency correlations over 40 years that are comparable to very short-term test-retest correlations for the public’s values. But, our most telling analysis was the vector correlations between stability and length of service in the House of Commons and the Lords. This showed only a very slight tendency for those who carried on at Westminster to maintain their 1973 value systems more than did colleagues who left early for other careers and lives.
With regard to limitations, the most obvious weakness of our research design is that it uses only two time points: 1973 and 2013. Without more data in between it is impossible to know, for instance, whether some Wet Tory MPs may have moved during the Thatcher years closer to Mrs. Thatcher and then returned by the time of the 2013 re-interviews to where they were in 1973. Similarly, some Right-wing Labour MPs may have moved Left during the Foot-Benn era, and some Left-wing Labour MPs may have moved Right during the Blair-Brown era, both turning back toward their 1973 rankings by the time they were re-interviewed in 2013. Such “rebound effects” have been found in migrant studies (Verkasalo, Goodwin, and Bezmenove Reference Verkasalo, Goodwin and Bezmenova2006; Lonnquvist, Jasinskaja-Lahti, and Verkasalo Reference Lonnqvist, Jasinska-Lahti and Verkaslo2013), though they seem less plausible here.
Our results are certainly remarkable considering the evidence that people over 60 change their basic orientations more than do younger adults (Sears and Brown Reference Sears, Brown., Huddy, Sears and Levy2013) and that people over 60 are less able to give accurate reports in interviews about their mental states thereby increasing random measurement error and artificially reducing the magnitude of test-retest correlations (Krosnick and Alwin Reference Krosnick and Alwin1989). All the politicians we have re-interviewed are over 60.
The stability we have found is especially striking in light of the fact that the four decades spanned by our data were politically turbulent at Westminster. Other periods spanning four decades might be as well. But the point is that despite the radical realignments in the political parties and whips’ deliberative and automatic reinforcement patterns during the decades spanning 1973–2013, MPs stayed the course chosen at the beginning of their careers. Perhaps more stable times would see still greater value persistence in parliaments than we have found, for during such times, there will be relatively more congruence between reinforcement agents in parliamentary parties and intra-party reference groups. That is why the political twists and turns during these decades provide an impressive stress test for the persistence hypothesis: With Labour MPs, roughly half of their 40 years between 1973 and 2013 were characterized by jarring changes of their party’s course, first to the left, then to the right. On the Conservative side, Mrs. Thatcher’s neo-liberalism reset her parliamentary party’s reinforcement contingencies over fifteen years creating a new normal down to the present.
Many of these national politicians were involved in campaigns and political activities during adolescence, in party youth organizations, at university, and extensively as young adults. By the time they won their first election to Parliament, their political values already were quite similar to those of their party’s MPs. Our aggregate analysis of the persistence of their values finds them with nearly exactly the same rankings in 2013 as in 1973, strong evidence of the stability of value choices. This also is a significant obstacle for new party leaders with new ideas who wish to lead their parties in new directions. The obvious solution is to recruit new candidates whose views would be more compatible with those of the new leadership, and much activity in constituency parties during these years aimed to do just that, albeit this is not so easily accomplished (Norton Reference Norton1990).
While we do not have comparable value surveys for post-1973 generations, Norton’s (Reference Norton1990) ideological classification of individual Conservative MPs, based on attitudinal and behavioral data from 1979–89, is consistent with our claims about conversion versus replacement (Norton Reference Norton1990). He finds that Mrs. Thatcher was not very successful in converting members of her parliamentary party. The majority of his free-market and law-and-order Conservatives entered the House after 1973, while most of those who were interviewed in the current 1973 sample reported largely similar values at that time (Crewe and Searing Reference Crewe and Searing1988).
How did these MPs manage to hold onto their value systems so tightly across such a long time span? It is difficult to know for sure without deeper research into reinforcement agents and mechanisms. But one likely answer emphasizes the psychological anchors of value systems: (a) Rokeach’s (Reference Rokeach1973) argument that the centrality of values (their many connections with norms, beliefs and attitudes) stabilizes them; (b) self-reinforcements, which rely upon self-satisfactions from defending one’s values or acting in accordance with them; and perhaps (c) because value priorities are initially learned and maintained through combined variable reinforcement schedules, their subsequent persistence may require only intermittent support (Bandura Reference Bandura1986).Footnote 6 The other more familiar sociological answer takes us back to Alwin, Cohen, and Newcomb's (Reference Alwin, Cohen and Newcomb1991) analysis of the like-minded reference groups that Bennington College women sought and found throughout their lives. These provided positive reinforcement for their college-crystallized liberal attitudes and a prophylactic against experiences of negative reinforcement. At Westminster, many MPs identify with ideological factions, ideological ginger groups, and like-minded colleagues and friends with whom they associate regularly and from whom they receive direct and vicarious reinforcement for their shared value priorities and who nurture self-reinforcement for those who defend their values and act in accordance with them.
Outside Westminster, many MPs who have left continue to maintain connections through the Association of Former Members of Parliament, occasional reunions, receptions, meetings, lectures, visits, post, email, and phone conversations. They also look for kindred spirits in local politics and constituency associations and keep in touch with their roots by following political news and gossip about Westminster and reading the latest political biography or memoir. It is much more occasional, unsystematic, and informal than at Westminster and involves more self-reinforcement. But when individuals identify with an intra-party group or ideological tendency, it does not take much socializing to keep up the values shared with kindred spirits, or very much imagining to keep the faith with the living and the dead. They need all this to neutralize messages and cues about the “exciting” new directions in their parties, which they encounter through the press, books, party publications, print, and electronic media, and in views expressed by party supporters they cannot or do not wish to avoid.
Alwin (Reference Alwin, Krebs and Schmidt1993), who has investigated generational or cohort effects as much or more than anyone else, concluded that, in general, persistence theory is actually not strongly supported by convincing results in either longitudinal or cohort data. Nonetheless, he argued, the thesis does apply to some special subgroups in the population. The Bennington women were one such subgroup. National politicians are apparently another. Political values and ideals suffuse their daily experiences in political institutions and social settings and play a central role in their belief systems throughout their lives. All in all, it is intense political involvement that distinguishes national politicians from members of the general public and that explains the far greater stability in their political value systems. Moreover, during decades of ideological calm, they are likely to receive frequent and consistent positive reinforcement. But even during decades of ideological tumult, like 1973–2013, their psychological anchors and reference group reinforcements may carry the day. The result is value structures among national politicians that show remarkable consistency and create party dynamics that are driven more by turnover in elites than by individual-level ideological conversions.
We have constructed a general psychological theory of persistence, applied it to politicians, and fitted it to the British case. The general theory should travel well to other times and places. Even the ideological ferment during these decades may not be so peculiar to Britain. It was extreme, but it is not so unusual for parties to change directions following electoral defeats, the diffusion of ideas, or successful insurgencies.
SUPPLEMENTARY MATERIAL
To view supplementary material for this article, please visit https://doi.org/10.1017/S0003055418000692.
Replication materials can be found on Dataverse at: https://doi.org/10.7910/DVN/6A2J2T.






Comments
No Comments have been published for this article.