1. Introduction
A multidisciplinary methodological approach, including petrographic investigations, mineral and bulk-rock chemistries and U–Pb zircon geochronology, allows the age, origin and metamorphic evolution of lower crust sectors to be unravelled. Petrological studies of metamorphic paragenesis constrain the mineral equilibrium by taking into account the major-element distribution among principal mineral phases. On the other hand, the distribution of rare earth elements (REEs) among pairs of minerals such as garnet, zircon, orthopyroxene and amphibole during the high-grade metamorphism and anatexis, together with zircon geochronology, is one of the most challenging applications to define the chemical equilibrium among mineral phases and to constraint the ages of events in high-grade polyphasic metamorphic terranes. Well-constrained pressure–temperature–time (P-T-t) paths of lower crust sectors are useful for calculating the REE distribution coefficients (DREE) between competitors and for determining the DREE values indicative of chemical equilibrium. The paper provides middle to heavy rare earth element distribution coefficients between opportune competitors indicative of chemical equilibrium, derived from a petrological study based on textural relationships, geothermobarometric calculations and geochronological data.
Under granulite-facies conditions, the influence of temperature, pressure, rock chemistry and aqueous fluids or melts (open or closed system) on the magnitude of the equilibrium distribution coefficients of the REE is still to be proved. More data on rare earth element distribution coefficients between mineral phases in competition can help to identify equilibrium mineral assemblage pertinent to each metamorphic stage.
The distribution of REEs among pairs of minerals such as garnet, zircon and orthopyroxene has been investigated in natural and experimental examples producing a wide data range. Few data concerning the REE distribution between amphibole and garnet are currently available (Storkey et al. Reference Storkey, Hermann, Hand and Buick2005; Zong et al. Reference Zong, Liu, Gao, Hu, Gao and Gong2010).
The majority of the empirical data refers to zircon–garnet pairs (Harley et al. Reference Harley, Kinny, Snape, Black, Cassidy, Dunphy and van Kranendonk2001; Rubatto, Reference Rubatto2002; Whitehouse & Platt, Reference Whitehouse and Platt2003; Harley & Kelly, Reference Harley and Kelly2007; Buick et al. Reference Buick, Hermann, Williams, Gibson and Rubatto2006) in pelitic systems equilibrated under typical granulite-facies conditions (i.e. 750–900 °C and 0.6–1.2 GPa).
Only two significant experiments for REE distribution between zircon and garnet were performed. However, they relate to examples equilibrated under different pressures and containing either garnet with high Ca contents (10–22 wt % in Rubatto & Hermann, Reference Rubatto and Hermann2007) or without Ca (Taylor et al. Reference Taylor, Harley, Hinton, Elphick, Clark and Kelly2015). The combinations of empirical and experimental data led to two hypotheses: (1) the REE distribution defines a flat pattern with values around unity (Harley et al. Reference Harley, Kinny, Snape, Black, Cassidy, Dunphy and van Kranendonk2001; Whitehouse & Platt, Reference Whitehouse and Platt2003; Hokada & Harley, Reference Hokada and Harley2004; Kelly & Harley, Reference Kelly and Harley2005; Harley & Kelly, Reference Harley and Kelly2007; Taylor et al. Reference Taylor, Harley, Hinton, Elphick, Clark and Kelly2015) regardless of temperature (Taylor et al. Reference Taylor, Harley, Hinton, Elphick, Clark and Kelly2015); or (2) the REE distribution defines steep positive patterns with an increase of DREE values under lowering temperature (up to 800 °C), favouring zircon with respect to garnet (Rubatto, Reference Rubatto2002; Hermann & Rubatto, Reference Hermann and Rubatto2003; Buick et al. Reference Buick, Hermann, Williams, Gibson and Rubatto2006; Rubatto & Hermann, Reference Rubatto and Hermann2007). Empirical REE distribution coefficients in the zircon–garnet pairs from an intermediate, amphibole-free granulite (GRT3) were calculated by Fornelli et al. (Reference Fornelli, Langone, Micheletti, Pascazio and Piccarreta2014). The resulting equilibrium values differ significantly from other empirical data, being on average DGd-Ho<1 (DGd = 0.18; DHo = 0.53) and DTm-Lu>1 (DTm = 1.37; DLu = 3.12); only the DEr value is around unity (0.89). Regarding the REE distribution between orthopyroxene and garnet coexisting with zircon, Harley et al. (Reference Harley, Kinny, Snape, Black, Cassidy, Dunphy and van Kranendonk2001) proposed DHREEopx/grt values (abbreviations of minerals according to Kretz, Reference Kretz1983) suggestive of equilibrium in natural examples as lying within the range 0.03–0.01 under granulite-facies conditions. Fornelli et al. (Reference Fornelli, Langone, Micheletti, Pascazio and Piccarreta2014) observed a wider variation of DREE values for coexisting orthopyroxene and garnet during granulite-facies metamorphism. Whether the DREE values are indicative of equilibrium or not remains an unresolved question.
An effective competitor for medium REE (MREE) and heavy REE (HREE) with zircon, garnet and orthopyroxene is amphibole (Skublov & Drugova, Reference Skublov and Drugova2003), which can be consumed or formed during the prograde and retrograde stages in mafic or intermediate granulites (Storkey et al. Reference Storkey, Hermann, Hand and Buick2005). The HREE competition between amphibole and garnet is documented in some mafic and intermediate granulites (Storkey et al. Reference Storkey, Hermann, Hand and Buick2005; Buick et al. Reference Buick, Hermann, Williams, Gibson and Rubatto2006; Zong et al. Reference Zong, Liu, Gao, Hu, Gao and Gong2010), but the role of zircon in the HREE partition has not been discussed. An evaluation of the empirical REE distribution between amphibole and garnet can therefore indicate equilibrium DREE values, taking into account the deductions of calculated DREE values relative to zircon–garnet and orthopyroxene–garnet pairs for which an assessment of the equilibrium was made.
In this study a mafic amphibole-bearing granulite (Tur76A) has been considered for the REE distribution among zircon, orthopyroxene and amphibole with respect to garnet. Calculated data are compared with those of the intermediate granulite (GRT3) already studied by Fornelli et al. (Reference Fornelli, Langone, Micheletti, Pascazio and Piccarreta2014). The rock types experienced the same physical conditions (700<T<900 °C and 0.7<P<1.0 GPa) and contain garnet with similar grossular content (about 16 %) and zircon grains with core-rim structures. The dating of zircons, the REE contents of zircon, garnet, orthopyroxene, amphibole and the reconstructed metamorphic P-T-t path (Fornelli et al. Reference Fornelli, Langone, Micheletti and Piccarreta2011; Fornelli, Pascazio & Piccarreta, Reference Fornelli, Pascazio and Piccarreta2011) yield information about the DREE values suggestive of equilibrium between the above phases in the considered chemical systems.
2. Geological setting
A pile of crystalline rocks (Fig. 1), stacked during the Alpine orogenesis sensu lato, crops out in southern Italy (Amodio Morelli et al. Reference Amodio Morelli, Bonardi, Colonna, Dietrich, Giunta, Ippolito, Liguori, Lorenzoni, Paglionico, Perrone, Piccarreta, Russo, Scandone, Zanettin Lorenzoni and Zuppetta1976). The uppermost nappe (Sila Unit) consists of (from the bottom to the top): (1) a 7–8 km thick slice of lower-crust rocks (Schenk, Reference Schenk1980; Fornelli et al. Reference Fornelli, Piccarreta, Acquafredda, Micheletti and Paglionico2004); (2) a c. 13 km thick ‘layer’ of granitoids (Caggianelli, Prosser & Rottura, Reference Caggianelli, Prosser and Rottura2000; Fornelli et al. Reference Fornelli, Piccarreta, Acquafredda, Micheletti and Paglionico2004); and (3) medium- to low-grade upper-crust metamorphic rocks. The lower-crust rocks in the Serre Massif include (from the bottom to the top; Fig. 1): (1) granulite-facies metagabbros and meta-monzogabbros with rare meta-peridotites, felsic granulites and metapelites; and (2) metapelites with intercalations of metabasites, rare marbles and felsic orthogneisses (Paglionico & Piccarreta, Reference Paglionico and Piccarreta1978; Schenk, Reference Schenk1984; Micheletti et al. Reference Micheletti, Barbey, Fornelli, Piccarreta and Deloule2007). U–Pb data on separate and in situ zircons (conventional and spot analyses) from mafic and felsic meta-igneous rocks at the base and top of the lower-crust portion yield late Neoproterozoic – early Cambrian ages (545–575 Ma) for the emplacement of their igneous protoliths (Schenk, Reference Schenk, Daly, Cliff and Yardley1989; Micheletti et al. Reference Micheletti, Barbey, Fornelli, Piccarreta and Deloule2007, Reference Micheletti, Fornelli, Piccarreta, Barbey and Tiepolo2008; Fornelli et al. Reference Fornelli, Langone, Micheletti and Piccarreta2011). Metagabbros occur within the felsic granulites at the bottom of the section and concordant layers of metabasites are interleaved with the adjacent felsic granulites and metapelites (Fig. 1). Multistage decompression coupled with partial melting has been documented in the metagabbros of the lower crust on the basis of microtextural evidence and thermobarometric data (Fornelli et al. Reference Fornelli, Langone, Micheletti and Piccarreta2011; Fornelli, Pascazio & Piccarreta, Reference Fornelli, Pascazio and Piccarreta2011). The resulting assemblage reflects local variation of H2O activity, as evidenced by the formation of Pl-Opx, Pl-Opx-Am or Pl-Am coronas around clinopyroxene and porphyroblastic garnet (e.g. Schenk, Reference Schenk1984; Caggianelli et al. Reference Caggianelli, Del Moro, Paglionico, Piccarreta, Pinarelli and Rottura1991; Fornelli et al. Reference Fornelli, Piccarreta, Del Moro and Acquafredda2002; Acquafredda et al. Reference Acquafredda, Fornelli, Paglionico and Piccarreta2006, Reference Acquafredda, Fornelli, Piccarreta and Pascazio2008). The granulite-facies rocks contain amphibole and plagioclase as relicts of the pre-granulite metamorphic stages (e.g. Paglionico & Piccarreta, Reference Paglionico and Piccarreta1976; Maccarrone et al. Reference Maccarrone, Paglionico, Piccarreta and Rottura1983; Schenk, Reference Schenk1984; Acquafredda et al. Reference Acquafredda, Fornelli, Piccarreta and Pascazio2008). In Figure 1c, the clockwise P-T trajectory related to Variscan metamorphism reconstructed by Acquafredda et al. (Reference Acquafredda, Fornelli, Paglionico and Piccarreta2006, Reference Acquafredda, Fornelli, Piccarreta and Pascazio2008), implies: (1) P-T estimates of 1.1 GPa and c. 900 °C dated at 347–340 Ma (zircon ages in Fornelli et al. Reference Fornelli, Langone, Micheletti and Piccarreta2011 and Sm–Nd age of garnet in Duchene et al. Reference Duchene, Fornelli, Micheletti and Piccarreta2013) at the metamorphic peak forming granulite assemblage (garnet, clinopyroxene and orthopyroxene); (2) decompression at 0.8–0.9 GPa and 850 °C testified by a corona formed by orthopyroxene-plagioclase ± amphibole dated at 323–318 Ma between clinopyroxene and garnet; and (3) a further decompression and cooling stage at c. 300 Ma at P of 0.7–0.8 GPa and T of 650–750 °C completed at 279 Ma (zircon age in garnet-bearing metagabbros) (Fornelli, Pascazio & Piccarreta, Reference Fornelli, Pascazio and Piccarreta2011; Fornelli et al. Reference Fornelli, Langone, Micheletti, Piccarreta, Van Dijk and Van den Berg2012). During the last decompression (from 300 Ma until 279 Ma) a symplectitic corona including hydrous minerals and consisting of orthopyroxene, plagioclase, amphibole and biotite formed around the porphyroblastic garnets in the mafic and intermediate metamorphic rocks (Acquafredda et al. Reference Acquafredda, Fornelli, Piccarreta and Pascazio2008; Fornelli et al. Reference Fornelli, Langone, Micheletti, Pascazio and Piccarreta2014). The studied sample (Tur76A) derives from the lower part of the Serre deep crust (latitude 38 °49′ 23″ N, longitude 16° 17′ 54″ E). The previously studied sample GRT3 with which Tur76A is compared (Fornelli et al. Reference Fornelli, Langone, Micheletti, Pascazio and Piccarreta2014) derives from the same crust level. In both samples porphyroblastic garnet is surrounded by symplectitic corona formed during the last decompression stages. New empirical REE distribution coefficients between zircon/garnet and orthopyroxene/garnet have been calculated in the sample Tur76A and compared with those of both sample GRT3 and data in the literature to infer the equilibrium conditions; these were then utilized to calculate for the first time the REE distribution coefficients between coexistent amphibole and garnet under granulite-facies conditions.
(a) Map of Italy and schematic stratigraphic section of the Hercynian lower crust, not to scale. (b) Geological map of the sampled area from Fornelli et al. (Reference Fornelli, Langone, Micheletti and Piccarreta2011). (c) P-T-t path of the lower portion of the studied deep crust from Fornelli et al. (Reference Fornelli, Langone, Micheletti and Piccarreta2011).

3. Analytical methods
Chemical compositions of the whole rocks and major-element compositions in garnet, orthopyroxene, amphibole and biotite were performed at Bari University by x-ray fluorescence (XRF) spectrometry and a Cambridge S360 electron microscope equipped with a LINK AN 10.000 Si (Li) energy dispersive detector.
Trace-element composition was collected on specific domains of zircon, garnet, orthopyroxene and amphibole in the different textural sites; in addition, trace-element core-rim profiles relative to the porphyroblastic garnets were performed. These analyses were performed by laser ablation inductively coupled plasma mass spectrometry (LA-ICP-MS) (CNR, Istituto di Geoscienze e Georisorse Unità di Pavia, Italy). This instrument couples a Nd:YAG (neodymium-doped yttrium aluminium garnet) laser working at 266 nm with a quadrupole ICP mass spectrometer of type DRCe from Perkin Elmer. For trace-element determinations the laser was operated at a repetition rate of 10 Hz, with pulse energy c. 0.01 mJ and an ablation spot of c. 25 µm in size. For the acquisition of parameters, the reader is referred to Tiepolo et al. (Reference Tiepolo, Bottazzi, Palenzona and Vannucci2002). NBS NIST-610 was adopted as an external standard; precision and accuracy were assessed on the BCR-2 USGS reference glass and are better than 6 % relative (see online supplementary Table S1, available at http://journals.cambridge.org/geo). Different major elements were adopted as internal standards: 29Si for orthopyroxene and zircon and 44Ca for garnet, amphibole and clinopyroxene. Data reduction was carried out using the GLITTER software package (van Achterbergh et al. Reference van Achterbergh, Ryan, Jackson, Griffin and Sylvester2001). Minimum detection limits at 99 % confidence level were <10−5 ppm for most of the trace elements.
External morphology and internal microtextures of zircon on thin-section were observed by scanning electron microscropy (SEM) using a Zeiss EVO50XVP SEM (Bari University, Italy) equipped with a variable-pressure secondary-electron (VPSE) detector in high vacuum conditions (Griffin, Joy & Michael, Reference Griffin, Joy and Michael2010). This technique gives high-resolution images revealing the internal structures of zircon. In the sample Tur76A observations were made on seven separated zircon grains and five crystals in thin-section. The most suitable sites for spot analyses were selected on the images. All zircon grains were inspected before and after the isotopic and trace-element analyses in order to check the precise location of the spots.
Age determinations at IGG-CNR (Pavia, Italy) were performed using a 193 nm ArF excimer laser ablation (LA) microprobe (GeoLas200QMicrolas) coupled with a magnetic sector ICP-MS (Element 1 from Thermo Finnigan). The U–Pb analyses were carried out in single spot mode and with a spot size of c. 10 µm or 20 µm depending on crystal size. The laser operated at a frequency of 5 Hz and with a fluence of 12 J cm−2. Sixty seconds of background signal and at least 30 s of ablation signal were acquired. The signals of masses 202Hg, 204(Pb + Hg), 206Pb, 207Pb, 208Pb, 232Th and 238U were acquired in magnetic scan mode. 235U is calculated from 238U on the basis of the ratio 238U/235U = 137.88. The 202 and 204 masses were collected in order to monitor the presence of common Pb in zircon. In particular, the signal of 202Hg was acquired to correct the isobaric interference of 204Hg on 204Pb (Horn, Rudnik & McDonough, Reference Horn, Rudnik and McDonough2000). The relatively high-Hg background prevents the detection of low 204Pb signals, however, hampering the calculation of small common Pb contributions. In the present work all analysed zircons have shown signals of 204 mass indistinguishable from the background; as a result, no common Pb correction has been applied (more analytical details in Tiepolo, Reference Tiepolo2003). Mass bias and laser-induced fractionation were corrected by adopting zircon 91500 (1062.4 ± 0.4 Ma; Wiedenbeck et al. Reference Wiedenbeck, Allé, Corfu, Griffin, Meier, Oberli, Von Quadt, Roddick and Spiegel1995) as the external standard. During each analytical run, reference zircon 02123 (295 Ma; Ketchum et al. Reference Ketchum, Jackson, Culshaw and Barr2001) was analysed together with unknowns (see online supplementary Table S2, available at http://journals.cambridge.org/geo) for quality control; the resulting ages were 293 ± 10 Ma (Oc12a) and 293 ± 6 Ma (Oc12b). Time-resolved signals were carefully inspected to detect perturbation of the signal related to inclusions, cracks or mixed age domains. Within the same analytical run, the error associated with the reproducibility of the external standards was propagated to each analysis of the sample (see Horstwood et al. Reference Horstwood, Foster, Parrish, Noble and Nowell2003); after this procedure, each age determination is considered accurate within the quoted error. The concordia test was performed for each analytical spot from 206Pb/238U and 207Pb/235U ratios using the relevant function in the software package Isoplot/Ex3.00 (Ludwig, Reference Ludwig2003). The same software was used to calculate the mean concordia age and the mean square of weighted deviates (MSWD). The percentage of discordance is calculated as {[1–(206Pb/238U age/207Pb/235U age)]×100}. U–Pb ages are considered as concordant for a percentage of discordance within the range ±1 %, whereas U–Pb ages are considered as sub-concordant for a percentage of discordance up to 3 %. Discordant data have not been taken into account.
4. Petrography and whole-rock chemistry
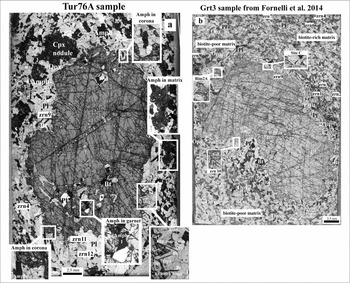
The studied sample (Tur76A) shows foliation defined by brown amphibole, plagioclase and orthopyroxene; accessory minerals are apatite, zircon and Fe-oxide. The porphyroblastic garnet (2 cm in size) includes amphibole, plagioclase, orthopyroxene and drop-like quartz (Fig. 2a). Many small crystals of zircon are present within and around the garnet, which is surrounded by a continuous corona consisting of plagioclase, orthopyroxene, amphibole and biotite. One clinopyroxenitic nodule is separated from the near-porphyroblastic garnet by a corona of amphibole, orthopyroxene and plagioclase (Fig. 2a).
Microphotographs of thin-sections showing porphyroblastic garnets and locations of zircon (zrn), biotite (Bt), orthopyroxene (Opx), plagioclase (Pl), clinopyroxene (Cpx) and amphibole (Amph). (a) Sample Tur76A; REE-rich amphibole and REE-poor amphibole in bight and lobe of garnet, respectively, are indicated in insert at the bottom on the right. (b) Sample GRT3 modified from Fornelli et al. (Reference Fornelli, Langone, Micheletti, Pascazio and Piccarreta2014). Abbreviations of minerals according to Kretz (Reference Kretz1983).

With the exception of the presence of amphibole, this sample shows features in common with the intermediate granulite (GRT3) derived from the same crust level (Fornelli et al. Reference Fornelli, Langone, Micheletti, Pascazio and Piccarreta2014). The common features are (Fig. 2): (1) the elongated shape of garnet rimmed by symplectitic corona formed by plagioclase, orthopyroxene and small flakes of biotite; and (2) the presence of a rim characterized by millimetric lobes and bights (Fig. 2a, insert bottom right). Symplectitic corona around garnet is continuous and both lobes and bights have been considered as steps of the dissolution of the original garnet rim during the progressive decompression (Fornelli et al. Reference Fornelli, Langone, Micheletti, Pascazio and Piccarreta2014). In this sample the multistage decompression (Fig. 1c) is evidenced by the corona around the clinopyroxenite nodule dated at 323–318 Ma in Acquafredda et al. (Reference Acquafredda, Fornelli, Piccarreta and Pascazio2008) and by the symplectite around garnet formed during 300–279 Ma (Fornelli et al. Reference Fornelli, Langone, Micheletti and Piccarreta2011).
The sample (Tur76A) has a gabbroic composition with Mg number [MgO/(MgO + FeO)×100] = 39, SiO2 = 49.19 wt % and K2O = 0.65 wt % (Table 1). The REE pattern is poorly differentiated (Fig. 3) with relative enrichment of LREE with respect to HREE without Eu anomaly (LaN/LuN ratio = 2.71; ∑LREE = 65.84 ppm; ∑HREE = 18.37 ppm; Eu/Eu* = 0.93).
Chemical composition of whole rocks.

REE patterns of whole rocks nomalized to McDonough & Sun (Reference McDonough and Sun1995) chondrite.

The comparison with the chemical composition of the intermediate granulite (GRT3 from Fornelli et al. Reference Fornelli, Langone, Micheletti, Pascazio and Piccarreta2014) shows that, despite the different major-element composition, the REE abundances are comparable in both samples even if the Tur76A sample shows a quite flat REE pattern without Eu anomaly and a slightly higher content of Nd, Sm, Gd, Tb and Dy (Table 1; Fig. 3).
5. Mineral chemistry and U–Pb zircon ages
The U–Pb zircon ages and the chemical compositions of garnet, orthopyroxene, zircon, amphibole and biotite have been discussed and compared with those from sample GRT3 (Fornelli et al. Reference Fornelli, Langone, Micheletti, Pascazio and Piccarreta2014).
5.a. Sample Tur76A
Garnet is an almandine (50–57 mol %)-pyrope (19–25 mol %)-grossular (15–18 mol %) solid solution with minor andradite (4–5 mol %) and spessartine (3–4 mol %) components. Substantially, it shows a flat end-member profile with slight decrease of Mg number from the core (33) to the rim (28). The edge of garnet demonstrates evidence of millimetric lobes and profound bights (Figs 2a, 4a) formed during the consumption of the original rim. The trace-element abundances (Table 2) and the REE patterns along a core–outer-core traverse (30 spot analyses) are homogeneous with variable ∑REE in the range 185–239 ppm (average 209 ppm), slight enrichment of HREE (YbN/GdN = 5.37; Fig. 5a) and small negative Eu anomaly (Eu/Eu* = 0.68). Very different REE abundances occur along the present rim (Table 2; Figs 4a, 5a), where it is possible to observe: (1) a marked REE increase (up to 756 ppm; Fig. 4a) in the lobes with high YbN/GdN ratio (11.17) and low Eu/Eu* value (0.36); and (2) a pronounced REE depletion at the bights (REE averaging 185 ppm) where REEs assume values comparable with those of garnet core (Fig. 5a), with lower YbN/GdN (average 5.25) and higher Eu/Eu* (0.68) ratios.
Sketches of thin-sections. (a) Analysed sites and ∑REE (in bold) of porphyroblastic garnet from (a) sample Tur76A and ∑REE (in brackets) of amphiboles in the different textural sites; and (b) sample GRT3 (numbers from 3 to 50 and from 53 to 62 represent the analyses along traverses from Fornelli et al. Reference Fornelli, Langone, Micheletti, Pascazio and Piccarreta2014).

Trace elements (mean values in ppm and standard deviation σ) in core and rim (lobes and bights) of garnet from Tur76A sample. Details of analysed points in Figure 4a.

The analyses were performed by LA-ICP-MS (minimum detection limits at 99 % confidence level were <10−5 for most of the elements; precision and accuracy were assessed on the BCR-2 USGS reference glass and are more than 6 % relative).
REE patterns in the different sites of porphyroblastic garnets normalized to chondrite (McDonough & Sun, Reference McDonough and Sun1995): (a) sample Tur76A and (b) sample GRT3 from Fornelli et al. (Reference Fornelli, Langone, Micheletti, Pascazio and Piccarreta2014).

Pyroxene is present as clinopyroxene in the clinopyroxenite nodule and as orthopyroxene in matrix and in coronas around the porphyroblastic garnet and the clinopyroxenite nodule.
The nodule consists of large crystals of diopside (En 33.8–38.5; Fs 15.4–19.2; Wo 45.5–47.8) with Mg number ranging from 81 (core) to 85 (rim). The REE contents of clinopyroxenes range from 168 ppm to 137 ppm with a negative Eu anomaly (Eu/Eu* = 0.34) and a flat HREE pattern (YbN/GdN = 1.1) (Table 3; Fig. 6a).
Trace elements (in ppm) of clinopyroxene in nodule and orthopyroxenes from corona and matrix (sample Tur76A).

REE patterns of (a) clinopyroxenes in nodule, Tur76A sample; (b) orthopyroxene in corona and matrix, Tur76A sample; and (c) orthopyroxene in GRT3 sample (from Fornelli et al. Reference Fornelli, Langone, Micheletti, Pascazio and Piccarreta2014). REEs have been normalized to chondrite (McDonough & Sun, Reference McDonough and Sun1995).

The nodule is rimmed by corona formed by orthopyroxene, amphibole and plagioclase. The composition of orthopyroxene in this corona is En 52–56, Fs 43–46 with Mg number c. 60; amphibole is brown Fe-potassic pargasite with mg number c. 53 and plagioclase shows labradoritic composition with An53.
Orthopyroxene included in garnet as well as that occurring in the symplectitic corona around the garnet are both Mg-rich (Mg number 62–66); orthopyroxene in matrix has a homogeneous chemical composition with Mg number c. 62 and low contents of REE (2–4 ppm), whereas crystals of corona around the clinopyroxenite nodule and garnet show homogeneously higher REE contents (Table 3; ∑HREE c. 8 ppm; YbN/GdN in the range 1.86–26.2; Y c. 10 ppm) (Fig. 6b). The homogeneous REE contents of orthopyroxene in the coronas of garnet and clinopyroxenite nodule could depend on the role of competitors such as amphibole and zircon and on the negligible influence of clinopyroxene.
Thirteen crystal domains were analysed for U–Pb isotopic system: eight crystals were separated and five grains were analysed in situ on thin-sections within symplectitic corona around garnet (Table 4, Fig. 2a). In Figure 7a, 13 concordant ages from 278 ± 6 Ma to 513 ± 9, two sub-concordant ages at 276 ± 6 Ma and 283 ± 10 Ma, and discordant data are represented. Zircon grains show core-rim textures (Fig. 7b) interpreted as indicating dissolution of the former crystal and successive precipitation forming the present rim (zrn 181; Fig. 7b). The younger ages from 278 ± 6 Ma to 345 ± 5 Ma (Table 4) represent 70 % of the analysed homogeneous luminescent domains, whereas the older ages (513 ± 9 Ma, 466 ± 15 Ma, 436 ± 15 Ma, 434 ± 6 Ma and 413 ± 6 Ma) are related to preserved/ghost oscillatory zoning inner domains (Fig. 7b).
LA-ICP-MS U–Pb isotope data and calculated ages (Ma) for zircons from sample Tur76A. Sub-concordant and discordant data are indicated in italic. Analyses were performed on B-scan mode (c – core; r – rim). All zircons in thin-section are in symplectitic corona.

(a) Concordia diagram with concordant (white ellipse), sub-concordant (grey ellipse) and discordant (black ellipse) U–Pb data in sample Tur76A. (b) VPSED images of the analysed zircons in sample Tur76A. Circles indicate the U–Pb spot ages. The concordant ages are given with normal characters, whereas the ages with low probability of concordance are shown in italics. Dotted circles indicate the trace-element spot analyses. The numbers in white boxes indicate ∑REE. On rim of zircon 181 three spot analyses were performed. (c) VPSED images of zircons in sample GRT3, modified from Fornelli et al. (Reference Fornelli, Langone, Micheletti, Pascazio and Piccarreta2014).

Fourteen domains of zircons were analysed for trace elements (Table 5). The zircon age of two domains is unknown. The REE contents in the analysed zircons range from 146 ppm to 2516 ppm (Table 5). Generally, the older cores (413–513 Ma) are richer in Y, HREE, Sc and Pb and poorer in Li and U than the analysed younger zircon rims of age 278–303 Ma (Table 5, Fig. 8a). On the rim of zircon 181, dated at 303 Ma, three spot analyses were performed in order to verify its REE content. The average of the REE contents is 177 ppm (Table 5). The undated domain of zircon 215 shows low REE contents (242–297 ppm) as for the zircons dated at 303 Ma and 278 Ma (177 ppm and 363 ppm, respectively); it is therefore considered as a young zircon with an age in the range 278–303 Ma (Fig. 8a). On the whole, the analysed zircons show fractionated REE patterns (YbN/GdN from 31 to 56) with negative Eu anomalies decreasing in the younger domains (Eu/Eu* ratio ranges from 0.29 to 1.0 in zircons with ages <303Ma) and positive Ce anomalies (Fig. 8a).
Trace-element composition (in ppm) in selected zircon domains from sample Tur76A.

(a) REE patterns of analysed zircons in sample Tur76A normalized to chondrite (McDonough & Sun, Reference McDonough and Sun1995). REE pattern of zircon rim 181 is the average of three spot analyses. Zrn 215 and zrn 227 in sample Tur76A are undated. (b) REE patterns of zircons in sample GRT3, from Fornelli et al. (Reference Fornelli, Langone, Micheletti, Pascazio and Piccarreta2014).

The lack of Eu negative anomaly together with the presence of positive Ce anomaly in zircons with ages 303 Ma and 278 Ma (Table 5) could be due to oxidizing conditions in the micro-domain favouring Eu+3 and Ce+4 rather than Eu+2 and Ce+3 (Trail, Watson & Tailby, Reference Trail, Watson and Tailby2012). In fact, the plagioclase preferentially incorporated Eu+2 in a reducing system inducing negative Eu anomaly in the other coexisting minerals. The last decompression in the studied rock occurred under fluid-present conditions after 303 Ma, causing the formation of a corona with plagioclase, amphibole, biotite, ±orthopyroxene and recrystallized zircons without Eu anomaly.
The Ti contents of zircons (generally from 8.6 ppm to 22 ppm) are unrelated to the ages. The Th/U ratio ranges from 0.09 to 0.44 with higher values in the older domains, suggesting a magmatic record (Xia et al. Reference Xia, Zheng, Yuan and Wu2009; Chen, Zheng & Xie, Reference Chen, Zheng and Xie2010; Zhang, Zheng & Zhao, Reference Zhang, Zheng and Zhao2010). Zircon 11 in the symplectitic corona around garnet (Figs 2a, 7a; Table 5) deviates from the general behaviour since it shows a high value of Th/U (0.40) despite the younger age (278 ± 6 Ma); it might therefore have grown during the last decompression stage (dated at 280 Ma in Duchene et al. Reference Duchene, Fornelli, Micheletti and Piccarreta2013) in a fluid- or melt-present context. Zircons with ages 413–513 Ma are richer in Y and HREE than the analysed younger zircons (278–303 Ma; Table 5; Fig. 8a).
Amphibole is present in garnet, matrix and coronas around the clinopyroxenite nodule and garnet. It is a brown Fe-potassic pargasite with K >0.36 atoms per formula unit (apfu). Major-element composition of amphibole in matrix, in garnet and in corona around clinopyroxenite nodule is homogeneous with Mg number c. 53 (Table 6). An increase of Mg number (54–60) characterizes the amphibole from symplectitic corona around garnet. Regarding the trace-element distribution (Table 7), amphibole included in the garnet core (amph 1 in Fig. 9; abbreviations of mineral according to Kretz, Reference Kretz1983) shows lower contents of Sc (75 ppm), V (546 ppm) and Cr (135 ppm) and higher contents of Ti (17057 ppm) and Ni (150 ppm) than those of the matrix (Sc = 143 ppm; V = 824 ppm; Cr = 374 ppm; Ti = 14448 ppm; Ni = 132 ppm); another crystal (amph 3 in Fig. 9) included in the peripheral part of garnet shows Sc, V, Cr, Ti and Ni contents similar to those of the matrix.
Mean major element analyses of amphiboles in the different textural sites from sample Tur76A.

Means of trace elements (in ppm) in amphiboles from the different textural sites of the sample Tur76A.

The analyses were performed by LA-ICP-MS (minimum detection limits at 99 % confidence level were <10−5 for most of the elements; precision and accuracy were assessed on the BCR-2 USGS reference glass and are more than 6 % relative).

Regarding REE distribution, the amphibole occurring in corona around garnet defines two distinct populations having similar convex patterns at different levels of REE abundances (Table 7; Fig. 10): type 1 (Fig. 2a, bottom right; Fig. 4a) occurs near the REE-poor bights of garnet rim and shows high REE contents (680 ppm) and YbN/GdN ratio (0.71); type 2 (Fig. 2a, bottom right) occurs near the REE-rich lobes of garnet rim (Fig. 4a) and has lower REE contents (493 ppm) and YbN/GdN ratio (0.50). Amphibole in matrix shows lower REE contents (441 ppm) and nearly flat HREE pattern (YbN/GdN = 1.12). Amphibole occurs around the nodule of clinopyroxenite, proving a pattern which is intermediate between amphibole type 1 and amphibole in matrix, whereas its Cr and Ti contents are similar to those of amphibole type 2 (Fig. 9). The two crystals included in garnet (amph 1 and amph 3, Fig. 10) display lower HREE contents (127 ppm) and a more fractionated pattern (YbN/GdN = 0.20) than all the other amphiboles.
(a) Averaged REE patterns and (b) YbN/GdN ratio v. HREE of amphiboles from sample Tur76A.

To summarize, on the basis of trace-element distribution (Cr, Ni, Ti, Sc, V and REE) and of textural features, it appears that different types of amphibole occur in the studied sample (Figs 9, 10): (1) Amphiboles in matrix and in corona near bights of garnet (type 1 REE-rich) show quite similar flat REE patterns and similar contents of Ti and Cr. (2) Drop-like amphibole included in garnet core displays fractionated REE pattern, high Ti and low Cr contents. According to Acquafredda et al. (Reference Acquafredda, Fornelli, Piccarreta and Pascazio2008), the drop-like inclusions of plagioclase, amphibole and clinopyroxene in porphyroblastic garnet represent relict phases recording the pre-granulite stage. (3) Amphibole in corona near garnet lobes (type 2 REE-poor) shows fractionated REE pattern, high Cr contents and low Ti contents. (4) Amphibole from corona of clinopyroxenite nodule shows similarities with amphibole of type 1 (similar REE pattern), amphibole of type 2 (high Cr contents) and amphibole from matrix (similar Ti contents).
Biotite is present only in corona around garnet. It is Mg rich (Mg number 64 on average) and shows very low REE contents.
5.b. Comparison with intermediate granulite GRT3
The chemical compositions of minerals in sample GRT3 (Fornelli et al. Reference Fornelli, Langone, Micheletti, Pascazio and Piccarreta2014) are summarized here. The porphyroblastic garnet (Fig. 2b) is an almandine (48–59 mol %) with grossular around 16 mol % and Mg number decreasing from core (41) to peripheral domains (27). The REEs and Zr (averaging 146 ppm) concentrations are very high, particularly along the core-rim profile; the ΣHREE, on average, gradually decreases from 2463 ppm to 1434 ppm and increases towards the lobes up to 5874 ppm (rim 2A, lobe in Fig. 4b). Millimetric bights interrupt the continuity of the former rim and expose the interiors of garnet (Fig. 4b) approaching their REE contents (site ‘c’ in Fig. 4b). This distribution of the HREE allowed three regions of garnet to be distinguished (Fig. 4b): (1) an inner core region (average ΣHREE = 2463 ppm); (2) an outer core (average ΣHREE = 1434 ppm); and (3) a peripheral region, about 3 mm thick, in which the ΣHREE increases at the lobes (rim 2A in Fig. 4b) and decreases at the bights (rim 1A and site ‘c’ in Fig. 4b). The chondrite-normalized patterns of REE relative to the core, outer core and rim regions (rim 1A, rim 2A and site ‘c’ in Fig. 4b) are given in Figure 5b and are derived from Fornelli et al. (Reference Fornelli, Langone, Micheletti, Pascazio and Piccarreta2014). The distribution of HREE at the margin of garnet in GRT3 is similar to that of garnet in sample Tur76A: HREE-poor bights and HREE-rich lobes. Fornelli et al. (Reference Fornelli, Langone, Micheletti, Pascazio and Piccarreta2014) interpreted the high abundances of HREE at the lobes as due to consumption of garnet and redistribution of HREE via intra-crystalline diffusion in smaller volumes of the crystal (‘held back effect’ according to Harley & Kelly, Reference Harley and Kelly2007).
Garnet of the amphibole-bearing sample Tur76A has comparable end-member profiles, but REE abundances are distinctly lower than those of garnet in the sample GRT3 (without amphibole) even if the REE budget in the two reservoirs was similar (Table 1, Fig. 3). The present rim with lobes and bights shows the same HREE behaviour as in GRT3.
In sample GRT3 orthopyroxene is present in matrix and in symplectitic corona around garnet with homogeneous composition (Enstatite 64–68; Mg number 65–68) and REE slightly fractionated patterns (YbN/GdN ratio from 9 to 13, Fig. 6c). From Figure 6c, however, it appears that the average of REE in some crystals from symplectitic corona near the lobes of garnet (rim 2A) is lower (6.41 ppm) and less fractionated (YbN/GdN = 2.85) than the REE average in orthopyroxene from matrix (13–20 ppm) and in the residual corona (9–10 ppm). Orthopyroxene in corona around garnet from sample Tur76A shows REE contents ranging from 4.91 ppm to 14.69 ppm (Table 3), slightly higher than those of orthopyroxene from matrix (2.06–4.21 ppm). The variability of REE abundance in orthopyroxene from corona of garnet is unrelated to bights or lobes of garnet; the orthopyroxene compositon in corona of garnet has therefore been averaged (see Section 6.b below).
In the sample GRT3, concordant and sub-concordant ages of zircons range from 289 ± 9 Ma to 357 ± 11 Ma (Fornelli et al. Reference Fornelli, Langone, Micheletti, Pascazio and Piccarreta2014). The REE data of ten micro-domains on four dated zircon crystals are given in Figure 7c (from Fornelli et al. Reference Fornelli, Langone, Micheletti, Pascazio and Piccarreta2014). The analysed domains have moderate to high Th/U ratios (0.15–0.57), which mainly tend to decrease from core to rim. The high Th/U ratio in the core could suggest a magmatic origin of zircons; the lower Th/U ratio in the rims indicates a new growth assisted by aqueous fluids or hydrous melts (Zhou et al. Reference Zhou, Xia, Zheng and Chen2011; Fornelli et al. Reference Fornelli, Langone, Micheletti, Pascazio and Piccarreta2014).
The ∑REE in the zircon domains older than 305 Ma has high values (731–1763 ppm), whereas in the zircon domains dated at 305–296 Ma, ∑REE varies from 1180 to 439 ppm and defines steep patterns (Fig. 8b) with YbN/GdN ratios in the range 14–35. On the whole, it appears that the REE content of zircon in the amphibole-free sample (GRT3) is higher than in the amphibole-bearing sample (Tur76A), as occurs for garnet.
6. Discussion
The studied sample (amphibole-bearing Tur76A) has mafic composition and contains garnet with about 16 mol % of grossular and zircons showing core-rim structures. These characteristics are also shown by the biotite-bearing sample GRT3, which has an intermediate composition (Fornelli et al. Reference Fornelli, Langone, Micheletti, Pascazio and Piccarreta2014). The main difference between the two samples is that of higher REE contents in garnet, zircon and orthopyroxene in the sample GRT3. Both rocks derive from the same crust level, and they were equilibrated under similar thermo-barometric conditions (Fig. 1c): P from 1.0 GPa to 0.7 GPa; T from 900° to 700 °C; geothermal gradient from 21 °C km−1 to 29 °C km−1 in a timespan between 350 Ma and 280 Ma (Fornelli et al. Reference Fornelli, Langone, Micheletti and Piccarreta2011; Fornelli, Pascazio & Piccarreta, Reference Fornelli, Pascazio and Piccarreta2011; Fornelli et al. Reference Fornelli, Langone, Micheletti, Piccarreta, Van Dijk and Van den Berg2012).
In both samples the reabsorbed garnet is surrounded by continuous symplectitic corona which formed during the decompression, consisting of plagioclase + orthopyroxene + biotite ± amphibole (Fig. 2). The present rim of garnets shows REE-rich lobes and deep millimetre-scale REE-depleted bights, reflecting the metamorphic history and P-T conditions during the decompression phases. In the initial step of garnet dissolution, under low geothermal gradient (21 °C km−1), intra-crystalline diffusion favoured a higher concentration of REE in the lobes of garnet. Subsequently, under increasing geothermal gradient (29 °C km−1), a faster dissolution of garnet caused chemical material transfer towards the reaction products, forming REE-depleted bights of garnet.
The presence of amphibole in the symplectitic corona in the sample Tur76A affects the REE contents in coexisting zircon, garnet and orthopyroxene because it is an effective competitor for middle and heavy REEs. The present data allow the REE distribution coefficients for the pairs zircon–garnet, orthopyroxene–garnet and amphibole–garnet to be calculated, and the values of approached equilibrium during the metamorphic evolution of mafic and intermediate granulites to be hypothesized. Zircon–garnet and orthopyroxene–garnet pairs are compared with data from the literature, allowing information to be gained about the equilibrium conditions for amphibole–garnet pairs.
6.a. Zircon–garnet relationships
Several empirical determinations and experimental studies of DREE (zircon–garnet) have been performed mainly on metapelitic and granitic systems. The results interpreted as indicating chemical equilibrium are notably different: (1) REE nearly equally partitioned between zircon and garnet (D c. 1; Whitehouse & Platt, Reference Whitehouse and Platt2003; Harley & Kelly, Reference Harley and Kelly2007; Taylor et al. Reference Taylor, Harley, Hinton, Elphick, Clark and Kelly2015); (2) DREE fractionated patterns assuming high DREE values (> 4 from Er to Lu) at decreasing T (Rubatto & Hermann, Reference Rubatto and Hermann2007); and (3) DREE more fractionated from Gd to Lu, but with lower values ranging from 0.18 (DGd) to 3.12 (DLu) in an intermediate granulite (Fornelli et al. Reference Fornelli, Langone, Micheletti, Pascazio and Piccarreta2014). In this paper, DREE zircon/garnet in a mafic granulite have been calculated to gain more information.
In the studied sample (Tur76A), the pre-Silurian zircon domains have not been considered to evaluate the zircon–garnet relationships because the garnet was missing during that time, as shown by its oldest Sm/Nd age at 354 Ma in a sample taken in the same area (Duchene et al. Reference Duchene, Fornelli, Micheletti and Piccarreta2013).
When normalized to garnet core, the zircon domain, dated 303 Ma (zrc 181; ∑HREE = 177 ppm obtained by averaging three spot analyses), overlaps the previously sets; this is interpreted as suggestive of equilibrium of zircon domains dated at 339–336 Ma, 325–320 Ma and 305 Ma combined with the outer core of garnet in the sample GRT3 (Table 8; Fig. 11a; Fornelli et al. Reference Fornelli, Langone, Micheletti, Pascazio and Piccarreta2014). The overlap of the partition coefficients is evident, notwithstanding the different REE contents in both garnet and zircon in the two samples (Fig. 11a). Around 300 Ma ago the original garnet rim experienced dissolution up to 279 Ma (Fornelli et al. Reference Fornelli, Langone, Micheletti and Piccarreta2011), forming the present rim with HREE-rich lobes and HREE-poor bights (Figs 2, 4). The zircon domains in symplectitic corona (zrc 12, zrc 11) around garnet seem to have formed together with amphibole of symplectitic corona when the original garnet rim underwent dissolution, as shown by ages of 298 Ma and 278 Ma which are consistent with the timing of garnet dissolution. The DHREEzrn/grt values have therefore been calculated for the combination of zircon dated 298 Ma with the near REE-rich garnet lobe, which produced DREE patterns far from equilibrium. The values are in fact too low, similarly to that for the zircon domain dated 300 Ma in a comparable site of sample GRT3 (Fig. 11b). Subsequent incremental garnet dissolution produces HREE-poorer bights around 279 Ma (Fornelli et al. Reference Fornelli, Langone, Micheletti and Piccarreta2011) and the formation of new zircon with low HREE contents (zrc 11 dated at 278 Ma with ∑HREE 356 ppm). The low HREE content of zircon was probably conditioned by simultaneous crystallization of REE-rich amphibole in symplectitic corona. The zircon domain dated 278 Ma together with the undated zircon having low HREE contents (zrc 215) were combined with HREE-poor garnet bights; DHREEzrn/grt values show a positive trend (Fig. 11c) with increasing values from Gd to Lu which, however, are slightly different from those hypothesized as equilibrium values in current literature (Whitehouse & Platt, Reference Whitehouse and Platt2003; Rubatto & Hermann, Reference Rubatto and Hermann2007; Fornelli et al. Reference Fornelli, Langone, Micheletti, Pascazio and Piccarreta2014). These calculated values (Table 8, Fig. 11c) tend to be higher than the set indicated by Fornelli et al. (Reference Fornelli, Langone, Micheletti, Pascazio and Piccarreta2014), mirroring the trend of Rubatto & Hermann (Reference Rubatto and Hermann2007) towards temperature around 800 °C (Rubatto & Hermann, Reference Rubatto and Hermann2007). In the studied case, an increase of the geothermal gradient from 21 °C km−1 to 29 °C km−1 (Fornelli, Pascazio & Piccarreta, Reference Fornelli, Pascazio and Piccarreta2011) is actually consistent with temperature around 800 °C. These trends (Fig. 11c) probably reflect approached equilibrium between the considered zircon–garnet domains at 278 Ma in mafic granulite.
Empirical HREE distribution coefficients approaching equilibrium calculated between zircons having different ages and various regions of garnet (core, garnet bight near zircon 11, REE-poor garnet bights) in sample Tur76A. The composition of zircon 181 rim was obtained averaging three spot analyses. The mean of DHREEzrn/grt is also reported, interpreted as equilibrium, from Fornelli et al. (Reference Fornelli, Langone, Micheletti, Pascazio and Piccarreta2014). Zircon 215 is undated.

Comparison between calculated DHREEzrn/grt considering zircons in Tur76A sample and those in literature. (a) DHREEzrn(303 Ma)/grt calculated with respect to garnet core compared with mean of DHREEzrn/grt in sample GRT3 (from Fornelli et al. Reference Fornelli, Langone, Micheletti, Pascazio and Piccarreta2014), representing equilibrium conditions. (b) DHREEzrn(298 Ma)/grt calculated with respect to REE-rich garnet rim (near lobe) showing values far from equilibrium conditions. DHREEzrn(300 Ma)/grt pattern out of equilibrium in sample GRT3 is reported for comparison. (c) DHREEzrn(278 Ma)/grt calculated with respect to REE-poor garnet rim (near bight) showing a restored equilibrium in sample Tur76A, are shown and compared with undated zircons (with low HREE contents) normalized to REE-poor bights. DHREEzrn/grt patterns from literature are also reported.

To summarize, the zircon domain dated at 303 Ma combined with the core of the coexisting garnet (diachronic growth of garnet from 354 Ma to 309 Ma in Duchene et al. Reference Duchene, Fornelli, Micheletti and Piccarreta2013) probably shows approached equilibrium (Fig. 11a), assuming DHREEzrn/grt values similar to those interpreted by Fornelli et al. (Reference Fornelli, Langone, Micheletti, Pascazio and Piccarreta2014) as suggestive of equilibrium in the sample GRT3. The zircon domain dated 298 Ma, combined with the lobes of garnet (HREE-rich), produces patterns far from equilibrium as for the zircon dated 300 Ma in the GRT3 sample occurring in a similar site (Fig. 11b). The younger zircon domain in symplectitic corona of garnet (278 Ma in sample Tur76A), normalized to composition of the garnet bights, produces DHREEzrn/grt values suggestive of possible chemical equilibrium (Fig. 11c). From all these observations it emerges that: (1) a diachronic growth of garnet occurred in the considered granulites (339 Ma in sample GRT3; 303 Ma in sample Tur76A); (2) dissolution of garnet began at c. 300–298 Ma, forming HREE-rich rim preserved in the lobes under disequilibrium conditions due to intra-crystalline diffusion and sequestration of HREE in the former rim of garnet; and (3) at 278 Ma, REE-poor garnet bights probably formed in equilibrium with nearby zircon due to inter-crystalline diffusion, favoured by the presence of fluids or melts, as shown by biotite and amphibole growth in corona. The crystallization of REE-rich amphibole in garnet corona near bights accounts for the low HREE content in the zircon dated at 278 Ma.
6.b. Orthopyroxene–garnet relationships
In sample Tur76A, orthopyroxene from matrix is slightly lower in REE (2.06–4.21 ppm) in comparison with orthopyroxene from corona (4.91–14.69 ppm ppm); the REE content of the latter is unrelated to lobes or bights of garnet. The mean composition of orthopyroxene in symplectitic corona has been considered in the following calculations. The DHREEopx/grt values calculated between orthopyroxene from matrix and garnet core as well as those of the combinations orthopyroxene from corona and REE-poor garnet rim (bights) overlap many of the empirical equilibrium values suggested by Harley et al. (Reference Harley, Kinny, Snape, Black, Cassidy, Dunphy and van Kranendonk2001) and Harley & Kelly (Reference Harley and Kelly2007) (Fig. 12, Table 9). Instead, the DHREEopx/grt values calculated for orthopyroxene from corona and REE-rich garnet rim (lobes) produce data mostly outwith the equilibrium range (Fig. 12, Table 9).
Patterns of the calculated DHREEopx/grt in different textural sites from sample Tur76A compared with DHREEopx/grt of sample GRT3 from Fornelli et al. (Reference Fornelli, Langone, Micheletti, Pascazio and Piccarreta2014). Grey area represents the equilibrium values suggested by Harley et al. (Reference Harley, Kinny, Snape, Black, Cassidy, Dunphy and van Kranendonk2001).

Empirical REE distribution coefficients calculated between orthopyroxene and garnet in different textural sites in sample Tur76A. Column A provides the DHREEopx/grt data from sample GRT3.

A: DREE of orthopyroxenes in corona (mean n = 6) near HREE-rich garnet lobe normalized to REE-rich garnet rim 2A in GRT3 sample from Fornelli et al. (Reference Fornelli, Langone, Micheletti, Pascazio and Piccarreta2014). B: sample Tur76A orthopyroxene in matrix (n = 3) normalized to garnet core; C: orthopyroxene in corona (n = 4) normalized to HREE-poor garnet bights. D: orthopyroxene in corona (n = 4) normalized to HREE-rich garnet lobe.
The lack of equilibrium of orthopyroxene from corona with REE-rich lobes of garnet rim suggests that the REE ‘held back effect’ at garnet rim, as also evidenced by DHREEzrn/grt, is due to low HREE diffusion during garnet dissolution, which does not promote equilibrium with the corona minerals (Tajcmanova et al. Reference Tajcmanova, Podladchikov, Powell, Moulas, Vrijmoed and Connolly2014). On the other hand, DREE opx-grt patterns falling outwith the equilibrium range were demonstrated by Fornelli et al. (Reference Fornelli, Langone, Micheletti, Pascazio and Piccarreta2014) in the sample GRT3 combining orthopyroxene in symplectitic corona and REE-rich lobes of garnet rim (Fig. 12).
6.c. Amphibole–garnet relationships
Figure 13 reports the DREEamph/grt patterns of the combinations: (1) included amphibole–garnet core; (2) amphibole from matrix–garnet core; (3) HREE-rich amphibole from corona (type 1) HREE-poor garnet rim (bights); and (4) REE-poor amphibole from corona (type 2) HREE-rich garnet rim (lobes). The calculated values are given in Table 10. It appears that DREEamph/grt trends are clearly different starting from Gd. During the garnet growth, REEs from Gd to Dy prefer amphibole with DGd-Dy ≥ 1 (amphibole in garnet and in matrix with respect to garnet core), whereas REEs from Ho to Lu were sequestrated by garnet. When the garnet was consumed and corona formed under decreasing pressure, initially slow intra-crystalline diffusion in garnet caused concentration of REE from Tb to Lu in the new rim (lobes), whereas MREE (Sm-Gd) preferred amphibole (Table 10). Subsequently, fast dissolution of garnet favoured the inter-crystalline diffusion, also due to the presence of fluids or melts, and the REEs from Sm to Er preferred the amphibole (DREEs 12.03–1.24), whereas again Tm, Yb and Lu remained in garnet.
Patterns of the calculated DREEamph/grt in different textural sites and various domains of porphyroblastic garnet in the sample Tur76A are reported. The values interpreted as being indicative of chemical equilibrium are indicated in bold (see legend).

Empirical REE distribution coefficients calculated between amphiboles in different textural sites and various regions of garnet (core, HREE-poor bights and HREE-rich lobes) in sample Tur76A. The equilibrium values are highlighted in bold.

A: mean of amph 1 and amph 3 included in garnet normalized to garnet core; B: amphibole in matrix normalized to garnet core; C: REE-rich amphiboles in corona (type 1) normalized to REE-poor garnet bights; D: REE-poor amphiboles in corona (type 2) normalized to REE-rich garnet lobes.
On the whole, amphiboles give distinct and coherent DHREEamph/grt, which follow the metamorphic evolution: (1) during the prograde evolution up to stabilization of orthopyroxene in the matrix (granulite facies), the distribution coefficients show that amphibole prefers MREE (Sm-Dy) and garnet prefers HREE (Ho-Lu) (Fig. 13); (2) during the post-peak decompression under still high temperature the garnet breakdown initiated and intra-crystalline diffusion was effective; REE-poor amphibole (type 2) formed in corona (Fig. 4a); and (3) during subsequent rapid dissolution of garnet (bights), MREE- and HREE-richer (type 1) amphibole formed in corona (Figs 4a, 10).
On the basis of the data obtained from the REE distribution between zircon–garnet and orthopyroxene–garnet, the distribution of REE can be tested between amphibole and garnet reflecting equilibrium or disequilibrium conditions. The amphibole included in garnet probably represents a relict phase (Fornelli et al. Reference Fornelli, Langone, Micheletti and Piccarreta2011) and the DHREE pattern indicates chemical disequilibrium; a similar DHREE pattern was displayed by amphibole type 2 (REE-poor) in corona with respect to REE-rich garnet rim (lobes). This fact already emerged from the DHREE values out of equilibrium for zircon and orthopyroxene normalized to REE-rich garnet lobes in the studied samples. Patterns of DREE for amphibole in matrix–garnet core and amphibole type 1 (REE-rich) of corona – REE-poor garnet bights – display similar trends interpreted as representative of approaching equilibrium conditions. The possible equilibrium conditions between amphibole and garnet are demonstrated by the range of DHREE values shown in Table 10 (highlighted in bold) and mostly by the trend of DHREE tending to rise towards Lu (Fig. 13).
7. Conclusions
The present paper can help to: (1) evaluate the role of amphibole in the control of HREE abundances in competitors such as garnet, zircon and orthopyroxene; (2) define the REE partition among garnet, zircon, orthopyroxene and amphibole in the considered chemical systems monitoring the timing through U–Pb zircon ages; (3) explain the different distribution of REE along the present rim of reabsorbed garnets showing lobes and bights; (4) give further information about the chemical equilibrium of zircon–garnet and orthopyroxene–garnet; and (5) explore the possibility of defining equilibrium amphibole–garnet under granulite-facies conditions.
(1) Under granulite-facies conditions, amphibole sequestrates abundant MREE and HREE (Skublov & Drugova, Reference Skublov and Drugova2003; Storkey et al. Reference Storkey, Hermann, Hand and Buick2005; Buick et al. Reference Buick, Hermann, Williams, Gibson and Rubatto2006) causing depletion of REE contents in coexisting competitors (garnet, zircon and orthopyroxene), evident from the comparison of mineral compositions from amphibole-free granulites with amphibole-bearing granulites having a similar budget of REEs.
(2) During decompression, the porphyroblastic garnet underwent dissolution as evidenced by symplectitic corona formed by plagioclase, orthopyroxene, biotite and amphibole. The REE distribution along the reabsorbed garnet rim seems to reflect both the intra-crystalline diffusion with slow dissolution rate, resulting in REE-rich domains recorded by lobes, and the inter-crystalline diffusion with fast dissolution, probably assisted by fluids, producing the REE-poor bights.
(3) Steep patterns of DHREEzrn/grt are suggestive of approached equilibrium for zircons dated at 339–320 Ma (Fornelli et al. Reference Fornelli, Langone, Micheletti, Pascazio and Piccarreta2014) up to 303 Ma with core or outer core garnet. Subsequently, when consumption of the original rim of garnet started (at c. 300–298 Ma), conditions far from equilibrium existed and REE-rich lobes of garnet formed. During the final stage of decompression under an increasing geothermal gradient, a new equilibrium was restored between zircon dated 278 Ma and REE-poor bights of garnet.
(4) DHREEopx/grt values show a wide variation, assuming that values are indicative of equilibrium for some elements when orthopyroxene from matrix and garnet core were considered or orthopyroxene from corona was normalized to REE-depleted garnet bights. The calculated DHREEopx/grt values for the combinations of orthopyroxene in corona and REE-rich garnet lobes are far from equilibrium.
(5) Different REE patterns of amphibole are present in the amphibole-bearing sample: (a) amphibole included in garnet and that in corona near the lobes of garnet shows strong depletion from Dy to Lu; and (b) amphibole from matrix and that of corona near bights of garnet displays quite flat HREE patterns with a slight enrichment in MREE. A chemical disequilibrium was inferred between lobes of garnet–zircon and –orthopyroxene from corona, so it is possible that even HREE-poor amphibole of corona was not equilibrated with lobes of garnet. On this basis, the DHREEamph/grt values obtained between amphibole of matrix–garnet core and amphibole from corona near the bights of garnet and REE-poor garnet rim (composition of bights) are assumed to be indicative of equilibrium conditions (DREEs in bold in Table 10). Generally, these values are >1 from Gd to Er (4.58–1.24) and <1 from Tm to Lu (0.85–0.34), even if Damph/grt of Dy, Ho and Er can have values within the range 0.60–0.94.
Acknowledgements
We are grateful to P. Acquafredda for assistance with SEM facilities. We thank two anonymous referees for their valuable suggestions improving the manuscript. The editor Chad Deering is thanked for editorial assistance. The research was financially supported by MIUR and ‘Aldo Moro’ University of Bari (Italy).
Supplementary material
To view supplementary material for this article, please visit https://doi.org/10.1017/S001675681700067X.