1. Introduction
The convective flows beneath the liquid–gas interface are important for many geophysical applications (Stommel Reference Stommel1962), since they affect the interfacial heat and mass transfer. In industrial applications, near-surface convection plays a positive role when it is required to enhance mixing for more uniform heating or cooling (e.g. in glass production), but also it can be undesired, for example, in polymerization processes or in fabrication of Langmuir–Blodgett films. When non-uniform heating or cooling is supplied along one of the horizontal boundaries of the liquid layer, horizontal natural convection develops (Rossby Reference Rossby1965; Hughes & Griffiths Reference Hughes and Griffiths2008). Most studies consider differential heating of the bottom boundary (Mullarney, Griffiths & Hughes Reference Mullarney, Griffiths and Hughes2004; Wang & Huang Reference Wang and Huang2005; Sanmiguel Vila et al. Reference Sanmiguel Vila, Discetti, Carlomagno, Astarita and Ianiro2016; Shishkina Reference Shishkina2017; Yan, Shishkina & He Reference Yan, Shishkina and He2021), which results in unstable vertical stratification and horizontal convective flow accompanied by buoyant convection. However, the flow can also be driven by non-uniform heating of the liquid free surface or the top wall of the cavity (Kurosaki et al. Reference Kurosaki, Satoh, Horiuchi and Kashiwagi1989; hlin et al. Reference Ẇhlin, Johansson, Aas, Broström, Weber and Grue2016; Vinnichenko et al. Reference Vinnichenko, Pushtaev, Plaksina, Rudenko and Uvarov2018b; Noto et al. Reference Noto, Terada, Yanagisawa, Miyagoshi and Tasaka2021) or by non-uniform cooling of the bottom (Mori & Niino Reference Mori and Niino2002). In these cases the vertical stratification is stable and the liquid flows only due to the horizontal pressure gradient related to the horizontal temperature difference. Then, analysis of the pressure field becomes important. In experiments the surface pressure field can be obtained from the surface relief measurements. It should be noted that many studies, devoted to horizontal convection in liquid heated from above, are motivated by applications in glass production, hence, liquids with very large Prandtl numbers are often considered (Chiu-Webster, Hinch & Lister Reference Chiu-Webster, Hinch and Lister2008; Daniels Reference Daniels2010; Pigeonneau & Flesselles Reference Pigeonneau and Flesselles2012; Ramme & Hansen Reference Ramme and Hansen2019). Also, it should be noted that in many studies with a non-uniformly heated top boundary the steady state of the flow is investigated, in which the heating is balanced by the heat losses to the environment through the same horizontal boundary. In this configuration there are flow regions with stable and unstable vertical stratification, as in the case of a non-uniformly heated bottom, despite the fact that the heating is supplied through the top boundary.
In this paper we consider the flow driven by a line heat source located at the liquid free surface. A convective plume from a line heat source in an unbounded domain is considered in many studies (Fujii Reference Fujii1963; Gebhart, Pera & Schorr Reference Gebhart, Pera and Schorr1970; Liñán & Kurdyumov Reference Liñán and Kurdyumov1998), since it is the far-field approximation of a typical configuration for natural convection cooling of electric cables and pipelines with heated liquids. Vast literature on the heat transfer from horizontal cylinders is reviewed by Boetcher (Reference Boetcher2014). Pressure variations can be neglected for convection above a line heat source in an unbounded domain, which enables one to construct similarity solutions in boundary layer approximation. However, these solutions become inapplicable when the heat source approaches the free liquid surface. Similar solutions can also be constructed for the boundary layer (wall jet), formed by a jet, impinging on a flat plate (Glauert Reference Glauert1956; Phares, Smedley & Flagan Reference Phares, Smedley and Flagan2000). In this case, the velocity field is decoupled from the temperature field and the horizontal pressure gradient is formed only due to the deceleration of the vertical flow. A boundary layer formed by the convective plume from a line heat source located below the liquid surface presents a challenging problem, in which the pressure gradient due to temperature perturbation must be taken into account. As shown in the present paper, the similarity solution can still be constructed for a line heat source located at the surface.
Recent studies of the near-surface convection have shown a significant difference in the flow structure in distilled water and ethanol or silicone oil (Vinnichenko, Uvarov & Plaksina Reference Vinnichenko, Uvarov and Plaksina2014; Vinnichenko et al. Reference Vinnichenko, Plaksina, Baranova, Pushtaev and Uvarov2018a,Reference Vinnichenko, Pushtaev, Plaksina, Rudenko and Uvarovb, Reference Vinnichenko, Pushtaev, Plaksina and Uvarov2020). Thermocapillary convection is not observed in distilled water. Instead, water surface behaviour after the impact with the convective plume corresponds to a no-slip boundary condition (Vinnichenko et al. Reference Vinnichenko, Uvarov and Plaksina2014). Influence of different surface mobility in water and other liquids was observed for near-surface thermal patterns in an evaporating liquid (Berg, Boudart & Acrivos Reference Berg, Boudart and Acrivos1966), for the rising bubbles velocity (Pawliszak et al. Reference Pawliszak, Ulaganathan, Bradshaw-Hajek, Manica, Beattie and Krasowska2019) and for propagation of the capillary waves (Earnshaw Reference Earnshaw1997). Thermal patterns, observed at the surface of evaporating water using infrared cameras, are known to be very sensitive to purification degree (Saylor, Smith & Flack Reference Saylor, Smith and Flack2001; Plaksina et al. Reference Plaksina, Pushtaev, Vinnichenko and Uvarov2018). Small moving cells are observed in ultrapure deionized water, whereas distilled or tap water surfaces appear to be stagnant with large cells. Anomalous behaviour of the distilled water surface is thus attributed to the influence of surfactants present in very low concentration even in distilled water (Plaksina et al. Reference Plaksina, Uvarov, Vinnichenko and Lapshin2012) and forming a kind of elastic surface film, which does not prevent evaporation, but inhibits the surface renewal (Vinnichenko et al. Reference Vinnichenko, Plaksina, Baranova, Pushtaev and Uvarov2018a). This hypothesis was first proposed by Frumkin and Levich (Lohse & Zhang Reference Lohse and Zhang2020) as an alternative to the surface viscosity concept proposed by Boussinesq. A surface film is also observed in glycerol or paraffin, but in other liquids (e.g. silicone oil, ethanol, other alcohols) such films are not formed and the surface behaviour corresponds to a tangential-stress condition, which describes thermocapillary convection. The no-slip condition, imposed by the surface film in distilled water, results in the same boundary layer structure as in a liquid with non-uniform heating supplied through the solid top wall. The results can also be compared with the case of a differentially heated bottom.
For the low values of heating power, used in our experiments, the convective flow is laminar and essentially two-dimensional. Absence of swaying and meandering – the flow instabilities, observed for convective plumes above a heated horizontal cylinder (Kuehner, Hamed & Mitchell Reference Kuehner, Hamed and Mitchell2015) or above a differentially heated bottom (Reiter & Shishkina Reference Reiter and Shishkina2020) for intense heating – is monitored using infrared (IR) thermography of the surface. Interesting discussions about whether the horizontal convection flow becomes truly turbulent with an increase of the Rayleigh number or not (Paparella & Young Reference Paparella and Young2002; Scotti & White Reference Scotti and White2011; Gayen, Griffiths & Hughes Reference Gayen, Griffiths and Hughes2014) is beyond the scope of the present study.
The paper is organized as follows. In § 2 the problem formulation is presented. In § 3 a new similarity solution is derived and Nusselt number for horizontal convection is estimated in § 4. Numerical simulation is described in § 5. Experimental techniques, employed to measure the velocity, surface temperature and surface relief fields, are explained in § 6. Experimental and numerical results are presented and discussed in § 7. The findings of the present study are summarized in § 8.
2. Problem formulation
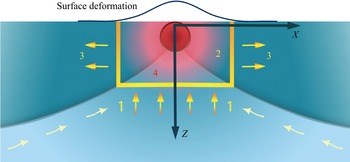
A liquid layer with a line heat source located at the surface is considered (figure 1). The coordinate system  $XZ$ has the origin at the heat source location, the vertical axis
 $Z$ is directed downwards. Similar to an impinging jet, three flow regions can be identified: a stagnation region near the heat source, a boundary layer which is formed along the surface and the entrained flow region located below the boundary layer.
Flow configuration:  $1$ – entrained flow region,
 $2$ – stagnation region,
 $3$ – boundary layer,
 $4$ – line heat source.

The flow is described by two-dimensional (2-D) Navier–Stokes equations in the Boussinesq approximation
 $$\begin{gather} \displaystyle\frac{\partial V_i}{\partial X_i}=0, \end{gather}$$
 $$\begin{gather}\displaystyle\rho\left(\frac{\partial V_i}{\partial \tilde{t}}+V_j\frac{\partial V_i}{\partial X_j}\right) ={-}\frac{\partial P}{\partial X_i}+\frac{\partial}{\partial X_j}\left[\eta \left(\frac{\partial V_i}{\partial X_j}+\frac{\partial V_j}{\partial X_i} \right) \right]+\rho g_i, \end{gather}$$
 $$\begin{gather}\displaystyle \rho c_p \left( \frac{\partial\theta}{\partial\tilde{t}}+V_i\frac{\partial\theta}{\partial X_i} \right)=\frac{\partial}{\partial X_i}\left(\lambda \frac{\partial \theta}{\partial X_i} \right). \end{gather}$$
Here  $\rho$,
 $P$,
 $\theta$ and
 $V_{1,2}$ denote, respectively, density, pressure, temperature and the velocity components,
 $X_{1,2}$ are the vertical and horizontal coordinates,
 $\tilde {t}$ is time,
 $\eta$,
 $\lambda$ and
 $c_p$ are, respectively, dynamic viscosity, thermal conductivity and specific heat of the liquid,
 $g$ is the acceleration of gravity. Initially the liquid is at rest and has uniform temperature
 $20\,^{\circ }\mbox {C}$. In numerical simulations to be compared with experimental results temperature dependences of
 $\rho$,
 $c_p$,
 $\lambda$,
 $\eta$ are taken into account using the empirical correlations given in Vinnichenko et al. (Reference Vinnichenko, Pushtaev, Plaksina, Rudenko and Uvarov2018b). A no-slip boundary condition is imposed at all the boundaries, including the liquid surface, which corresponds to the influence of the surface film. The heat source located at the surface is simulated using the constant heat flux specified at the liquid surface for
 $|X| \leqslant 0.7$ mm. Preliminary simulations, performed with different values of the heated region width, demonstrate that the far-field flow behaviour remains the same. However, the peak temperature value depends strongly on the heated region width. Hence, the width of the heated region is determined by the comparison of the simulation results with IR thermography data. The rest of the liquid surface and the side walls are assumed adiabatic, whereas the bottom wall is isothermal. This corresponds to unsteady flow development after the heating is initiated. For comparison with the proposed similarity solution, which is constructed for a laterally unbounded liquid layer, simulations are also performed for the liquid with constant properties and with free boundaries specified instead of the side walls,
 \begin{equation} \displaystyle \frac{\partial V_X}{\partial X}=\frac{\partial V_Z}{\partial X}=\frac{\partial \theta}{\partial X}=0. \end{equation}
The surface deformation is described by
 \begin{equation} p_{air}-p+\rho gh-\sigma\frac{\partial^{2} h}{\partial X^{2}}+2\eta\frac{\partial V_Z}{\partial Z}=0, \end{equation}
where  $\sigma$ is the surface tension and
 $p_{air}$ is atmospheric pressure. Equation (2.5) is solved with respect to the surface elevation
 $h$. Boundary condition
 $h=0$ is imposed at the side boundaries, since the moon-glade background oriented Schlieren (MG BOS) technique, employed in experiments, is sensitive to the slope of the liquid surface and does not measure variations of the mean liquid level. The observed liquid surface deformation is small compared with the liquid layer depth
 $H$ and its influence upon the velocity field can be neglected, since the Galileo number
 $Ga=gH^{3}/(\nu \chi )$, where
 $\nu$ is kinematic viscosity and
 $\chi$ is thermal diffusivity, is large and the crispation number
 $Cr=\eta \chi /(\sigma H)$ is small (Nepomnyashchy, Velarde & Colinet Reference Nepomnyashchy, Velarde and Colinet2001).
3. Similarity solution
The similarity solution is constructed for a 2-D laminar boundary layer in a laterally unbounded domain. Temporal dependencies of the horizontal and vertical length scales of the transient flow were derived by Mori & Niino (Reference Mori and Niino2002) for horizontal convection driven by a sudden decrease of temperature at half of the bottom wall. In contrast, a steady state of the flow within a finite measurement region around the heat source is assumed in the present study. In experiments this corresponds to a time period, when the unsteady perturbations have already left the measurement region in the central part of the tank, but the heat losses to the environment can still be neglected.
Boundary layer equations are written in dimensionless form
 \begin{equation} \left. \begin{gathered} \displaystyle \frac{\partial v_x}{\partial x}+\frac{\partial v_z}{\partial z}=0,\\ \displaystyle \frac{1}{Pr}\left( v_x\frac{\partial v_x}{\partial x}+v_z\frac{\partial v_x}{\partial z} \right)={-}\frac{\partial p}{\partial x}+\frac{\partial^{2} v_x}{\partial z^{2}}, \\ \displaystyle 0={-}\frac{\partial p}{\partial z}-RaT, \\ \displaystyle v_x\frac{\partial T}{\partial x}+v_z\frac{\partial T}{\partial z} = \frac{\partial^{2} T}{\partial z^{2}}. \end{gathered}\right\} \end{equation}
Spatial coordinates, time, the velocity components, pressure and temperature perturbations are made dimensionless with  $l$,
 $l^{2}/\chi$,
 $\chi /l$,
 $\eta \chi /l^{2}$ and
 $q/\lambda$, respectively. Here
 $q$ is the heating power per unit length,
 $l$ is the characteristic length, which will be defined below;
 $Pr=\eta c_p/\lambda$ is the Prandtl number and
 $Ra={\rho g \beta q l^{3}}/{\eta \chi \lambda }$ is the Rayleigh number,
 $\beta$ is the thermal expansion coefficient. Liquid properties, except for density, are assumed constant. Note that the
 $z$-momentum equation, which contains the transverse pressure gradient related to buoyancy, is not omitted. Pressure is eliminated by subtracting the
 $z$-momentum equation, differentiated with respect to
 $x$, from the
 $x$-momentum equation, differentiated with respect to
 $z$,
 \begin{equation} \frac{1}{Pr} \frac{\partial}{\partial z} \left( v_x \frac{\partial v_x}{\partial x}+v_z\frac{\partial v_x}{\partial z} \right)-\frac{\partial^{3}}{\partial z^{3}}v_x=Ra\frac{\partial T}{\partial x}. \end{equation}
To satisfy the continuity equation, the streamfunction  $\psi (x,z)$ is introduced,
 \begin{equation} v_x=\frac{\partial \psi}{\partial z},\quad v_z={-}\frac{\partial \psi}{\partial x}, \end{equation}
and the similarity solution is sought in the form
 \begin{equation} \psi(x, z)=x^{a}f(z^{b} x^{c}), \quad T(x,z)=x^{d}\phi(z^{b} x^{c}). \end{equation}
Equations (3.4a,b) are substituted into (3.2) and into the energy equation from (3.1). Taking into account the boundary conditions at the surface and the fact that the energy convected across any vertical plane in the boundary layer does not depend on  $x$, the exponents in (3.4a,b) are uniquely determined as
 \begin{equation} a=1/2, \quad b=1, \quad c ={-}1/2, \quad d={-}1/2. \end{equation}
Since the problem formulation does not contain any specific spatial scale, it is convenient to define the characteristic length  $l$ so that
 $Ra = 1$, that is,
 \begin{equation} l=\sqrt[3]{\frac{\eta\chi\lambda}{\rho g \beta q}}. \end{equation}
Then  $Pr$ becomes the only parameter remaining in (3.1). Similarity solutions, obtained for the temperature and velocity distributions, are
 \begin{equation} \left.\begin{gathered} \displaystyle T(x,z) = \frac{\phi(\xi)}{\sqrt{x}}, \\ \displaystyle v_x(x,z)=f'(\xi), \\ \displaystyle v_z(x, z)=\frac{f'(\xi)\xi-f(\xi)}{2\sqrt{x}}, \end{gathered}\right\} \end{equation}
where  $\xi ={z}/{\sqrt {x}}$ is the similarity variable. Note that the expressions for the similarity variable and the velocity components are essentially the same as for the laminar boundary layer along a flat plate (Schlichting & Gersten Reference Schlichting and Gersten2017). However, the velocity and temperature fields are coupled.
Ordinary differential equations, obtained for  $f(\xi )$ and
 $\phi (\xi )$,
 \begin{equation} \left.\begin{gathered} \displaystyle 2\phi''+(f\phi)'=0, \\ \displaystyle \frac{(ff'')'}{Pr}+2f^{(iv)}-\phi-\xi\phi'=0, \end{gathered}\right\} \end{equation}
can be integrated, taking into account the boundary conditions  $f(0)=f^{\prime }(0)=\phi ^{\prime }(0)=0$. Integration leads to
 \begin{equation} \left.\begin{gathered} \displaystyle \phi^{\prime}={-}\frac{f\phi}{2}, \\ \displaystyle f^{\prime\prime\prime}=\frac{\xi\phi}{2}-\frac{ff^{\prime\prime}}{2Pr}-C. \end{gathered}\right\} \end{equation}
The latter equation, substituted into the  $x$-momentum equation in (3.1), yields
 \begin{equation} \displaystyle \frac{\partial p}{\partial x}=\frac{\xi\phi}{2x}-\frac{C}{x}. \end{equation}
Thus, the unknown constant  $C$ determines the pressure gradient at the surface. The boundary layer region extends from the liquid surface (
 $\xi =0$) to the point
 $\xi =\xi _{max}$, where the horizontal velocity vanishes. Equations (3.9) require two more boundary conditions:
 $f^{\prime \prime }(0)$ and
 $\phi (0)$ must be known to solve the Cauchy problem. The solution for unknown
 $\phi (0)$ can be obtained from the solution for
 $\phi (0)=1$ using the heat flow normalization procedure similar to that proposed by Gebhart et al. (Reference Gebhart, Pera and Schorr1970) for the convective plume. In the steady state the heat convected across any vertical plane within the boundary layer must be equal to half of the heat produced by the source, i.e. with the adopted normalizations
 \begin{equation} \int_0^{z_{max}}v_xT\,\mathrm{d} z = \int_0^{\xi_{max}} f^{\prime}\phi \,\mathrm{d} \xi=\tfrac{1}{2}, \end{equation}
where  $z_{max}=\xi _{max}\sqrt {x}$.
If the value of this integral, calculated for the solution with  $\phi (0)=1$ (denoted as
 $f_n$,
 $\phi _n$,
 $\xi _n$,
 $C_n$), is
 $I/2$, then after transformation
 \begin{equation} \displaystyle f=\frac{f_n}{I^{{1}/{6}}}, \quad \phi=\frac{\phi_n}{I^{{5}/{6}}}, \quad \xi=\xi_nI^{{1}/{6}}, \quad C=\frac{C_n}{I^{{2}/{3}}}. \end{equation}
Here  $f(\xi )$ and
 $\phi (\xi )$ still satisfy the equations (3.9) and the boundary conditions, and the integral (3.11) becomes equal to
 $1/2$. Thus, two unknown parameters remain:
 $f^{\prime \prime }(0)$ and the constant
 $C$. Their values are determined by the shooting method. The required boundary conditions at
 $\xi =\xi _{max}$ are obtained from consideration of the flow in the part of the stagnation region located below the boundary layer (region 2 in figure 1).
It follows from the  $z$-momentum equation in (3.1) that the pressure drop across the boundary layer does not depend on
 $x$,
 \begin{equation} \varDelta p_1={-}\int_0^{z_{max}} T \, \mathrm{d} z={-}\int_0^{\xi_{max}}\phi \, \mathrm{d} \xi={\rm const}. \end{equation}
Therefore, the pressure variation along the surface is determined by the pressure drop in stagnation region below the boundary layer. Velocity is small in this region. Hence, as in the boundary layer
 \begin{equation} \displaystyle \frac{\partial p}{\partial z} ={-}T. \end{equation}
Neglecting the temperature variation along the horizontal line from the flow centreline  $x=0$ to the edge of the boundary layer,
 \begin{equation} T(z)=\frac{\phi(\xi_{max})}{\sqrt{x}}=\frac{\phi(\xi_{max})}{z}\xi_{max}. \end{equation}
Then, the pressure drop below the boundary layer is
 \begin{equation} \Delta p_2={-}\phi(\xi_{max})\xi_{max}\ln(\xi_{max}\sqrt{x}) \end{equation}
and the pressure gradient at the surface is
 \begin{equation} \left. \displaystyle \frac{\partial p}{\partial x}\right|_{z=0} ={-}\frac{\phi(\xi_{max})\xi_{max}}{2x}. \end{equation}
From the comparison with (3.10) for  $z=0$ (
 $\xi =0$) the constant
 $C$ can be found,
 \begin{equation} C = \frac{\xi_{max}\phi(\xi_{max})}{2}. \end{equation}
The upward flow in the entrained flow region (region 1 in figure 1) and the horizontal flow in the boundary layer (region 3 in figure 1) must be equal,
 \begin{equation} \displaystyle \int_0^{z_{max}}v_x\,\mathrm{d} z ={-}\int_0^{x} v_z\,\mathrm{d}x. \end{equation}
But
 \begin{equation} \displaystyle \int_0^{z_{max}}v_x\,\mathrm{d} z=\sqrt{x}\int_0^{\xi_{max}}f^{\prime}\,\mathrm{d} \xi = \sqrt{x}f(\xi_{max}). \end{equation}
Since the horizontal variation of temperature is neglected in the stagnation region,
 \begin{equation} v_z\frac{\partial T}{\partial z}=\frac{\partial^{2}T}{\partial z^{2}}. \end{equation}
Substituting (3.15) into (3.21), one can obtain the vertical velocity in the stagnation region,
 \begin{equation} v_z={-}\frac{2}{z}. \end{equation}
Hence,
 \begin{equation} \int_0^{x} v_z\,\mathrm{d} x={-}\int_0^{x}\frac{2}{z}\,\mathrm{d} x ={-}\frac{2\sqrt{x}}{\xi_{max}}. \end{equation}
Comparison of (3.20) and (3.23) yields the second condition
 \begin{equation} f(\xi_{max})=\frac{2}{\xi_{max}}. \end{equation}
It is noteworthy that derivation of (3.18) and (3.24) is based on (3.15), which implies that the temperature variation along the horizontal line from the centreline  $x=0$ to the edge of the boundary layer can be neglected. This assumption becomes invalid for small values of Prandtl number (
 $Pr<1$), when the boundary layer becomes more thick. In this case, the parameters
 $f^{\prime \prime }(0)$ and
 $C$ can be determined by comparison of the similarity solution with numerical simulation. To solve the Cauchy problem, the fourth-order Runge–Kutta method is used. Here
 $\xi _{max}$, at which the horizontal velocity
 $v_x=f^{\prime }$ vanishes, is determined from the solution. For
 $Pr=7.16$ (water at
 $20\,^{\circ }\mbox {C}$) and
 $70$, the parameters
 $f^{\prime \prime }(0)$ and
 $C$ are determined by the shooting method using the conditions (3.18) and (3.24). For
 $Pr=0.1$ and
 $0.7$, their values are taken from the numerical simulations. The obtained values of the similarity solution parameters are given in table 1.
Parameters of the similarity solution for various Prandtl numbers. Here  $\xi _0$ is the location of the dimensionless horizontal velocity maximum
 $f^{\prime }_{max}$.

The results for  $Pr=7.16$ and
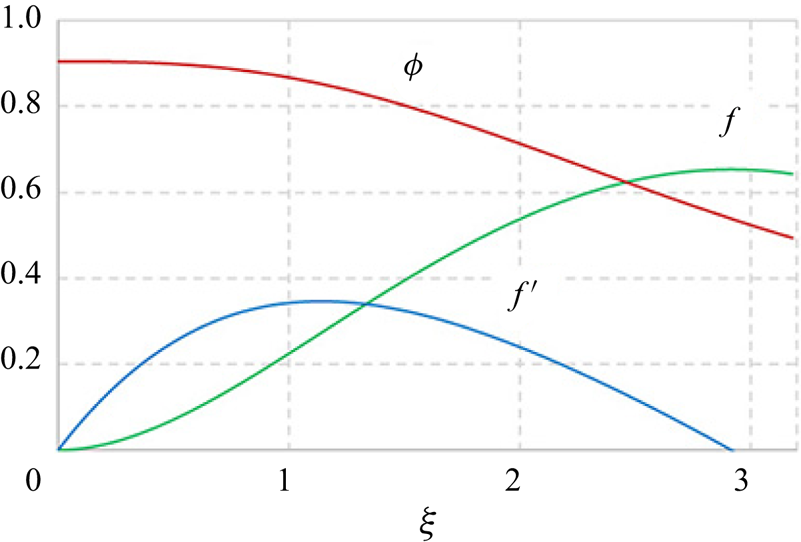
 $70$ demonstrate that for large Prandtl numbers the influence of the nonlinear term in the second equation (3.9) becomes small and the asymptotic solution is reached. The obtained profiles of
 $f(\xi )$,
 $f^{\prime }(\xi )$, and
 $\phi (\xi )$ for
 $Pr=7.16$ are shown in figure 2.
Computed profiles of  $f(\xi )$,
 $f^{\prime }(\xi )$ and
 $\phi (\xi )$ for
 $Pr=7.16$.

From the similarity solution, it is also possible to obtain the expressions for the maximal dimensional velocity and the boundary layer thickness  $V_{X\ max}(q)$ and
 $Z_{max}(X,q)$,
 $$\begin{gather} V_{X \ max}(q)=f^{\prime}_{max}\sqrt[3]{\frac{\rho \chi^{2} g\beta}{\eta\lambda} q}\sim q^{{1}/{3}}, \end{gather}$$
 $$\begin{gather}Z_{max}(X, q) = \xi_{max}\sqrt{X}\sqrt[6]{\frac{\eta\chi\lambda}{\rho g \beta q}} \sim q^{-{1}/{6}}. \end{gather}$$
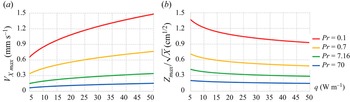
Thus, the maximal velocity is determined by the liquid properties and the heating power. Figure 3 presents the dependencies of  $V_{X \ max}$ and
 $Z_{max}/\sqrt {X}$ on the heating power.
Plots of (a)  $V_{X\ max}$, (b)
 $Z_{max}/\sqrt {X}$ as functions of the heating power for
 $Pr=0.1$,
 $0.7$,
 $7.16$,
 $70$.

It is interesting that the same scaling (boundary layer thickness  $\sim q^{-1/6}$, velocity
 $\sim q^{1/3}$) was obtained by Mullarney et al. (Reference Mullarney, Griffiths and Hughes2004) for horizontal convection, driven by differential heating of the bottom wall. For the laterally unbounded domain, the local horizontal Rayleigh number
 $Ra_X$, based on the distance from the heat source
 $X$, is defined as
 \begin{equation} Ra_X=\frac{\rho g \beta q X^{3}}{\eta \chi \lambda}. \end{equation}
However, to compare the results with Mullarney et al. (Reference Mullarney, Griffiths and Hughes2004), who considered horizontal convection in a tank with finite width  $L$,
 $X=L$ is used as a representative value. In our experiments, the horizontal Rayleigh number
 $Ra_L$, based on the tank width
 $L=12.3\ \mbox {cm}$, is
 $1.4\times 10^{9}$ for
 $q=31\ \textrm {W}\ \textrm {m}^{-1}$ and
 $2.7\times 10^{9}$ for
 $q=62\ \textrm {W}\ \textrm {m}^{-1}$, respectively. The thickness of the boundary layer
 $Z_{max}$ at
 $X = L$ is denoted by
 $b$. Thus,
 \begin{equation} \xi_{max}=\frac{b}{\sqrt{L}}. \end{equation}
Using the vertical profiles of temperature and horizontal velocity, measured experimentally, Mullarney et al. (Reference Mullarney, Griffiths and Hughes2004) obtained
 \begin{equation} \left.\begin{gathered} \displaystyle \frac{b}{L}=2.649Ra_F^{{-}1/6}, \\ \displaystyle \frac{V_X L}{\chi}=0.45525Ra_F^{1/3}, \end{gathered}\right\} \end{equation}
where  $Ra_F$ is the Rayleigh number, based on the heat flux and the tank width. For the similarity solution, constructed in the present study, (3.25), (3.26) yield
 \begin{equation} \left.\begin{gathered} \displaystyle \frac{b}{\sqrt{L}}=\xi_{max}\sqrt[6]{\frac{\eta\chi\lambda}{\rho g \beta q}}, \quad \mbox{i.e.} \quad \frac{b}{L}=\xi_{max}Ra_L^{{-}1/6}, \\ \displaystyle V_{X\ max}(q)=f^{\prime}_{max}\sqrt[3]{\frac{\chi^{2}g\beta q}{\nu\lambda}},\quad \mbox{i.e.} \quad \frac{V_{X max}L}{\chi}=f^{\prime}_{max}Ra_L^{1/3}. \end{gathered}\right\} \end{equation}
Values of  $\xi _{max}$ and
 $f^{\prime }_{max}$ for various
 $Pr$ can be found in table 1. For
 $Pr=7.16$, they are equal to
 $2.9152$ and
 $0.3463$, respectively.
4. Nusselt number
Several definitions of Nusselt number can be used to characterize the strength of horizontal convection (Mullarney et al. Reference Mullarney, Griffiths and Hughes2004; Siggers, Kerswell & Balmforth Reference Siggers, Kerswell and Balmforth2004; Rocha et al. Reference Rocha, Bossy, Llewellyn Smith and Young2020a,Reference Rocha, Constantinou, Llewellyn Smith and Youngb). Taking into account the symmetry of the flow and the fact that the heat is transported only within the boundary layer (according to (3.21), the advective and conductive heat fluxes balance each other in the stagnation region), the local Nusselt number at dimensionless distance  $r$ from the heat source can be defined as
 \begin{equation} Nu_{loc}(r)=\frac{\displaystyle q/2}{\lambda\Delta \theta}\frac{\displaystyle {\rm \pi}/2}{\varphi_{max}}= \frac{\rm \pi}{4T\varphi_{max}}, \end{equation}
where  $\varphi _{max}$ is the polar angle value, which corresponds to the edge of the boundary layer
 \begin{equation} \xi_{max}=\frac{z_{max}}{\sqrt{x}}=\sqrt{r}\frac{\sin \varphi_{max}}{\sqrt{\cos \varphi_{max}}}. \end{equation}
For large  $r$, the angle is small,
 \begin{equation} \varphi_{max}=\frac{\xi_{max}}{\sqrt{r}} \end{equation}
and  $x\approx r$.
Using the similarity solution (3.7) for temperature perturbation,
 \begin{equation} Nu_{loc}(r)=\frac{{\rm \pi} r}{4\phi (0) \xi_{max}}. \end{equation}
For the length of the boundary layer  $X$,
 \begin{equation} Nu_{loc}=\frac{{\rm \pi} X}{4\phi (0) \xi_{max}l}=\frac{{\rm \pi} X}{4\phi (0) \xi_{max}}\sqrt[3]{\frac{\rho g \beta q}{\eta\chi\lambda}}=\frac{\rm \pi}{4\phi (0) \xi_{max}}Ra^{1/3}_X\approx 0.3 Ra_X^{1/3}. \end{equation}
Also, the local Nusselt number can be defined, as in Rocha et al. (Reference Rocha, Constantinou, Llewellyn Smith and Young2020b), as the ratio of the heat transported by the convective flow through the surface, located at dimensionless distance  $r$ from the heat source, to the heat transported in stagnant liquid. Note that in the present study the power of the heat source is specified, whereas the temperature distribution at the top surface was prescribed in Rocha et al. (Reference Rocha, Constantinou, Llewellyn Smith and Young2020b). Hence, the heat transported in stagnant liquid should be evaluated only within the boundary layer and with the actual temperature distribution, expressed by the similarity solution (3.7). Thus,
 \begin{equation} \displaystyle Nu_{loc}(r)=\frac{q/2}{\displaystyle \lambda \int_{0}^{\varphi_{max}} (\partial \theta/\partial r)r\,\mathrm{d} \varphi}=\frac{1}{\displaystyle 2\int_{0}^{\varphi_{max}}(\partial T/ \partial r)r\,\mathrm{d} \varphi}. \end{equation}
From the similarity solution,
 \begin{align} r\frac{\partial T}{\partial r} = r\frac{\partial}{\partial r} \left( \frac{\phi(\xi)}{\sqrt{r\cos \varphi}} \right)=\frac{\phi^{\prime}(\xi (r, \varphi))r\sin \varphi-\phi (\xi (r, \varphi))\sqrt{r}\cos \varphi}{2r(\cos \varphi)^{3/2}}\approx \frac{\phi^{\prime}(\xi)\varphi}{2}-\frac{\phi(\xi)}{2\sqrt{r}}. \end{align}
Numerical integration leads to
 \begin{equation} Nu_{loc}=A_1 Ra_X^{1/3}, \end{equation}
where  $A_1=0.3312$,
 $0.3165$,
 $0.3167$,
 $0.2894$ for
 $Pr=0.1$,
 $0.7$,
 $7.16$,
 $70$, respectively. For horizontal convection in a tank with width
 $L$, driven by a prescribed temperature profile at the top wall, Rocha et al. (Reference Rocha, Bossy, Llewellyn Smith and Young2020a) obtained the bound
 \begin{equation} Nu_{loc} < 0.0525 Ra_L^{1/3}, \end{equation}
which is in qualitative agreement with (4.5) and (4.8). The total Nusselt number can be defined, similar to Mullarney et al. (Reference Mullarney, Griffiths and Hughes2004), as the ratio of the total heat, transported by convective flow, to the heat transported in stagnant liquid with the same temperature distribution,
 \begin{equation} Nu_{tot}=\frac{\rho c_p V_X b \Delta\theta}{\lambda\Delta\theta}=\frac{V_X b}{\chi}. \end{equation}
 \begin{equation} Nu_{tot}=f^{\prime}_{max}\xi_{max}\sqrt{\displaystyle \frac{L}{l}}=A_2Ra_L^{1/6}, \end{equation}
where  $A_2=0.8234$,
 $0.8136$,
 $1.0095$,
 $0.9234$ for
 $Pr=0.1$,
 $0.7$,
 $7.16$,
 $70$, respectively. The total Nusselt number
 $Nu_{tot}=0.81587 Ra_L^{1/6}$ was experimentally obtained by Mullarney et al. (Reference Mullarney, Griffiths and Hughes2004) for horizontal convection in a tank with a non-uniformly heated bottom wall. Thus, despite the different flow configurations, not only the scaling exponents but also the proportionality coefficients appear to be similar, which demonstrates universality of the horizontal convection driven by the horizontal pressure gradient. In § 7 a comparison of the constructed similarity solution with experimental data and the numerical simulation results is performed.
5. Numerical modelling
Equations (2.1)–(2.3) with boundary conditions, described in § 2, are solved numerically using the second-order semi-implicit scheme with the third-order Runge–Kutta method for convective terms and the Crank–Nicolson method for diffusion terms. The fractional-step method is used to find the velocity and pressure corrections in order to satisfy the continuity equation. Spatial discretization involves central differences for diffusion terms and four-points upwind differences for convective ones. Since the free surface deformation is small, a no-slip boundary condition, representing the influence of the surface film, is imposed at the top horizontal boundary, which coincides with the initial position of the deformable free surface. The surface deformation is obtained by solving (2.5) at each time step. Simulations are performed on a staggered grid with the grid step increasing from the heat source to the bottom and side walls of the tank. The same code was used by Vinnichenko et al. (Reference Vinnichenko, Uvarov and Plaksina2014) and by Vinnichenko et al. (Reference Vinnichenko, Pushtaev, Plaksina, Rudenko and Uvarov2018b) for simulations of similar flows: convective plume from a horizontal heated wire and horizontal convection driven by non-uniform radiative heating of the liquid free surface. In Vinnichenko et al. (Reference Vinnichenko, Pushtaev, Plaksina, Rudenko and Uvarov2018b) verification of the code was performed for a related problem – convection of fluid with  $Pr=1000$ in a rectangular cavity with no-slip walls and a sinusoidal temperature profile, prescribed at the top boundary, which was considered by Pigeonneau & Flesselles (Reference Pigeonneau and Flesselles2012). According to the results of these earlier studies and the grid convergence study, which involved simulations using three different meshes with minimal grid step
 $49$,
 $37$ and
 $25\ \mathrm {\mu }\textrm {m}$,
 $100 \times 100$ grid with minimal grid step
 $25\ \mathrm {\mu }\textrm {m}$ is chosen for simulations. Computational domain size
 $123 \times 25$ mm corresponds to the tank width and liquid layer depth in the performed experiments. Simulations for verification of the proposed similarity solution are performed using a larger domain
 $246 \times 50$ mm with boundary conditions (2.4) instead of the side walls. Additional simulations are performed to investigate the influence of the tank width on the flow structure. These results are presented in the supplementary material available at https://doi.org/10.1017/jfm.2022.502.
6. Experimental techniques and procedure
Experiments are performed in a rectangular glass tank with internal dimensions  $123\times 132 \times 65$ mm filled with distilled water to the depth
 $25$ mm. Copel wire with diameter
 $0.2$ mm is installed horizontally at the liquid surface parallel to the longest side of the tank and heated with
 $q=31\ \textrm {W}\ \textrm {m}^{-1}$. Experiments are performed at room temperature about
 $20\,^{\circ }\mbox {C}$ with relative humidity about 40 %. Three experimental techniques are used in separate experimental runs for measurements of the velocity, surface temperature and surface relief instantaneous fields: particle image velocimetry (PIV), IR thermography and MG BOS. Note that the latter technique, which yields surface relief maps, enables one to estimate pressure distribution at the surface using (2.5). Infrared thermography and MG BOS also provide monitoring of the flow uniformity in a direction parallel to the wire. In order to suppress convection driven by evaporation, the tank is covered either with a glass sheet (for PIV and MG BOS) or with a
 $6$ mm ZnSe plate (for IR thermography), which has a transmittance of about
 $0.6$ in the wavelength range
 $1{-}15\ \mathrm {\mu }\textrm {m}$. There is an air gap about 2 cm between the cover and water surface.
6.1. Particle image velocimetry
Velocity fields in the vertical plane  $XZ$ are measured using planar PIV. A light sheet is created by a continuous laser (wavelength
 $532$ nm, power
 $130$ mW), equipped with a cylindrical lens. Laser light enters the liquid through the tank side wall. Liquid is seeded with silver-coated hollow glass spheres with diameter
 $10\unicode{x2013}20\ \mathrm {\mu }\textrm {m}$ and density
 $1200\ \mbox {kg}\ \mbox {m}^{-3}$. The settling velocity of these particles in water is about
 $0.03\ \textrm {mm}\ \textrm {s}^{-1}$. Images with resolution
 $1920\times 1088$ are acquired at
 $25$ f.p.s. with a Canon EOS 700D DSLR camera, equipped with a Canon EF
 $100$ mm
 $f/2.8$ lens. Exposure settings are
 $1/30$ s,
 $f/11$, ISO
 $1600$. The camera field of view is about
 $67 \times 38$ mm and the liquid surface is located in the middle of the frame. Images are processed with multi-pass direct cross-correlation interrogation with discrete window offset. The interval between the frames in a processed image pair is
 $8/25$ s, which results in a maximal displacement of about
 $8$ pix. Two interrogation passes are performed with interrogation windows
 $32\times 32$ and
 $16\times 16$. Interrogation windows overlap (50 % in the horizontal direction and 75 % in the vertical direction) is used at the final pass to improve spatial resolution.
6.2. Infrared thermography of liquid surface
The surface temperature field is measured with an FLIR SC7700-M infrared camera, operating in the wavelength range  $3.7{-}4.8\ \mathrm {\mu }\textrm {m}$ (the average absorption depth in water is about
 $50\ \mathrm {\mu }\textrm {m}$). The image resolution is
 $640\times 512$ and the noise equivalent temperature difference, declared by the manufacturer, is
 $0.025$ K. The camera is installed at an angle of about
 $8^{\circ }$ with respect to the vertical in order to avoid imaging of the camera sensor reflection. The value
 $0.96$ is used for infrared emissivity of the water surface.
6.3. Moon-glade background oriented Schlieren
Surface relief maps are obtained using the MG BOS technique, recently proposed by Vinnichenko et al. (Reference Vinnichenko, Pushtaev, Plaksina and Uvarov2020). A schematic of this technique is presented in figure 4. The camera, installed above the liquid surface, images the reflection of the background pattern (black dots, randomly distributed on a transparent film), backlit with an LED panel. Comparison of the reference image, taken for an undisturbed liquid surface, with the distorted images taken during the flow development is performed using cross-correlation interrogation. The apparent displacement of the background pattern features is proportional to the local slope of the surface. Instantaneous maps of the surface relief perturbation are obtained from the fields of its first spatial derivatives by solving the Poisson equation. The liquid surface is assumed unperturbed far from the heated wire. Images are acquired at 25 f.p.s. with a Canon EOS 700D DSLR camera and Canon EF  $100$ mm
 $f/2.8$ lens. The glass cover of the tank is inclined to avoid imaging of the background pattern reflection from the glass. The background-to-surface distance, which determines the sensitivity of MG BOS, is
 $156$ cm. The incidence angle is
 $8^{\circ }$. Keystone distortion is corrected using the calibration image of a rectangular target, the corners of which determine the coefficients of the projective transform. Images are processed with the same multi-pass direct cross-correlation interrogation used for PIV. Two interrogation passes are performed with interrogation windows
 $32\times 32$ and
 $16\times 16$ with
 $50\,\%$ overlap at the final pass. Heating results in formation of a crest at the heat source location. Its height grows to about
 $5\ \mathrm {\mu }\textrm {m}$ both in MG BOS measurements and numerical simulations.
Principle of the surface deformation measurement using MG BOS.

From the surface relief maps, averaged in the direction parallel to the heated wire, surface pressure distribution can be estimated using (2.5). Numerical simulations show that the vertical velocity gradient is negligible and the surface curvature is important only near the heat source. In fact, the surface tension contribution to (2.5) is less than 1 % of the pressure perturbation for  $|X|>2.3$ mm. Thus, in the far field the surface tension and vertical velocity gradient contributions both can be neglected and the surface elevation profile, measured with MG BOS, can be converted into the surface pressure profile, which is compared with both the numerical simulation and similarity solution (3.10).
7. Results and discussion
Figures 5–8 present the comparison of the horizontal velocity and temperature variation (with respect to the initial value  $20\,^{\circ }\mbox {C}$) fields for the derived similarity solution and numerical simulation for a laterally unbounded liquid (i.e. performed with boundary conditions (2.4)) with Prandtl numbers 0.1, 0.7, 7.16, 70. Thermal conductivity is varied and all the other liquid properties are kept constant. In numerical simulation computations are performed to
 $\tilde {t}=4000\ \mbox {s}$. At this moment the flow is steady for
 $|X|\leqslant 12\ \mbox {cm}$ for all values of Prandtl number. Note that only part of the computational domain is shown in each figure. The peak temperature values near the heat source exceed the shown range (e.g. for
 $Pr=7.16$, the maximal temperature variation is about 37 K). The similarity solution is valid only within the boundary layer, it does not describe the entrained flow. For this reason, the regions outside the boundary layer are filled with black in panels (c,d). In numerical simulation return flow is formed below the boundary layer due to continuity. At low
 $Pr$ the boundary layer becomes more thick and horizontal velocity increases. According to (3.6), the characteristic length
 $l$ is proportional to
 $\lambda ^{2/3}$ and the characteristic velocity scales as
 $\chi /l\sim \lambda ^{1/3}$. Since
 $f^{\prime }_{max}$ and
 $\xi _{max}$ vary for about
 $7\,\%$ and
 $27\,\%$, respectively, for
 $0.1\leqslant Pr\leqslant 70$, it follows from (3.25), (3.26) that the maximal horizontal velocity scales as
 $Pr^{-1/3}$ and the boundary layer thickness is approximately proportional to
 $Pr^{-2/3}$. The discrepancy between the similarity solution and numerical simulation results is larger near the heat source, where the boundary layer approximation is invalid. The width of this region can be estimated from comparison of
 $\partial ^{2} v_x/\partial z^{2}$, which is taken into account in the boundary layer equations (3.1), with
 $\partial ^{2} v_x/\partial x^{2}$, which is neglected. It follows from the similarity solution (3.7) that
 $|\partial ^{2} v_x/\partial x^{2}|\ll |\partial ^{2} v_x/\partial z^{2}|$ if
 $x\gg (z/2\sqrt {x})^{2}=(\xi /2)^{2}$. Table 1 shows that
 $\xi _{max}$ varies from 2.3 to 2.9. Thus, the similarity solution is valid only for
 $x\gg 2$, i.e.
 $X\gg 2 l$. Note that both dimensional and non-dimensional coordinates are presented in figures 5–8. As mentioned above,
 $l$ is proportional to
 $\lambda ^{2/3}$, so
 $l$ is about 1.9, 0.51, 0.11 and 0.02 mm for
 $Pr=0.1$, 0.7, 7.16 and 70, respectively. For
 $X=1$ cm, the maximal relative error between the simulation result and the similarity solution does not exceed 15–20 % for all the cases, except for
 $Pr=0.1$. In this case
 $l$ is large, the boundary layer is extremely thick and the similarity solution becomes valid only for
 $|X|>3$ cm, which corresponds to
 $|x|>16$.
(a,c) Horizontal velocity ( $\textrm {mm}\ \textrm {s}^{-1}$) and (b,d) temperature variation (K) fields obtained by (a,b) numerical simulation and (c,d) similarity solution for
 $Pr=0.1$. Both dimensional (black symbols) and non-dimensional (blue symbols) values are presented.

(a,c) Horizontal velocity ( $\textrm {mm}\ \textrm {s}^{-1}$) and (b,d) temperature variation (K) fields obtained by (a,b) numerical simulation and (c,d) similarity solution for
 $Pr=0.7$. Both dimensional (black symbols) and non-dimensional (blue symbols) values are presented.

(a,c) Horizontal velocity ( $\textrm {mm}\ \textrm {s}^{-1}$) and (b,d) temperature variation (K) fields obtained by (a,b) numerical simulation and (c,d) similarity solution for
 $Pr=7.16$. Both dimensional (black symbols) and non-dimensional (blue symbols) values are presented.

(a,c) Horizontal velocity ( $\textrm {mm}\ \textrm {s}^{-1}$) and (b,d) temperature variation (K) fields obtained by (a,b) numerical simulation and (c,d) similarity solution for
 $Pr=70$. Both dimensional (black symbols) and non-dimensional (blue symbols) values are presented.

The observed discrepancy is partly related to the assumption that temperature is constant along the horizontal line from the flow centreline  $x=0$ to the edge of the boundary layer, which was used to derive the relations (3.18) and (3.24). Figure 9 shows the temperature variation profiles along this line at various depths for
 $Pr=7.16$. The temperature difference between the centreline and the edge of the boundary layer decreases with depth. Even at
 $Z=2$ mm, close to the stagnation point, it is about 0.4 K, which is small compared with the local temperature variation value of about 6 K. In general, reasonable agreement is obtained between the similarity solution and numerical simulation in a wide range of Prandtl numbers, despite several assumptions made during the derivation of the similarity solution. The comparison shows that the constructed similarity solution provides appropriate scaling and correct velocity and temperature distributions in the boundary layer far from the stagnation point.
Horizontal profiles of temperature variation from the flow centreline  $x=0$ to the edge of the boundary layer (solid lines) and within the boundary layer (dashed lines) at various depths, obtained by numerical simulation for
 $Pr=7.16$.

The results, obtained for the liquid with  $Pr=7.16$ with boundary condition
 $\partial V_X/\partial Z=0$ imposed at the surface, are shown in figure 10. In this case the similarity solution is derived solving the equations (3.9) with boundary conditions
 $f(0)=f^{\prime \prime }(0)=\phi ^{\prime }(0)=0$ and using the shooting method to determine the parameters
 $f^{\prime }(0)$ and
 $C$. Note that thermocapillary convection, which takes place in the absence of the surface film, is not taken into account. Thus, this case has no practical importance. However, comparison of the results shown in figures 7 and 10 reveals the effect of the surface film upon the flow structure. Without the film, horizontal velocity reaches maximum at the surface. Horizontal velocity increases and the boundary layer thickness decreases. In this case
 $f^{\prime }_{max}$ and
 $\xi _{max}$ are, respectively, are about 0.5 and 2 – compared with 0.35 and 2.9 for the no-slip condition at the surface. It follows from (3.25) and (3.26) that
 $V_{X \ max}$ is 43 % higher and
 $Z_{max}$ is 31 % lower without the surface film. Thermocapillary convection, which transports liquid along the surface away from the heat source, promotes these trends even further (Vinnichenko et al. Reference Vinnichenko, Uvarov and Plaksina2014, Reference Vinnichenko, Pushtaev, Plaksina, Rudenko and Uvarov2018b).
(a,c) Horizontal velocity ( $\textrm {mm}\ \textrm {s}^{-1}$) and (b,d) temperature variation (K) fields obtained by (a,b) numerical simulation and (c,d) similarity solution for
 $Pr=7.16$ with
 $\partial V_X/\partial Z=0$ at the surface. Both dimensional (black symbols) and non-dimensional (blue symbols) values are presented.

Instantaneous fields of horizontal and vertical velocity components in the tank with distilled water, obtained with numerical simulations (with a no-slip condition at the side walls and taking into account the temperature dependences of water properties) and PIV, are shown in figures 11 and 12. The same flow structure is observed in numerical simulation results and PIV data. Good quantitative agreement is also obtained for the velocity profiles presented in figure 13. Some discrepancy is only found at  $Z<1$ mm, which can be attributed both to insufficient spatial resolution of PIV measurements and possible planar divergence-free motion of the liquid surface, as reported by Vinnichenko et al. (Reference Vinnichenko, Pushtaev, Plaksina, Rudenko and Uvarov2018b) for horizontal convection in distilled water heated by infrared radiation. The obtained results confirm the validity of using the no-slip boundary condition for 2-D simulations of the distilled water surface behaviour.
Horizontal velocity fields ( $\textrm {mm}\ \textrm {s}^{-1}$) obtained by numerical simulation (a) and PIV (b) in distilled water
 $8$,
 $22$,
 $60$ and
 $150$ s after heating is initiated. Both dimensional (black symbols) and non-dimensional (blue symbols) values are presented.

Vertical velocity fields ( $\textrm {mm}\ \textrm {s}^{-1}$) obtained by numerical simulation (a) and PIV (b) in distilled water
 $8$,
 $22$,
 $60$ and
 $150$ s after heating is initiated. Both dimensional (black symbols) and non-dimensional (blue symbols) values are presented.

(a) Vertical profiles of horizontal velocity, averaged over  $1.3\ \textrm {cm}\leqslant X\leqslant 1.7\ \textrm {cm}$, (b) horizontal profiles of vertical velocity, averaged over
 $0.4\ \textrm {cm}\leqslant Z\leqslant 0.6\ \textrm {cm}$,
 $22$ s after heating is initiated.

A detailed comparison of the numerical simulation results for velocity and temperature fields evolution in tanks with different widths and in a laterally unbounded domain is performed in the supplementary material. The presence of side walls has little effect on velocity distribution within the boundary layer at a distance more than 1 cm from the wall. Thus, the constructed similarity solution for an unbounded domain can also be used for the flow in finite-size tanks. The temperature fields for  $\tilde {t}\leqslant 200\ \mbox {s}$, which corresponds to the duration of experimental measurements, are also similar for the finite-size tanks and laterally unbounded domain. However, the thermally equilibrated state, which is reached at
 $\tilde {t}\sim \tilde {t}_{therm}=H^{2}/\chi$, depends on the tank width. In the finite-size tanks the steady state corresponds to the balance between the heating provided by the heat source and the heat removal through the isothermal bottom of the tank, whereas in a laterally unbounded domain the heat is removed by the boundary layer flow. The similarity solution, constructed in the present study for the laterally unbounded domain, does not describe the vertical temperature gradient, which is formed in the thermally equilibrated state in the finite-size tanks due to the influence of heat removal through the bottom. Thus, it can be used to describe quasi-steady temperature distribution in the finite-size tank for relatively short time
 $\tilde {t}\ll \tilde {t}_{therm}$. Note that, for distilled water in the present experiments (
 $H=2.5\ \mbox {cm}$),
 $\tilde {t}_{therm}$ is about 4500 s whereas, for
 $H=10\ \mbox {cm}$, it is about 20 h.
Surface temperature distributions, averaged over the wire length, are shown in figure 14. In simulation, a simplified description of the heated wire with a constant heat flux, prescribed in a narrow patch on the surface, is employed. The peak temperature value, obtained in simulation, depends on the heated region width ( $1.4$ mm), which is determined from the comparison of the simulation result with IR thermography data. However, good agreement between the experiment and simulation far from the heated wire indicates that the heat transport below the surface is also correctly described by the no-slip boundary condition.
Surface temperature variation distributions, obtained by numerical simulation and IR thermography  $8$,
 $22$,
 $60$ and
 $150$ s after heating is initiated.

As mentioned in § 6.3, the surface pressure distribution can be determined from the results of the surface relief measurements using MG BOS. The obtained surface pressure profiles are compared with the results of numerical simulation and similarity solution (3.10) in figure 15 for two values of heating power:  $31$ and
 $62\ \textrm {W}\ \textrm {m}^{-1}$. Good agreement is observed in both cases, despite the fact that experimental measurements and numerical simulations are performed for the tank with side walls and the similarity solution is derived for a laterally unbounded domain. The similarity solution yields accurate surface pressure values outside the stagnation region, where the boundary layer approximation becomes invalid.
Surface pressure distributions determined from MG BOS, similarity solution and numerical simulation. Results are shown for (a)  $q = 31\ \textrm {W}\ \textrm {m}^{-1}$,
 $t = 150$ s; (b)
 $q= 62\ \textrm {W}\ \textrm {m}^{-1}$,
 $t = 40$ s.

Snapshots of the surface pressure distributions are presented for  $q=31$ and
 $62\ \textrm {W}\ \textrm {m}^{-1}$ in figures 16 and 17, respectively. The surface crest grows with the development of the upstream flow below the heated wire. Then, the steady state is achieved, which is described by the similarity solution (3.10). Small depressions, present in some of the experimental profiles, are due to parasitic waves with an amplitude less than
 $1\ \mathrm {\mu }\textrm {m}$. Note that, as reported by Vinnichenko et al. (Reference Vinnichenko, Pushtaev, Plaksina and Uvarov2020), the shape of the surface perturbation is highly sensitive to the boundary condition for the horizontal velocity at the surface. In distilled water and in glycerol the surface film suppresses thermocapillary convection, which results in the formation of a single crest at
 $X=0$. This behaviour is described by simulation with a no-slip boundary condition, imposed at the surface. In contrast, in silicone oil an unsteady wave was observed (Vinnichenko et al. Reference Vinnichenko, Pushtaev, Plaksina and Uvarov2020), composed of a stagnant central peak, surrounded by two troughs moving away from the heat source. The troughs are formed due to thermocapillary convection, which removes liquid from the heated regions of the surface.
Instantaneous surface pressure distributions obtained by MG BOS and numerical simulation  $8$,
 $22$ and
 $150$ s after heating is initiated;
 $q=31\ \textrm {W}\ \textrm {m}^{-1}$.

Instantaneous surface pressure distributions obtained by MG BOS and numerical simulation  $7$,
 $16$ and
 $50$ s after heating is initiated;
 $q=62\ \textrm {W}\ \textrm {m}^{-1}$.

8. Conclusions
Experimental, numerical and analytical studies of the horizontal convective flow driven by a line heat source located at the liquid surface have been performed for distilled water, where the surface renewal and thermocapillary convection are inhibited by the presence of the surface film. The same surface behaviour, corresponding to a no-slip boundary condition, is observed in tap water and glycerol. A new similarity solution, which takes into account the horizontal pressure gradient, has been derived for the boundary layer formed below the liquid surface in a laterally unbounded domain. Its validity has been verified by comparison with the results of numerical simulation and experimental measurements of the velocity fields, surface temperature and surface relief. The same scaling has been obtained from the similarity solution for the heating power dependences of the maximal horizontal velocity ( ${\sim }q^{1/3}$) and the boundary layer thickness (
 ${\sim }q^{-1/6}$), and for the Nusselt–Rayleigh relations (
 $Nu_{loc}\sim Ra_X^{1/3}$ and
 $Nu_{tot}\sim Ra_L^{1/6}$), as reported by Mullarney et al. (Reference Mullarney, Griffiths and Hughes2004) for the horizontal convection in a finite-size tank with a non-uniformly heated bottom wall. This similarity of the horizontal convective flows in different configurations is attributed to the no-slip boundary condition, imposed by the surface film present in distilled water.
Supplementary material
Supplementary material is available at https://doi.org/10.1017/jfm.2022.502.
Funding
Authors acknowledge the support from M.V. Lomonosov Moscow State University Program of Development.
Declaration of interests
The authors report no conflict of interest.