Introduction
Scoring systems are very successful in predicting survival in certain diseases. They can also provide the clinician with satisfactory information about the severity and course of the disease. Due to the overcrowded nature of the emergency department, patient triage is very important. During the ongoing COVID-19 pandemic, the requirement for patient triage increased. Both the increase in the number of patients and the limited capacity of hospitals have made it necessary to identify high-risk patients, especially those severely infected by COVID-19, and refer them to the right department for treatment. It is very important to have prior knowledge about the course of the disease in order to effectively use hospital facilities for the right patient. To evaluate the severity of COVID-19 cases, lymphocyte, C-reactive protein, and interleukin-1, as well as d-dimer and ferritin values are measured. Reference Terpos, Ntanasis-Stathopoulos and Elalamy1,Reference Özdemir, Eroglu and Algin2 However, the measurement of these blood parameters takes time and increases medical costs. Therefore, scoring systems that can only be calculated using vital signs, such as the National Early Warning Score (NEWS), have been developed. Reference Hu, Yao and Qiu3,Reference Özdemir, Akça, Algın, Altunok and Eroğlu4 In addition to NEWS, NEWS + lactate (NEWS+L), CURB-65, and Brescia scoring systems are used in emergency services. The success of the NEWS system in critically ill patients has been demonstrated by many researchers. Reference Usman, Usman and Ward5,Reference Spagnolli, Rigoni, Torri, Cozzio, Vettorato and Nollo6 Various modifications of the NEWS have been investigated to predict pre-hospital and in-hospital mortality in elderly patients. Reference Mitsunaga, Hasegawa and Uzura7 Lactic acidosis has an important place in patient follow-up, as it indicates tissue hypoxia. Therefore, the lactate level was added to the NEWS to obtain NEWS+L. Reference Jo, Jeong, Lee, Jin, Yoon and Park8 In the current study, we aimed to show the ability of the serum lactate level and NEWS+L to predict short-term mortality in COVID-19 patients at the time of first admission to the emergency department.
Method
This retrospective study was carried out at the emergency department of the Umraniye Education and Research Hospital. Patient data were collected between January 15, 2021, and June 15, 2021. Ethical approval was obtained from the ethics board of the hospital. The study was conducted in full compliance with the principles of the Declaration of Helsinki. Our hospital served as a pandemic hospital in 2020 and 2021, where patients with COVID-19 pneumonia were admitted to inpatient wards and intensive care units.
Study population
Patients who presented to our hospital with COVID-19 symptoms and who tested positive for the disease according to the reverse transcription-polymerase chain reaction (RT-PCR) test were included in our study. All the patients were followed up in COVID-19 wards. The inclusion criteria were being 18 years or older and having a positive RT-PCR test result. Patients whose data were not available and those whose lactate values were not measured at the time of first admission were excluded from the sample.
Data collection
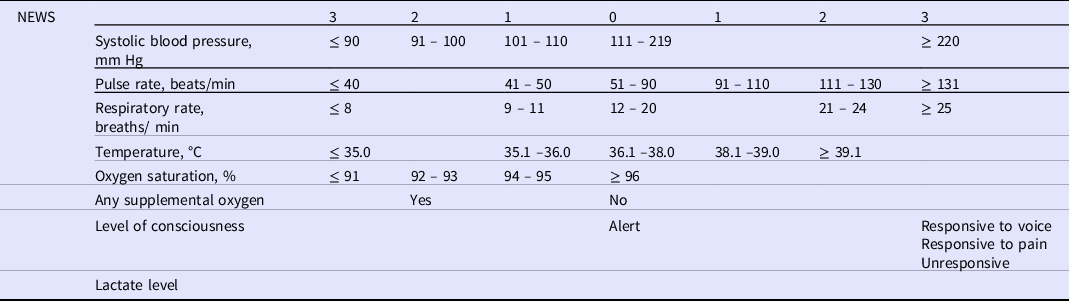
Patients presenting to the emergency department with COVID-19 symptoms as outpatients, those referred to our department from another hospital, and those brought by ambulance services, were included in the study. At the time of admission, the patients’ vital signs were measured, examinations were made, and the data were recorded in the electronic environment. Blood test analyses of the patients, including lactate values, were performed at the time of admission. Then, the NEWS and NEWS+L were calculated using the parameters accessed from the electronic recording system (Table 1). The 28-day mortality rate was recorded by screening the hospital records and the national death notification system.
Calculation of NEWS and NEWS+L

NEWS: National Early Warning Score; NEWS+L: National Early Warning Score + lactate.
Outcomes
The primary outcome of the study was the diagnostic value of NEWS+L and lactate in predicting 28-day mortality in patients with COVID-19 pneumonia.
Statistical analysis
Data were analyzed using Jamovi version 1.6.21.0 (Jamovi, Sydney, Australia). Continuous data were expressed as mean ± standard deviation values, categorical variables as percentages, and continuous variables as median (interquartile range values). The differences between the groups were compared using the Student’s t-test for normally distributed quantitative variables and the Mann–Whitney U test for non-normally distributed quantitative variables. A P - value of < 0.05 was considered statistically significant.
Results
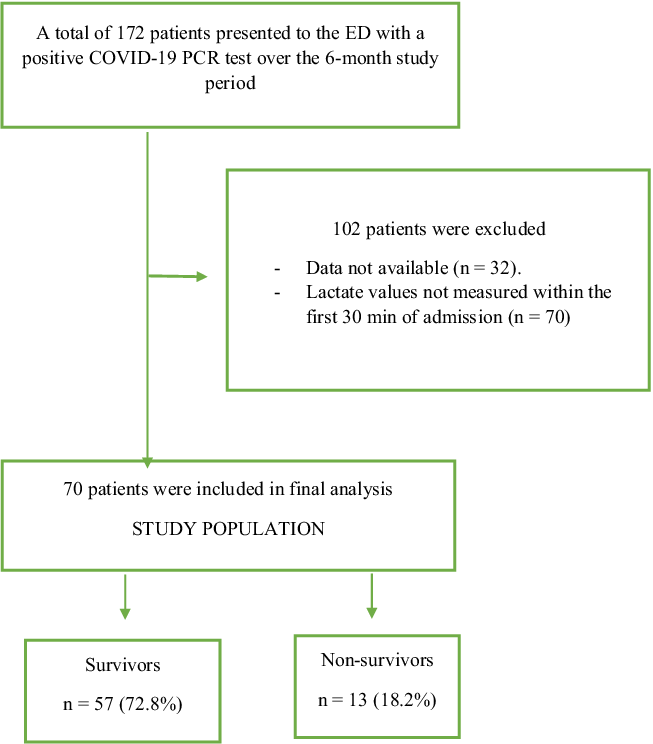
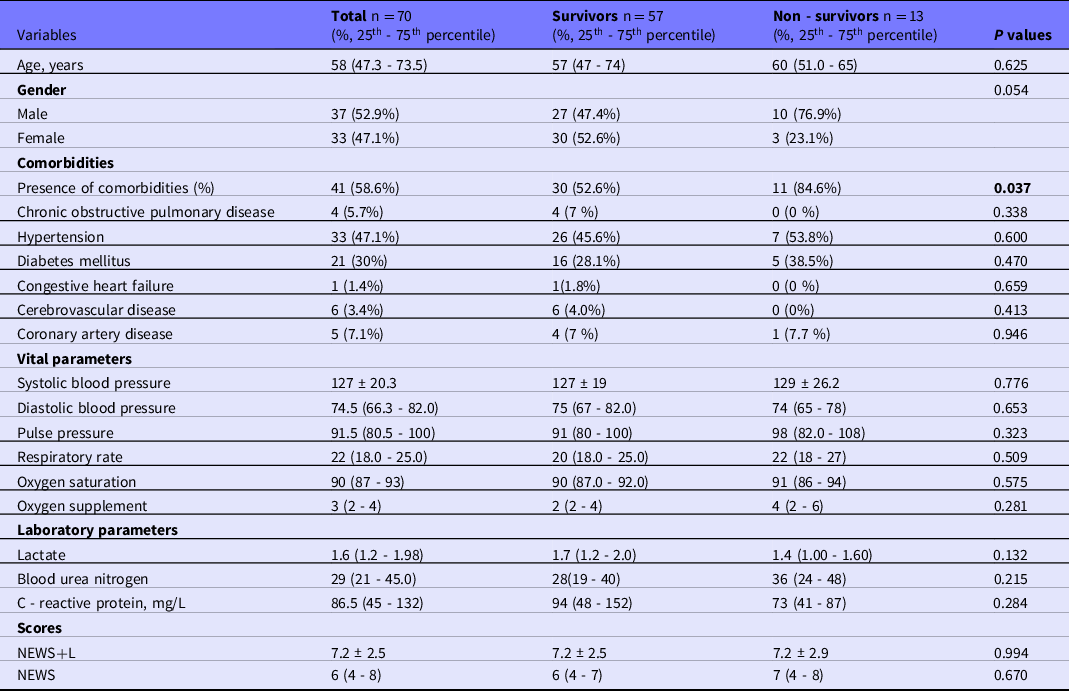
Between January 15, 2021, and June 15, 2021, a total of 172 patients presented to the emergency department of our hospital due to COVID-19. Of these patients, 102 were excluded using the study criteria (Figure 1). As a result, 70 patients were included in the sample. The median (25th –75th percentile) age was 58 (47.3–73.5) years, and 33 (47.1%) of the patients were female. The most common comorbidity was hypertension (n = 33, 47.1%), followed by diabetes mellitus (n = 21, 30%), cerebrovascular disease (n = 6, 3.4%) and coronary artery disease (n = 5, 7.1%). The baseline characteristics of the enrolled patients and the comparison between the survivor and non-survivor groups are shown in Table 2. For the whole sample, the median lactate value was 1.6 (1.2–1.98) mmol/L, the median NEWS was 6 (4–8) and the mean NEWS+L was 7.2 ± 2.5. Mortality occurred in 13 (18.2%) of the 70 patients at 28 days. Lactate, NEWS and NEWS+L did not have a significant relationship with mortality. None of these parameters was able to predict mortality (P = 0.132, 0.670, and 0.994, respectively).
A flow diagram of the study.

Baseline characteristics of the enrolled patients and their comparison between the survivor and non - survivor groups

Abbreviation: NEWS, National Early Warning Score; NEWS+L: National Early Warning Score + lactate.
Discussion
In this retrospective study, we investigated the predictive power of NEWS+L, NEWS, and lactate, which were evaluated at admission for 28-day mortality in patients hospitalized with COVID-19 pneumonia during the ongoing pandemic. NEWS+L, NEWS, and lactate, evaluated within the first 30 minutes of admission to the emergency department had no statistically significant correlation with mortality due to COVID-19.
It is important to determine the severity of COVID-19 cases presenting to the emergency department early. The parameters used for this should be easily obtained, inexpensive, and commonly available. In a 2016 study, Jo et al. Reference Jo, Jeong, Lee, Jin, Yoon and Park8 developed NEWS+L by adding the lactate parameter to NEWS in the evaluation of patients with community-acquired pneumonia. Since then, NEWS+L has been investigated in many other patient groups. Reference Dundar, Kocak and Girisgin9,Reference Kim, Jo and Lee10 Dündar et al. showed that NEWS+L could predict in-hospital mortality in critical geriatric patients in the emergency department. Reference Dundar, Kocak and Girisgin9 Similarly, Kim, et al. suggested that NEWS+L be used to detect low-risk patients from those with upper gastrointestinal bleeding. Reference Kim, Jo and Lee10 However, to our knowledge, there is no study investigating the ability of NEWS+L to predict short-term poor outcome in COVID-19 patients; therefore, our study is the first 1 in this respect. According to our results, NEWS+L did not statistically or clinically predict short-term mortality at the time of admission to the emergency department. Most scoring systems attempt to predict poor outcomes using instantaneous, vital, and laboratory parameters. Therefore, a common and valid mortality score that can be used in the first admission of patients to emergency services has not been developed. Scores that predict the need for mechanical ventilation and the clinical severity of patients, such as the Quick COVID-19 Severity Index and Brescia-COVID Respiratory Severity Scale /Algorithm, are more widely used.
Lactate is 1 of the parameters that has been shown to correlate with mortality and poor outcomes in patients with sepsis and pneumonia. Reference Nolt, Tu and Wang11,Reference Zhou, Lan and Guo12 However, there are publications reporting conflicting results concerning its relationship with mortality in COVID-19. Reference Carpenè, Onorato and Nocini13 In a study including both inpatients and outpatients, Velavan et al. showed a relationship between high lactate levels and COVID-19 severity. Reference Velavan, Kieu Linh, Kreidenweiss, Gabor, Krishna and Kremsner14 In contrast, in another study conducted with COVID-19 patients, Benedetti et al. found that lactate did not significantly predict 30-day mortality. Reference Benedetti, Spinelli and Callegari15 In a study undertaken in the early period of the pandemic, Wang et al. determined the mean lactate value to be 1.3 (0.7–2.0) mmol/L in critically ill patients in need of intensive care, and this value was within the normal range. Reference Wang, Hu and Hu16 Gustavo et al. found the mean lactate value as 1.7 (1.1–3.2) mmol/L in critically ill patients, 24 hours after admission. Reference Ospina-Tascón, Hernandez and Alvarez17 Similarly, we did not find a significant relationship between short-term mortality and lactate in our study. These studies show that lactate values evaluated at admission in patients with COVID-19 pneumonia and some other critical diseases are not always significantly elevated. A logical explanation for the lack of a significant change in lactate values in COVID-19 patients can be a circulatory failure that has not yet started at the time of admission, with the main presentation complaint being shortness of breath. Reference Ottestad, Seim and Mæhlen18 Another indication of this is that despite low saturation in COVID-19 patients, their clinical condition is relatively good. Reference Dhont, Derom, Van Braeckel, Depuydt and Lambrecht19 Therefore, Lactate simply makes no sense, from a physiologic point of view, in the early stage of COVID-19.
The NEWS system has been investigated in many high-risk conditions, such as cardiac arrest. Reference Smith, Prytherch, Meredith, Schmidt and Featherstone20 In a study evaluating 606 hospitalized COVID-19 patients, Wellbelove et al. showed that the NEWS was not associated with short-term mortality. Reference Wellbelove, Walsh, Perinpanathan, Lillie and Barlow21 In another study, Covino et al. stated that 5 different early warning systems were able to predict 7-day mortality in COVID-19 patients. The authors reported that the highest area under the receiver operating characteristic curve value belonged to the NEWS (0.783), but this did not reach a strong significance level. In our study, there was no significant relationship between the NEWS and mortality. The explanation for this may be that not all the parameters that make up the NEWS are associated with mortality in our sample.
Limitations
This study has many limitations. The first and most important limitation concerns its retrospective design. Second, the relatively low number of patients limited the generalizability of the results of our study. Third, we could not evaluate the specific causes of death of patients or the time of death from admission. We analyzed all-cause mortality within 28 days. Fourth, clinical deterioration in COVID-19 patients occurs mostly after admission to inpatient wards or the intensive care unit. However, we evaluated the parameters only once, immediately after the patients’ admission to the emergency department. A second evaluation could not be made. Therefore, we were unable to save changes in scores during the clinical course of the disease. Finally, the fact that our study was single-centered is another factor limiting the generalizability of its results.
Conclusion
According to our study, mortality predictors such as NEWS+L, NEWS, and lactate at admission failed to predict short-term mortality in COVID-19 patients. Is there another biomarker that could be of use, in addition to a clinical score? We suggest that question to be answered.
Availability of data and materials
The datasets used during the current study are available from the corresponding author.
Funding statement
There are no funders to report for this submission.
Conflicts of interest
None declared.