Introduction
Major depressive disorder (MDD) is one of the most prevalent and debilitating mental illnesses characterized by multifaceted interactions between genetic variants and environmental exposure, producing functional and structural alterations in the neural networks of emotion processing (Kupfer, Frank, & Phillips, Reference Kupfer, Frank and Phillips2012; Otte et al., Reference Otte, Gold, Penninx, Pariante, Etkin, Fava and Schatzberg2016). Considered by the World Health Organization to be the leading cause of incapacity, the functional and psychological deficits that result from MDD are pervasive, often chronic, recurring, progressive, and highly disabling (Malhi & Mann, Reference Malhi and Mann2018). Many neuroimaging studies have reported structural and functional abnormalities in the brain in MDD and have helped increase the neurobiological understanding of the disorder (Kupfer et al., Reference Kupfer, Frank and Phillips2012; Li et al., Reference Li, Friston, Mody, Wang, Lu and Hu2018; Phillips et al., Reference Phillips, Chase, Sheline, Etkin, Almeida, Deckersbach and Trivedi2015; Williams, Reference Williams2016). However, the underlying neural basis of MDD remains to be clarified.
Emerging evidence has proposed a neurodevelopmental perspective on the pathophysiology of MDD related to disturbances in neural circuitry (Ansorge, Hen, & Gingrich, Reference Ansorge, Hen and Gingrich2007; Gałecka, Bliźniewska-Kowalska, Maes, Su, & Gałecki, Reference Gałecka, Bliźniewska-Kowalska, Maes, Su and Gałecki2021; Gałecki & Talarowska, Reference Gałecki and Talarowska2018; Lima-Ojeda, Rupprecht, & Baghai, Reference Lima-Ojeda, Rupprecht and Baghai2018). Previous neuroimaging studies, including meta-analyses, have identified functional alterations in the limbic structures, lateral and medial prefrontal cortex (PFC), anterior cingulate cortex (ACC), orbitofrontal cortex (OFC), and insula in MDD (Li et al., Reference Li, Friston, Mody, Wang, Lu and Hu2018; Rive et al., Reference Rive, van Rooijen, Veltman, Phillips, Schene and Ruhé2013; Williams, Reference Williams2016). Similarly, structural investigations have reported aberrations in the prefrontal-limbic circuitry, including the lateral PFC, ventromedial PFC, dorsomedial PFC, OFC, ACC, and hippocampus (Li et al., Reference Li, Zhao, Chen, Long, Dai, Huang and Gong2020; Schmaal et al., Reference Schmaal, Veltman, van Erp, Sämann, Frodl, Jahanshad and Hibar2016; Schmaal et al., Reference Schmaal, Hibar, Sämann, Hall, Baune, Jahanshad and Veltman2017).
Recent functional neuroimaging studies highlight the involvement of these cortical regions in various emotion regulation-related neural circuits, which are associated with specific depression symptomatology: elevated ventral limbic network during excessive negative mood (dysphoria); decreased activity in the frontal-striatal reward network accounting for loss of interest, motivation, and pleasure (anhedonia); enhanced default mode network in depressive rumination; and diminished activity in the dorsal cognitive control network in cognitive dyscontrol, particularly in regulating negative thoughts and emotions (Li et al., Reference Li, Friston, Mody, Wang, Lu and Hu2018).
Most brain morphometric parameters are affected by state-dependent factors (Nenadic et al., Reference Nenadic, Maitra, Dietzek, Langbein, Smesny, Sauer and Gaser2015). Cortical folding, on the other hand, is a structural morphological index referring to the developmental process of the brain cortex in the formation of the gyrus and sulcus (Striedter, Srinivasan, & Monuki, Reference Striedter, Srinivasan and Monuki2015; White, Su, Schmidt, Kao, & Sapiro, Reference White, Su, Schmidt, Kao and Sapiro2010). As an indicator closely related to principal neural connectivity, it is generally considered a neurodevelopmental hallmark reflecting surface complexity and the early neural development of cortical connectivity (Dauvermann et al., Reference Dauvermann, Mukherjee, Moorhead, Stanfield, Fusar-Poli, Lawrie and Whalley2012; Nixon et al., Reference Nixon, Liddle, Nixon, Worwood, Liotti and Palaniyappan2014). Because neurodevelopmental markers guarantee the capture of mechanisms associated with vulnerability to MDD, such information is critical in further comprehending the pathophysiology of MDD (Depping et al., Reference Depping, Thomann, Wolf, Vasic, Sosic-Vasic, Schmitgen and Wolf2018).
Previous studies investigating patterns of abnormal cortical gyrification in MDD have provided valuable insights; however, the reported findings on cortical folding are controversial. A study comparing cortical gyrification between MDD and borderline personality disorder reported a common reduction in the cortical folding of the precuneus, superior parietal gyrus, and parahippocampal gyrus in both groups when compared to healthy individuals (Depping et al., Reference Depping, Thomann, Wolf, Vasic, Sosic-Vasic, Schmitgen and Wolf2018). Patients with MDD also demonstrated hypogyrification in the middle frontal and fusiform gyri. Similarly, another study highlighted hypogyrification in the fusiform gyrus in MDD (Chen et al., Reference Chen, Liu, Zuo, Xi, Long, Li and Yang2021). Conversely, other studies have identified an increase in cortical folding, specifically in regions including the frontal pole, precentral and postcentral gyrus, cingulate, superior temporal gyrus, lingual gyrus, and fusiform gyrus (Han et al., Reference Han, Won, Kang, Kim, Yoon, Chang and Ham2017a; Schmitgen et al., Reference Schmitgen, Depping, Bach, Wolf, Kubera, Vasic and Wolf2019).
Despite these efforts, previous studies have been limited by their small sample size and lack of investigation of the association between clinical characteristics of MDD, including recurrence, illness duration, severity of depression, remission status, medication, and the pattern of gyrification (Depping et al., Reference Depping, Thomann, Wolf, Vasic, Sosic-Vasic, Schmitgen and Wolf2018; Han et al., Reference Han, Won, Kang, Kim, Yoon, Chang and Ham2017a; Long et al., Reference Long, Xu, Wang, Li, Rao, Wu and Kuang2020; Schmitgen et al., Reference Schmitgen, Depping, Bach, Wolf, Kubera, Vasic and Wolf2019; Zhang et al., Reference Zhang, Yu, Zhou, Li, Li and Jiang2009). Only a scarce number of studies including, Depping et al. (Reference Depping, Thomann, Wolf, Vasic, Sosic-Vasic, Schmitgen and Wolf2018) and Long et al. (Reference Long, Xu, Wang, Li, Rao, Wu and Kuang2020) reported significant associations between the age of onset and hypogyrification of frontal gyrus in patients with MDD (Depping et al., Reference Depping, Thomann, Wolf, Vasic, Sosic-Vasic, Schmitgen and Wolf2018), and negative correlations between Hamilton Anxiety Rating Scale (HARS) scores and the local gyrification index (LGI) score of the right posterior superior temporal sulcus (Long et al., Reference Long, Xu, Wang, Li, Rao, Wu and Kuang2020). Our previous study investigated correlations between depression severity, illness duration, and LGI values and has recounted no significant correlations (Han et al., Reference Han, Won, Kang, Kim, Yoon, Chang and Ham2017a). It is critical to establish a relationship between the clinical characteristics of MDD and cortical folding patterns to clarify whether cortical gyrification is a stable indicator reflecting the traits of MDD or a marker reflecting the state of illness.
Therefore, in the present study, we aimed to investigate the association between the diagnosis of MDD and LGI with a fairly large sample of 234 patients with MDD and 215 healthy controls (HCs). We also aimed to investigate the association between the LGI and clinical characteristics of MDD, such as recurrence, remission status, illness duration, severity of depression, and medication use in patients with MDD. We hypothesized that patients with MDD would show significant hypogyria in the PFC, OFC, insula, and ACC, which are deeply involved in emotion regulation, compared to HCs. We also hypothesized that the LGI would be identified to be a stable neuroimaging marker, not associated with the state-dependent clinical characteristics of MDD.
Methods
Participants
A total of 234 patients with MDD (139 women and 96 men) and 215 HCs (129 women and 86 men) were included in the present study. The study protocol was approved by the Institutional Review Board (IRB) of the Korea University Anam Hospital (2015AN0009, 2016AN0213, 2017AN0185, and 2019AN0174). All participants provided written informed consent to participate in the study. The study methodology was in accordance with approved guidelines and the Declaration of Helsinki. Patients with MDD were recruited between July 2015 and August 2021 from the outpatient psychiatric clinic of Korea University Anam Hospital in Seoul, Republic of Korea. The inclusion criterion for the MDD group was adults aged 19–65 years. The diagnosis of MDD was determined by two experienced board-certified psychiatrists (K.-M. Han and B.-J. Ham) using the Structured Clinical Interview for the DSM-IV-TR (Diagnostic and Statistical Manual of Mental Disorders, Fourth Edition, Text Revision) Axis I Disorders (SCID-I). The exclusion criteria were as follows: (i) comorbidity of any other major psychiatric disorders (including personality and substance use disorders), (ii) MDD with psychotic features, (iii) acute suicidal or homicidal patients requiring inpatient treatment, (iv) history of a serious or unstable medical illness, (v) primary neurological illness (for example, Parkinson's disease, cerebrovascular disease, or epilepsy), (vi) recent abnormal results on physical examination or laboratory tests, (vii) pregnant or currently nursing, and (viii) any contraindication for magnetic resonance imaging (MRI). A total of 215 HCs, aged 19–65 years, were recruited from the community using advertisements. HCs were assessed by two psychiatrists using the same exclusion criteria as those used for the patients in the MDD group. Participants were included in the HC group if two board-certified psychiatrists confirmed that they had no ongoing or past history of Axis I or II disorders.
Clinical assessments
Sociodemographic and clinical data were collected from both groups. The severity of depressive symptoms of all participants was recorded using the 17-item Hamilton Depression Rating Scale (HDRS) at the time of the MRI scan (Hamilton, Reference Hamilton1960). The duration of illness was assessed as the lifetime cumulative number of months of depressive episode(s) using the life-chart methodology. According to psychiatric interviews and medical records, patients were classified into patients with their first episode of MDD (FE-MDD) and those who experienced two or more major depressive episodes (that is, recurrent MDD; R-MDD). For remission status, we classified patients with an HDRS score of 7 or lower as remitted patients. To assess the possible impact of current psychopharmacological treatment, psychotropic medication was assessed and coded 0 for drug-naïve patients and 1 for those taking psychopharmacological medication. Detailed information regarding the psychotropic medications is provided in Table 1.
Demographic and clinical characteristics of patients with major depressive disorder and healthy controls

HCs, healthy controls; MDD, major depressive disorder; HDRS-17, 17-item Hamilton Depression Rating Scale; TICV, total intracranial cavity volume; SSRI, selective serotonin reuptake inhibitor; SNRI, serotonin and norepinephrine reuptake inhibitor; NDRI, norepinephrine-dopamine reuptake inhibitor; NaSSA, noradrenergic and specific serotonergic antidepressant; Combination of AD, combinations of two or more types of antidepressants; APs, antipsychotics; ADs, antidepressants.
Data are presented as mean ± standard deviation for age, education years, HDRS-17 scores, illness duration, and TICV.
p values for sex distribution were obtained using the χ2 test.
p values for comparisons of age, education years, HDRS scores, and TICV were obtained using independent t tests.
MRI data acquisition
We obtained T1-weighted images of the participants using a 3.0-Tesla TrioTM whole-body imaging system (Siemens Healthcare GmbH, Erlangen, Germany) at the Korea University MRI Center. The T1-weighted images were acquired parallel to the anterior-commissure–posterior-commissure line using the 3D T1-weighted magnetization-prepared rapid gradient-echo (MP-RAGE) sequence with the following parameters: repetition time (TR), 1900 ms; echo time (TE), 2.6 ms; field of view, 220 mm; matrix size, 256 × 256; slice thickness, 1 mm; number of coronal slices, 176 (without gap); voxel size, 0.86 × 0.86 × 1 mm3; flip angle, 16°; and number of excitations, 1.
Imaging processing
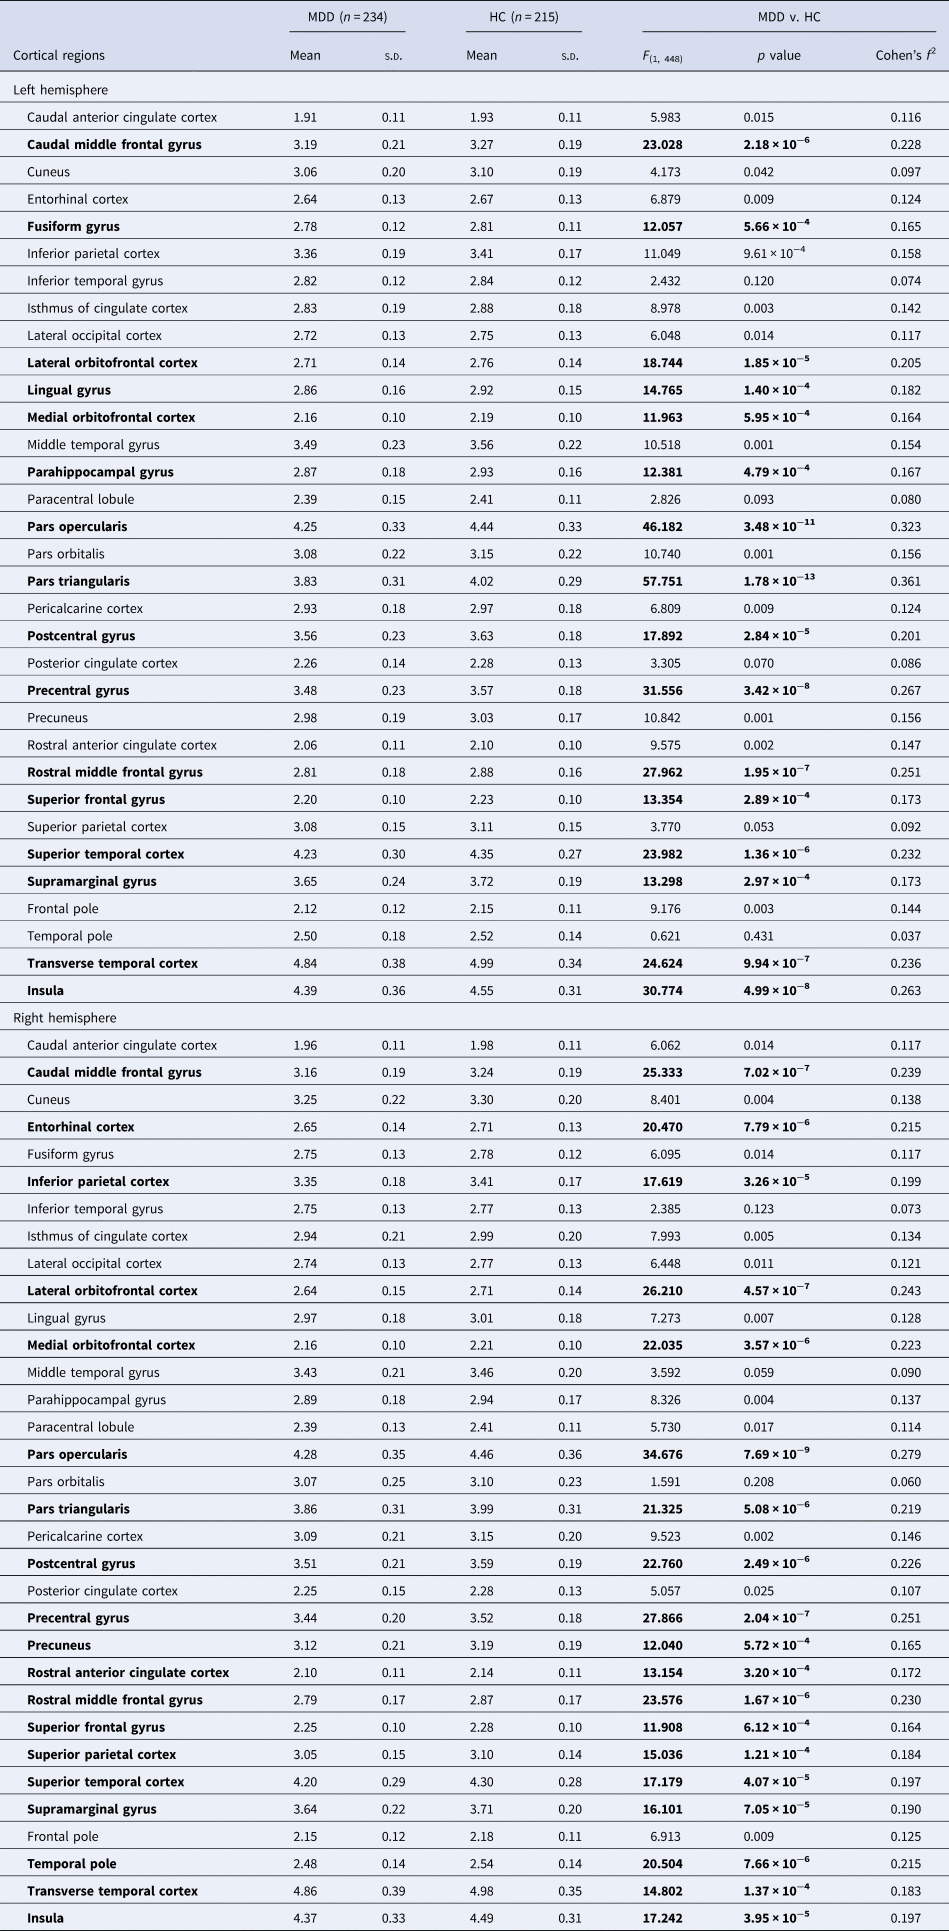
According to a previously described protocol in our study on the LGI (Choi et al., Reference Choi, Han, Kim, Kang, Kang, Tae and Ham2022), we extracted LGI values of each cortical parcellation in the whole brain using automated procedures implemented in the FreeSurfer 7.2 version (Laboratory for Computational Neuroimaging, Athinoula A. Martinos Center for Biomedical Imaging, Charlestown, MA, USA; http://surfer.nmr.mgh.harvard.edu). FreeSurfer provides a three-dimensional reconstruction model of the cortical surface using pre-processed T1-weighted images obtained from the participants. Detailed procedures regarding cortical reconstruction performed in FreeSurfer were described in our previous studies (Choi et al., Reference Choi, Han, Kim, Kang, Kang, Tae and Ham2022; Han et al., Reference Han, Choi, Jung, Na, Yoon, Lee and Ham2014; Han et al., Reference Han, Won, Kang, Kim, Yoon, Chang and Ham2017a; Han et al., Reference Han, Won, Sim, Kang, Han, Kim and Ham2017b). The average LGI was determined as the ratio of the buried cortical surface area to the outer convex (hull) surface area in each parcellated cortical region [that is, buried cortical surface area (mm2)/outer convex surface area (mm2)] (Choi et al., Reference Choi, Han, Kim, Kang, Kang, Tae and Ham2022). The extraction of LGI values from cortical parcellations was performed according to a previously reported standard protocol (Nanda et al., Reference Nanda, Tandon, Mathew, Giakoumatos, Abhishekh, Clementz and Keshavan2014), and detailed information about the processes has been described in our previous studies on the LGI (Choi et al., Reference Choi, Han, Kim, Kang, Kang, Tae and Ham2022). LGI values were extracted based on the Desikan–Killiany atlas (Desikan et al., Reference Desikan, Ségonne, Fischl, Quinn, Dickerson, Blacker and Killiany2006), and each hemisphere was parcellated into 33 cortical regions according to the atlas (Desikan et al., Reference Desikan, Ségonne, Fischl, Quinn, Dickerson, Blacker and Killiany2006). We used the LGI values from 66 cortical regions in both hemispheres in the analyses. A list of cortical regions is shown in Table 2. Furthermore, total intracranial cavity volume (TICV) was automatically calculated in FreeSurfer for the comparison between two groups.
Comparison of the local gyrification index between patients with major depressive disorders and healthy controls

MDD, major depressive disorder; HC, healthy control; s.d., standard deviation.
F and p values were obtained using one-way analysis of covariance (ANCOVA) with adjustment for age, sex, and education years as covariates.
Bonferroni correction was applied; p < 0.05/66 = 0.000758.
Significant group differences are presented in a bold face.
Statistical analyses
As the main analysis, a one-way analysis of covariance (ANCOVA) was performed to compare the LGI values between patients with MDD and HCs, including the extracted 66 LGIs from each cortical parcellation as dependent variables, the groups (MDD v. HC group) as independent variables, and age, sex, and years of education as nuisance covariance in the analysis. For multiple comparisons, we applied Bonferroni correction to all analyses [that is, p < 0.05/66 = 0.000758 (66 cortical regions in the bilateral hemispheres)].
In the secondary analyses, we investigated the potential association between clinical characteristics of MDD – recurrence of MDD, psychopharmacological treatment, illness duration, severity of depressive symptoms (and remission status), and LGIs within the MDD group with the following methods: (1) recurrence: comparison of LGIs between FE-MDD and R-MDD using ANCOVA with covariates of age, sex, years of education, HDRS score, and medication; (2) remission status: comparison of LGIs between remitted (HDRS score ⩽ 7) and non-remitted patients (HDRS score ⩾ 8) using ANCOVA with covariates of age, sex, years of education, illness duration, and medication; (3) psychopharmacological treatment: comparison of LGIs between drug-naïve patients (DN-MDD) and those taking medications (M-MDD) with covariates of age, sex, years of education, HDRS score, and illness duration; (4) illness duration: Pearson's partial correlation analysis between illness duration and LGIs with covariates of age, sex, years of education, HDRS score, and medication; and (5) severity of depressive symptoms: Pearson's partial correlation analysis between HDRS score and LGIs with covariates of age, sex, years of education, illness duration, and medication. Bonferroni correction was applied to all analyses (p < 0.05/66 = 0.000758).
For investigating the sociodemographic and clinical differences between the MDD and HC groups, we used the independent t test to analyze age, years of education, HDRS scores, and TICV, and the chi-square test to analyze the differences in sex distribution. All statistical analyses were performed using IBM SPSS Statistics for Windows (version 24.0; IBM Corp., Armonk, NY, USA).
Results
Sociodemographic and clinical characteristics of the sample
The sociodemographic and clinical characteristics of the participants are presented in Table 1. The MDD and HC groups did not significantly differ in terms of age, sex, years of education, and TICV (all p > 0.1), while the MDD group showed significantly higher HDRS scores than the HC group (p < 0.001). Among the 234 patients, 104 (44.4%) were in their first episode of MDD and 22 (9.4%) were in remission. The mean duration of illness was 23.32 ± 21.53 months. For psychopharmacological treatment, 53 (22.6%) were drug-naïve and 181 (77.4%) were taking psychotropic medication during MRI scanning. Detailed information about the psychotropic medications is presented in Table 1.
Differences in LGI between patients with MDD and HCs
Among 66 cortical regions in the bilateral hemispheres, patients with MDD showed significantly lower LGIs in 35 cortical regions, including the ventrolateral PFC (VLPFC, i.e. pars triangularis and opercularis), dorsolateral PFC (DLPFC, i.e. caudal and rostral middle frontal gyri), OFC, insula, ACC, and several temporal and parietal regions, compared to HCs, which remained significant after Bonferroni correction (all p < 0.000758, Table 2, Fig. 1). For the prefrontal regions, the MDD group showed significant hypogyria in the pars triangularis, pars opercularis, rostral and caudal middle frontal gyri, superior frontal gyri, lateral and medial OFC, and precentral gyri in the bilateral hemispheres compared to the HC group (Table 2). The MDD group also showed significant hypogyria in the bilateral insula and right rostral ACC compared to the HC group (Table 2). For the temporal regions, patients with MDD showed significantly lower LGI in the bilateral superior and transverse temporal gyri, right entorhinal cortex, parahippocampal gyrus, and temporal pole than HCs (Table 2). For the parietal regions, significant hypogyria was observed in the bilateral postcentral and supramarginal gyri, left lingual and fusiform gyri, and right superior and inferior parietal gyri and precuneus in the MDD group compared to the HC group (Table 2). No cortical regions showed significantly higher LGIs in the MDD group than in the HC group (Table 2).
Schematic maps of the cortical regions with significantly decreased gyrification in patients with major depressive disorder (MDD). Thirty-five cortical regions according to the Desikan–Killiany atlas show significantly lower local gyrification index (LGI) in the MDD group compared to the HC group after Bonferroni correction. The (blue) color bar represents Cohen's f 2 value in the comparison of the LGI between the two groups; the darker color represents the greater Cohen's f 2 for the decreased gyrification in the MDD group.

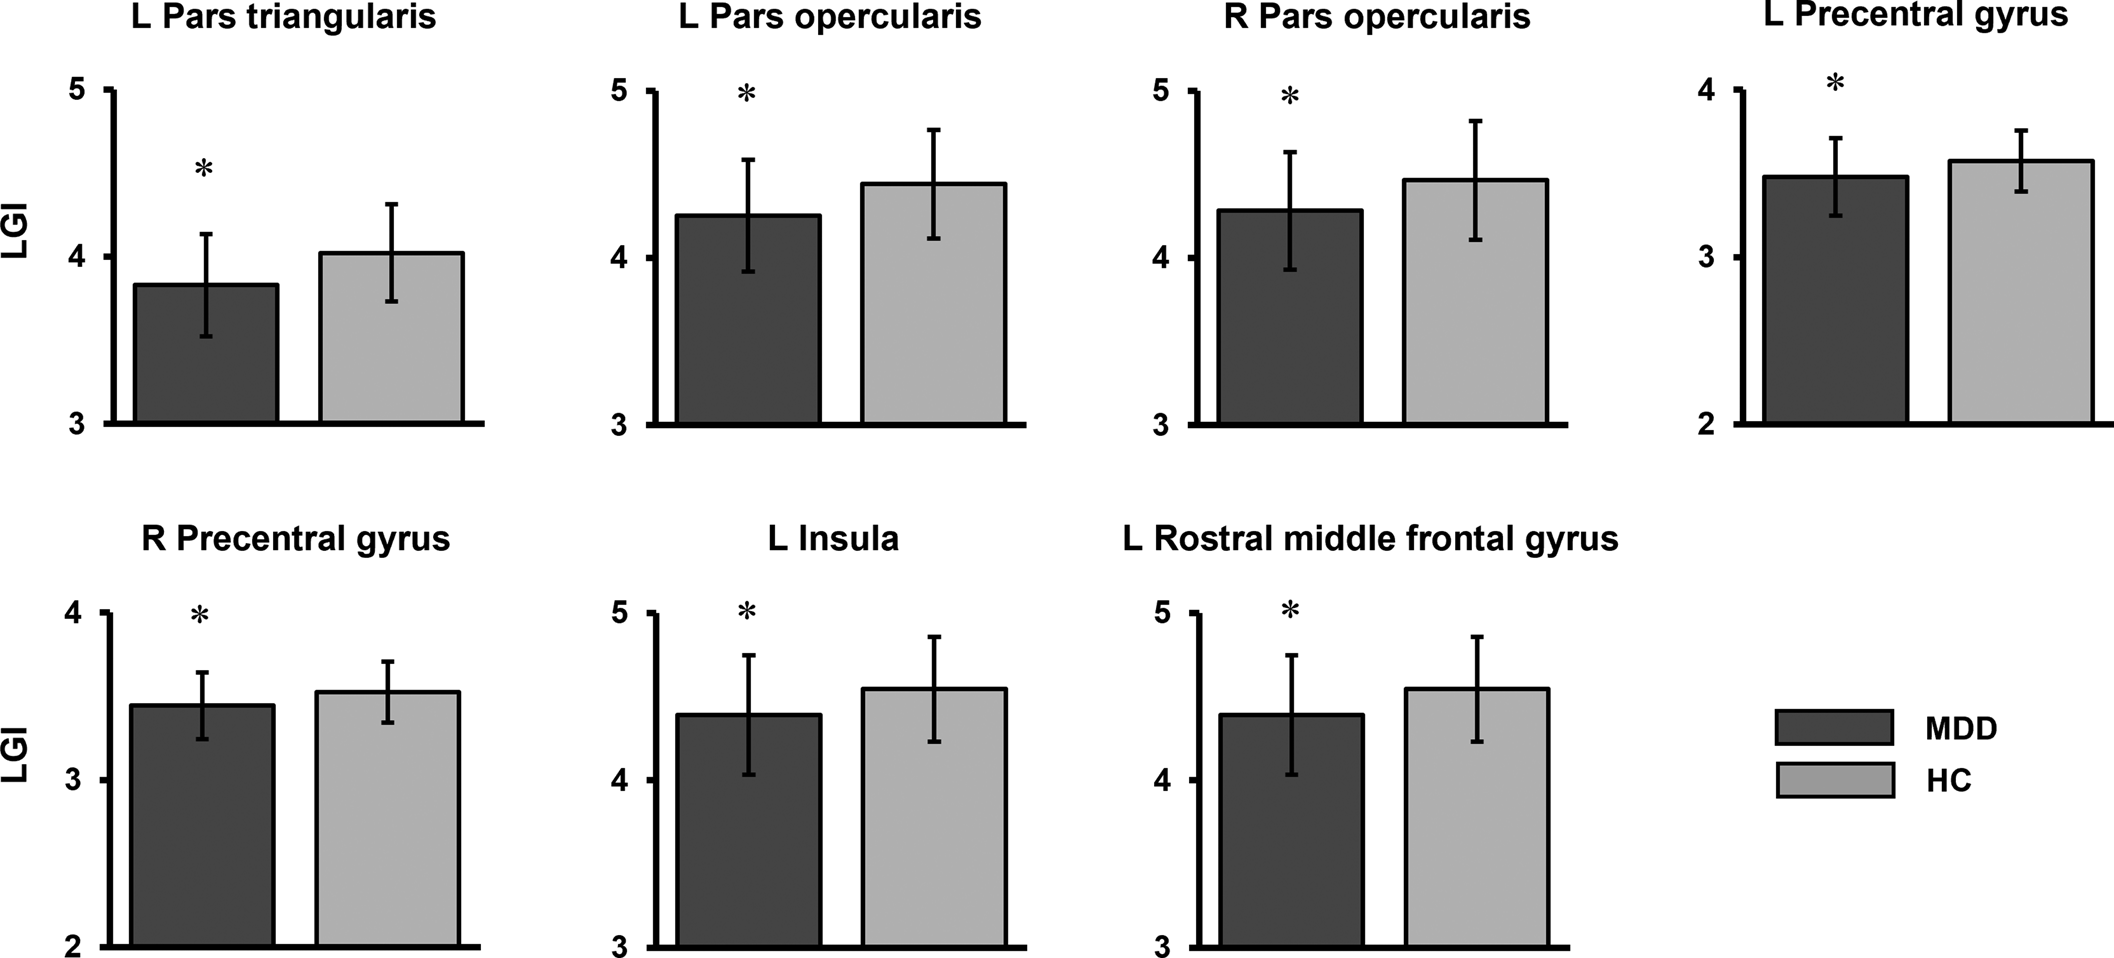
Among 35 cortical regions with significant hypogyria in the MDD group, the left pars triangularis showed the highest effect size (F (1, 448) = 57.751, p = 1.78 × 10⁻¹³, Cohen's f 2 = 0.361), which is approximate to large effect size (that is, 0.40); the left (F (1, 448) = 46.182, p = 3.48 × 10⁻¹¹, Cohen's f 2 = 0.323) and right (F (1, 448) = 34.676, p = 7.69 × 10⁻⁹, Cohen's f 2 = 0.279) pars opercularis, left (F (1, 448) = 31.556, p = 3.42 × 10⁻⁸, Cohen's f 2 = 0.267) and right (F (1, 448) = 27.866, p = 2.04 × 10⁻⁷, Cohen's f 2 = 0.251) precentral gyrus, left insula (F (1, 448) = 30.774, p = 4.99 × 10⁻⁸, Cohen's f 2 = 0.263), and left rostral middle frontal gyrus (F (1, 448) = 27.962, p = 1.95 × 10⁻⁷, Cohen's f 2 = 0.251) showed medium effect size (that is, 0.25; Fig. 2). Other significant cortical regions showed small effect sizes (Table 2).
Comparisons of the local gyrification index (LGI) between the MDD and HC groups. Seven cortical regions demonstrated significantly different LGI in the comparison after Bonferroni correction with above the medium effect size (that is, 0.25) on the Cohen's f 2. The asterisk represents significantly lower LGIs (p < 0.000758). The error bar represents one standard deviation. MDD, major depressive disorder; HC, healthy control; (l) left hemisphere; (r) right hemisphere.

As a post-hoc analysis, we performed an additional vertex-wise whole-brain analysis to compare the LGIs between MDD and HC group. The analysis included age, sex, and years of education as covariates, and the results were corrected for multiple comparisons using a Monte Carlo simulation with 10 000 iterations, a vertex-wise threshold of p < 0.001, and a cluster-wise threshold of p < 0.05. In the analysis, the clusters mapped to the following cortical regions had significantly decreased LGI in the MDD group compared to the HC group: bilateral VLPFC including the pars triangularis, left middle frontal gyrus, right lateral OFC, bilateral lingual gyrus, inferior temporal gyrus, left precuneus, entorhinal cortex, and right lateral occipital cortex (online Supplementary Table S1 and Fig. S1). We found that large clusters mainly mapped on the left pars triangularis and the right lateral OFC, which also showed significantly decreased LGIs in patients with MDD in the main analysis, showed hypogyrification in the MDD Group (online Supplementary Fig. S1).
We performed secondary analyses to investigate whether the TICV and psychotropic medication (i.e. antidepressant and antipsychotics) affect the main results as potential confounding factors. Thus, for the secondary analyses for the comparison of LGIs between the MDD and HC groups, ANCOVA was performed in three models according to the following additional covariates: (1) TICV, including TICV as an additional covariate (i.e. age, sex, education years, and TICV). TICV was automatically calculated using FreeSurfer for each participant; (2) antidepressants and antipsychotics, including fluoxetine-equivalent dose (for antidepressants) and olanzapine-equivalent dose (for antipsychotics) as additional covariates (i.e. age, sex, education years, fluoxetine-equivalent dose, and olanzapine-equivalent dose). The doses of antidepressants and antipsychotics were converted to equivalent doses of fluoxetine and olanzapine, respectively, based on previous studies on equivalent doses (e.g. fluoxetine 40 mg/day = escitalopram 18 mg/day; olanzapine 1 mg/day = quetiapine 40 mg/day) (Hayasaka et al., Reference Hayasaka, Purgato, Magni, Ogawa, Takeshima, Cipriani and Furukawa2015; Leucht, Samara, Heres, & Davis, Reference Leucht, Samara, Heres and Davis2016); and (3) TICV, antidepressants, and antipsychotics, including TICV, fluoxetine-equivalent dose, and olanzapine-equivalent dose as additional covariates (i.e. age, sex, education years, TICV, fluoxetine-equivalent dose, and olanzapine-equivalent dose).
For the first model including TICV and an additional covariate, among the 35 cortical regions that showed significant hypogyrification in the MDD group in the main analysis, 30 cortical regions remained significant after Bonferroni correction (online Supplementary Table S2 in the supplementary materials).
For the second model, which included antidepressant and antipsychotic equivalent doses as additional covariates, 31 out of 35 cortical regions (i.e. significantly decreased LGIs in MDD in the main analysis) showed significant hypogyrification in the MDD group (online Supplementary Table S3). For the third model, including TICV and antidepressant and antipsychotic equivalent doses as additional covariates, among the 35 cortical regions with significantly decreased LGIs in the MDD group for the main analysis, 28 cortical regions showed significant hypogyrification in the MDD group (online Supplementary Table S4). We found that all of the seven cortical regions, which showed significantly decreased LGIs with Cohen's f 2⩾ 0.25 in the main analysis, remained significant in three models including additional covariates.
Differences in the LGI according to clinical characteristics (recurrence, remission, medication) in the MDD group
For the secondary analysis of the comparison of the LGI between patients with first episode and recurrent MDD, the RC-MDD group showed significantly higher LGI than the F-MDD group in the right lateral occipital cortex (F (1, 227) = 17.702, p = 3.72 × 10⁻⁵, online Supplementary Table S5), which showed no significant difference in the LGI in the comparison between the MDD and HC groups in the main analysis (Table 2). In the secondary analysis regarding remission status, there was no significant difference in LGIs between remitted and non-remitted patients (online Supplementary Table S6). We also did not find a significant difference in the LGI between the DN-MDD and M-MDD groups in the secondary analysis (online Supplementary Table S7). We applied Bonferroni correction to all secondary comparisons of the LGIs within the MDD group (p < 0.000758).
As a secondary analysis, we performed correlation analysis between LGI and equivalent antidepressant dose (i.e. fluoxetine-equivalent dose) in patients with MDD including age, sex, education year, illness duration, and HDRS score as covariates. In the correlation analysis, no significant correlation remained after Bonferroni correction (online Supplementary Table S8). For the antipsychotics, we also performed correlation analysis between LGI and equivalent antipsychotic doses (i.e. olanzapine-equivalent dose) in patients with MDD using the same statistical method as for the antidepressants, and we found no significant correlation after Bonferroni correction (online Supplementary Table S9).
Correlations of illness duration and severity of depression with the LGI in the MDD group
In the secondary analysis of illness duration, LGIs in the right (r = 0.333, p = 2.49 × 10⁻⁷) and left (r = 0.285, p = 1.21 × 10⁻⁵) occipital cortex and the left inferior temporal gyrus (r = 0.238, p = 2.75 × 10⁻⁴), which showed no significant difference in the LGI in the comparison between the MDD and HC groups in the main analysis, demonstrated significant positive correlations with illness duration within the MDD group after Bonferroni correction (online Supplementary Table S10). We did not find a significant correlation between HDRS scores and LGIs within the MDD group (online Supplementary Table S10).
Discussion
In the present study, we observed that patients with MDD showed significant hypogyria in the cortical regions including the bilateral VLPFC and DLPFC, medial and lateral OFC, insula, right rostral ACC, and several temporal and parietal regions compared to HCs, with the highest effect size in the left pars triangularis. Regarding the association between clinical characteristics and LGIs within the MDD group, remission status, psychotropic medication, and severity of depression were not associated with LGIs. However, the recurrence and illness duration of MDD were associated with hypergyria in several occipital and temporal regions, which showed no significant difference in LGIs between the MDD and HC groups.
The main finding of this study was the significant degree of hypogyria observed in patients with MDD. The tension-based theory (Van Essen, Reference Van Essen1997) proposes that cortical folding is related to the forces compelling the wiring of the cortico-cortical connections of the cortical surface. On the other hand, the convolutional developmental theory (Richman, Stewart, Hutchinson, & Caviness, Reference Richman, Stewart, Hutchinson and Caviness1975) suggests that the variance in the rate of growth in the cortical layers affects the degree of cortical folding. Based on these theories, Long et al. (Reference Long, Xu, Wang, Li, Rao, Wu and Kuang2020) suggested that the decreased LGI may be an aftermath of disrupted maturation of early white matter or cortical structures.
Consistent with the abnormal cortical folding patterns observed in previous studies, we observed a significant reduction in cortical folding in the prefrontal regions (that is, VLPFC and DLPFC) (Depping et al., Reference Depping, Thomann, Wolf, Vasic, Sosic-Vasic, Schmitgen and Wolf2018), OFC (Zhang et al., Reference Zhang, Yu, Zhou, Li, Li and Jiang2009), insula (Zhang et al., Reference Zhang, Yu, Zhou, Li, Li and Jiang2009), ACC (Zhang et al., Reference Zhang, Yu, Zhou, Li, Li and Jiang2009), and several temporal and parietal regions (Chen et al., Reference Chen, Liu, Zuo, Xi, Long, Li and Yang2021; Depping et al., Reference Depping, Thomann, Wolf, Vasic, Sosic-Vasic, Schmitgen and Wolf2018; Long et al., Reference Long, Xu, Wang, Li, Rao, Wu and Kuang2020; Zhang et al., Reference Zhang, Yu, Zhou, Li, Li and Jiang2009).
Alterations in the PFC in MDD have also been reported in previous structural reports showing gray matter volume reduction in the VLPFC and DLPFC (Lener et al., Reference Lener, Kundu, Wong, Dewilde, Tang, Balchandani and Murrough2016; Wang et al., Reference Wang, Zhao, Edmiston, Womer, Zhang, Zhao and Wei2019; Zhang et al., Reference Zhang, Wei, Chang, Jiang, Tang and Wang2020). Functional MRI studies have demonstrated similar patterns of reduced cortical activity in the VLPFC (Light et al., Reference Light, Heller, Johnstone, Kolden, Peterson, Kalin and Davidson2011) and DLPFC (Murrough et al., Reference Murrough, Abdallah, Anticevic, Collins, Geha, Averill and Charney2016) of patients with MDD. The VLPFC and DLPFC have been widely explored in MDD in association with the processing of emotionally salient external cues and modulation of negative and positive emotions, potentially revealing a vital role of the PFC in the pathophysiology of MDD (Li et al., Reference Li, Friston, Mody, Wang, Lu and Hu2018; Phillips et al., Reference Phillips, Chase, Sheline, Etkin, Almeida, Deckersbach and Trivedi2015; Rive et al., Reference Rive, van Rooijen, Veltman, Phillips, Schene and Ruhé2013; Williams, Reference Williams2016).
Along with alterations in the PFC, hypogyrification has been identified in the OFC, right rostral ACC, insula, and several temporal and parietal regions. A study by Zhang et al. (Reference Zhang, Yu, Zhou, Li, Li and Jiang2009) demonstrated a very analogous pattern of hypogyrification in the mid-posterior cingulate, ACC, OFC, temporal operculum, and insula. They indicated that the altered regions of the ACC and OFC were emotion-regulation-related regions; this may be due to the cortical architecture changes caused by white matter abnormalities, as previous diffusion tensor imaging studies have revealed lower fractional anisotropy in these regions in MDD (Alexopoulos et al., Reference Alexopoulos, Murphy, Gunning-Dixon, Latoussakis, Kanellopoulos, Klimstra and Hoptman2008; Li et al., Reference Li, Ma, Li, Tan, Liu, Gong and Xu2007; Yuan et al., Reference Yuan, Zhang, Bai, Yu, Shi, Qian and You2007). Several structural and functional neuroimaging studies have identified volumetric decreases and hypoactivity in the ACC, OFC, and PFC (Carballedo et al., Reference Carballedo, Scheuerecker, Meisenzahl, Schoepf, Bokde, Möller and Frodl2011; Hooley et al., Reference Hooley, Gruber, Parker, Guillaumot, Rogowska and Yurgelun-Todd2009; Lai, Payne, Byrum, Steffens, & Krishnan, Reference Lai, Payne, Byrum, Steffens and Krishnan2000; Schlösser et al., Reference Schlösser, Wagner, Koch, Dahnke, Reichenbach and Sauer2008). Several studies have demonstrated that both environmental and genetic factors have a significant effect on gyrification patterns (Besteher, Gaser, Spalthoff, & Nenadić, Reference Besteher, Gaser, Spalthoff and Nenadić2017; Crisóstomo, Duarte, Moreno, Gomes, & Castelo-Branco, Reference Crisóstomo, Duarte, Moreno, Gomes and Castelo-Branco2021; Hasan et al., Reference Hasan, McIntosh, Droese, Schneider-Axmann, Lawrie, Moorhead and Wobrock2011; Rogers et al., Reference Rogers, Kochunov, Zilles, Shelledy, Lancaster, Thompson and Glahn2010; Schmitgen et al., Reference Schmitgen, Depping, Bach, Wolf, Kubera, Vasic and Wolf2019; White et al., Reference White, Su, Schmidt, Kao and Sapiro2010); thus, it is possible that genetic predisposition and psychosocial environmental factors, such as childhood abuse during the developmental period, might have contributed to the decreased gyrification in the emotion regulation-related cortical regions.
An expanding number of literature braces the concept that MDD is not an aftermath of an aberrant response in an individual brain region, but rather, is associated with widespread brain network dysfunction involved in emotion regulation, reward processing, cognitive control, or self-referential thinking (Li et al., Reference Li, Friston, Mody, Wang, Lu and Hu2018; Williams, Reference Williams2016). Thus, it is conceivable that the hypogyrification observed in the present study may also indicate further or prior disturbances in functional brain networks. Long et al. (Reference Long, Xu, Wang, Li, Rao, Wu and Kuang2020) investigated altered LGI and the corresponding functional connectivity in medication-free patients with MDD, and by taking altered LGI areas as seed regions for a functional connectivity analysis, they have identified corresponding aberrant functional connectivity in regions that showed decreased LGI (Long et al., Reference Long, Xu, Wang, Li, Rao, Wu and Kuang2020). Therefore, hypogyrification may be closely related to brain network dysfunction and is comprehensively compromised in patients with MDD.
Although the pattern of hypogyrification has been reported in most previous studies (Chen et al., Reference Chen, Liu, Zuo, Xi, Long, Li and Yang2021; Depping et al., Reference Depping, Thomann, Wolf, Vasic, Sosic-Vasic, Schmitgen and Wolf2018; Long et al., Reference Long, Xu, Wang, Li, Rao, Wu and Kuang2020; Zhang et al., Reference Zhang, Yu, Zhou, Li, Li and Jiang2009), several studies have reported increased LGI in patients with MDD (Han et al., Reference Han, Won, Kang, Kim, Yoon, Chang and Ham2017a; Schmitgen et al., Reference Schmitgen, Depping, Bach, Wolf, Kubera, Vasic and Wolf2019). For example, Schmitgen et al. (Reference Schmitgen, Depping, Bach, Wolf, Kubera, Vasic and Wolf2019) reported hypergyrification in the frontal, cingulate, parietal, temporal, and occipital regions in patients with MDD compared with HCs. The reason for the controversies regarding the direction of alterations in cortical gyrification is unclear. However, according to the tension-based morphogenetic hypothesis, the process of gyrification is involved in cortical connectivity and regional alterations during brain development, resulting in certain cortical folding patterns and the spatial body of the connectome (Zilles, Palomero-Gallagher, & Amunts, Reference Zilles, Palomero-Gallagher and Amunts2013). Previous cortical studies in MDD have also yielded controversies regarding the presence of both cortical thinning and thickening in MDD groups compared with HCs (Canu et al., Reference Canu, Kostić, Agosta, Munjiza, Ferraro, Pesic and Filippi2015; Fonseka, Jaworska, Courtright, MacMaster, & MacQueen, Reference Fonseka, Jaworska, Courtright, MacMaster and MacQueen2016; Grieve, Korgaonkar, Koslow, Gordon, & Williams, Reference Grieve, Korgaonkar, Koslow, Gordon and Williams2013; Liu et al., Reference Liu, Kakeda, Watanabe, Yoshimura, Abe, Ide and Korogi2015; Peng et al., Reference Peng, Shi, Li, Fralick, Shen, Qiu and Fang2015; Suh et al., Reference Suh, Schneider, Minuzzi, MacQueen, Strother, Kennedy and Frey2019). Similarly, a systematic review investigating functional connectivity in MDD reported heterogeneity in the altered frontolimbic mood regulation circuitry in patients with MDD (Helm et al., Reference Helm, Viol, Weiger, Tass, Grefkes, Del Monte and Schiepek2018). Such diversities induced by various factors, including medication, temporal dynamics of connectivity, clinical characteristics, and the presumed existence of biotypes in MDD, characterized by varying symptom combinations and patterns of functional dysconnectivity, suggest that heterogeneity not only exists regarding the combination of symptoms, but also in brain features correlated to such combinations (Drysdale et al., Reference Drysdale, Grosenick, Downar, Dunlop, Mansouri, Meng and Liston2017; Helm et al., Reference Helm, Viol, Weiger, Tass, Grefkes, Del Monte and Schiepek2018). Accordingly, as supported by the tension-based morphogenetic hypothesis, such heterogeneity in other brain features may have comprehensively stemmed from the variability in cortical folding patterns. Alternatively, sample characteristics (i.e. sample size, illness duration, and medication) may also have prompted such contradictory findings. Previous studies with contradictory results (Han et al., Reference Han, Won, Kang, Kim, Yoon, Chang and Ham2017a; Schmitgen et al., Reference Schmitgen, Depping, Bach, Wolf, Kubera, Vasic and Wolf2019), in particular, had smaller sample sizes of approximately 30–100 study populations in each group. In contrast, we were two hundred and thirty-four patients with MDD and two hundred and fifteen healthy individuals, which is noticeably greater than previous LGI studies in general. To confirm this proposition, future studies with relatively larger study populations are indispensable.
We also confirmed that there was no association between gyrification patterns and clinical characteristics, including remission status, psychotropic medication, and severity of depression. However, recurrence and illness duration of MDD were positively associated with hypergyria in several occipital and temporal regions, which showed no significant differences in the LGI between the two groups. Previous studies have reported inconsistent findings regarding the association between clinical characteristics and cortical folding. While a previous study noted a negative association of the LGI in the right superior frontal region and a positive association in the left frontal pole with illness duration (Han et al., Reference Han, Won, Kang, Kim, Yoon, Chang and Ham2017a), another study identified a negative association in the left fusiform gyrus and a positive association in the right precentral gyrus and right precuneus (Schmitgen et al., Reference Schmitgen, Depping, Bach, Wolf, Kubera, Vasic and Wolf2019). Schmitgen et al. (Reference Schmitgen, Depping, Bach, Wolf, Kubera, Vasic and Wolf2019) also revealed negative associations between cortical folding of the left fusiform gyrus and right postcentral gyrus and the number of depressive episodes.
The association between recurrence and LGI in the right lateral occipital cortex may be explained by the relationship with illness duration, because the recurrent MDD group showed significantly longer illness duration than the first-episode MDD group. For the relationship between LGI and illness duration, given that patients with MDD and a history of childhood maltreatment are more likely to have a more chronic course of the disease (i.e. longer illness duration) compared to those without (Lippard & Nemeroff, Reference Lippard and Nemeroff2020), one possible explanation is that early psychosocial environmental factors such as childhood abuse or neglect, which were not assessed in the present study, may mediate the positive correlation between illness duration and LGI, independent of the impact of MDD on the cortical folding pattern (i.e. MDD-related hypogyrification). Our recent study on childhood abuse and gray-matter volume changes reported that childhood sexual abuse was associated with decreased cortical volume in the right middle occipital gyrus, which belongs to the lateral occipital gyrus in the Desikan–Killiany atlas, regardless of MDD diagnosis (Kim et al., Reference Kim, An, Han, Kang, Bae, Tae and Han2023). However, we cannot provide a clear explanation as to why this correlation had a positive direction or significant findings in other regions (i.e. the left inferior temporal gyrus). Further studies are required to resolve this issue. Various factors, including study sample characteristics, may have induced such variations in the association between the clinical characteristics and LGI. In addition, in the present study, the cortical regions identified as having positive correlations with recurrence and illness duration were not significantly different between the MDD and HC groups. This suggests that hypogyria in the MDD group may reflect trait factors associated with the pathophysiology of MDD rather than the state of MDD. Large longitudinal studies are necessary to validate this hypothesis and examine the predictive values of such neurodevelopmental parameters, with respect to the longitudinal aspects of MDD (Choi et al., Reference Choi, Han, Kim, Kang, Kang, Tae and Ham2022; Schmitgen et al., Reference Schmitgen, Depping, Bach, Wolf, Kubera, Vasic and Wolf2019).
Recently, researchers have hypothesized that MDD has a neurodevelopmental origin (Ansorge et al., Reference Ansorge, Hen and Gingrich2007; Gałecki & Talarowska, Reference Gałecki and Talarowska2018; Lima-Ojeda et al., Reference Lima-Ojeda, Rupprecht and Baghai2018; Martin et al., Reference Martin, Asjadi, Hubbard, Kendall, Pardiñas, Jermy and O'Donovan2021). From this perspective, it has been proposed that MDD is formed through a combination of genetic and environmental factors during an individual's developmental process. Environmental factors have been shown to influence the morphology of brain circuits from the perspective of neuroplasticity (Bernardoni et al., Reference Bernardoni, King, Geisler, Birkenstock, Tam, Weidner and Ehrlich2018; Besteher et al., Reference Besteher, Gaser, Spalthoff and Nenadić2017; Hasan et al., Reference Hasan, McIntosh, Droese, Schneider-Axmann, Lawrie, Moorhead and Wobrock2011; Mishra, Patni, Hegde, Aleya, & Tewari, Reference Mishra, Patni, Hegde, Aleya and Tewari2021; White et al., Reference White, Su, Schmidt, Kao and Sapiro2010). Therefore, our findings may imply genetic heritability, which interacts with psychosocial environmental factors, inducing early neurodevelopment in abnormal cortical folding patterns principally in the PFC, OFC, ACC, and insula, ultimately leading to a dysfunction in emotion regulation neural circuits as a predisposition to MDD. Previous studies have reported a presence of significant basis in shared genetic factors in phenotypic local correlation and a strong correlation with the degree of local cortical folding suggesting a patterned genetic influences on the development of cortical folding (Alexander-Bloch et al., Reference Alexander-Bloch, Raznahan, Vandekar, Seidlitz, Lu, Mathias and Glahn2020; Llinares-Benadero & Borrell, Reference Llinares-Benadero and Borrell2019; van der Meer et al., Reference van der Meer, Kaufmann, Shadrin, Makowski, Frei, Roelfs and Dale2021). In a study canvassing the genetic architecture of human cortical folding (van der Meer et al., Reference van der Meer, Kaufmann, Shadrin, Makowski, Frei, Roelfs and Dale2021), an evolutionary significance of cortical folding was emphasized proposing an interplay between mechanical forces and cellular mechanisms via mutations of genes primarily coupled to cell cycling and neurogenesis in human cortical folding and have additionally identified higher heritability of cortical folding compared to other cortical features.
Although the LGI has not yet been extensively explored, it has long been considered a cytoarchitectural parameter influenced by the microstructure of neuronal sheets and axonal connectivity (Richman et al., Reference Richman, Stewart, Hutchinson and Caviness1975; Van Essen, Reference Van Essen1997; White et al., Reference White, Su, Schmidt, Kao and Sapiro2010). As an index of cortical complexity, the LGI has been noted to reveal the underlying structural configuration of the brain, potentially shedding light on the evolutionary aspect of MDD influenced by early neurodevelopment (Choi et al., Reference Choi, Han, Kim, Kang, Kang, Tae and Ham2022; Kelly et al., Reference Kelly, Viding, Wallace, Schaer, De Brito, Robustelli and McCrory2013). Previous studies have identified close associations between the LGI and functional connectivity, providing a neural basis for the reciprocated disrupted functional connectivity observed with altered gyrification patterns (Hou, Zhang, Huang, & Zhou, Reference Hou, Zhang, Huang and Zhou2022; Long et al., Reference Long, Xu, Wang, Li, Rao, Wu and Kuang2020; Palaniyappan & Liddle, Reference Palaniyappan and Liddle2014). Therefore, from a neurodevelopmental perspective, the LGI may be a more reliable indicator of vulnerability to MDD than other neuroimaging markers (Libero, Schaer, Li, Amaral, & Nordahl, Reference Libero, Schaer, Li, Amaral and Nordahl2019). Specifically, as a stable marker of vulnerability to MDD, the LGI may potentially serve as a tool for the early diagnosis of high-risk groups who have not yet developed MDD but are at greater risk of doing so. Nonetheless, a longitudinal study design in the future is crucial for deeper insight into the mechanism underlying the pathophysiology of MDD and cortical folding patterns. Considering the complexity of the pathophysiology of MDD, the comprehensive use of LGI with other imaging markers could facilitate further understanding and determination of MDD.
In addition, while we have not directly compared LGI between patients with MDD and BD, compared with our previous study reported decreased cortical gyrification patterns in patients with BD (Choi et al., Reference Choi, Han, Kim, Kang, Kang, Tae and Ham2022), we found that in patients with MDD, hypogyrification was mostly centered around the PFC. Although, no study to the best of our knowledge, has directly compared and reported differences in LGI between MDD and BD, the differences in cortical folding patterns between MDD and BD may be partially explained by findings from previous studies using other neuroimaging features and their contrasting disease traits. Previous structural MRI studies have found reduced gray matter volume in the PFC, particularly in the DLPFC, in patients with MDD (Bora, Fornito, Pantelis, & Yücel, Reference Bora, Fornito, Pantelis and Yücel2012; Chang et al., Reference Chang, Yu, McQuoid, Messer, Taylor, Singh and Payne2011; Salvadore et al., Reference Salvadore, Nugent, Lemaitre, Luckenbaugh, Tinsley, Cannon and Drevets2011; Ye et al., Reference Ye, Peng, Nie, Gao, Liu, Li and Shan2012; Zhao et al., Reference Zhao, Du, Huang, Lui, Chen, Liu and Gong2014). In contrast, several previous studies have reported increased gray matter volume in the PFC of patients with BD (Adler, Levine, DelBello, & Strakowski, Reference Adler, Levine, DelBello and Strakowski2005; Bora, Fornito, Yücel, & Pantelis, Reference Bora, Fornito, Yücel and Pantelis2010; Moore et al., Reference Moore, Cortese, Glitz, Zajac-Benitez, Quiroz, Uhde and Manji2009). Furthermore, magnetic resonance spectroscopy studies in MDD groups have found decreased levels of glutamate in the PFC, whereas patients with BD have been found to have elevated levels of glutamate in the PFC, particularly during manic episodes (Abdallah et al., Reference Abdallah, Jackowski, Sato, Mao, Kang, Cheema and Shungu2015; Frye et al., Reference Frye, Watzl, Banakar, O'Neill, Mintz, Davanzo and Thomas2007; Karolewicz et al., Reference Karolewicz, Maciag, O'Dwyer, Stockmeier, Feyissa and Rajkowska2010; Michael, Erfurth, & Pfleiderer, Reference Michael, Erfurth and Pfleiderer2009; Michael-Titus, Bains, Jeetle, & Whelpton, Reference Michael-Titus, Bains, Jeetle and Whelpton2000; Shirayama, Takahashi, Osone, Hara, & Okubo, Reference Shirayama, Takahashi, Osone, Hara and Okubo2017). Previous studies have found associations between glutamate levels, cortical folding, and functional connectivity (Kapogiannis, Reiter, Willette, & Mattson, Reference Kapogiannis, Reiter, Willette and Mattson2013; Thomson et al., Reference Thomson, Duff, Blackwood, Romaniuk, Watson, Whalley and Lawrie2016; Wang et al., Reference Wang, Zhang, Zhang, Wang, Xu, Li and Zhang2018), and the imbalance in the glutamate level may also potentially have contributed to such differences in the alteration patterns of the LGI in the two groups. Nevertheless, future studies directly comparing cortical folding in MDD and BD would best reveal the exact relationship between the two groups.
Despite these strengths, the present study has several limitations. This was a cross-sectional study, which could not determine the causal relationship between hypogyria in specific cortical regions and the development of MDD. We suggest that longitudinal studies should be designed in the future to fully understand the developmental changes in the LGI in patients with MDD. Furthermore, although no significant association was identified between psychotropic medication and the LGI in the MDD group, we cannot deny the potential influence of medications in the cortical folding patterns, as patients under medications were included in the study. Furthermore, the present study did not include psychosocial environmental factors such as childhood adversity, including abuse, neglect, and trauma, which could affect early neurodevelopment and ultimately alter cortical folding patterns (Choi et al., Reference Choi, Han, Kim, Kang, Kang, Tae and Ham2022; Kelly et al., Reference Kelly, Viding, Wallace, Schaer, De Brito, Robustelli and McCrory2013).
In conclusion, we identified significant hypogyria in the bilateral VLPFC and DLPFC, medial and lateral OFC, insula, right rostral ACC, and several temporal and parietal regions in patients with MDD compared to HCs. Given that these cortical regions have been revealed to play an important role in emotion regulation by numerous neuroimaging studies, abnormal cortical folding patterns may be associated with dysfunction of emotion regulation-related neural circuits. Furthermore, we suggest that the LGI may be a relatively stable neuroimaging marker associated with predisposition to MDD. We hope that our findings will provide a deeper understanding of the neurodevelopmental aspects of structural brain variations and the pathophysiology of MDD.
Supplementary material
The supplementary material for this article can be found at https://doi.org/10.1017/S0033291723001216
Acknowledgements
None.
Financial support
This work was supported by the National Research Foundation of Korea (NRF) grant funded by the Korea government (MSIT) (No. 2022R1A2C4001313; 2020M3E5D9080792; 2022R1A2C2093009).
Conflict of interests
The authors have no potential or actual conflicts of interest.
Ethical standards
The authors assert that all procedures contributing to this work comply with the ethical standards of the relevant national and institutional committees on human experimentation and with the Helsinki Declaration of 1975, as revised in 2008.