I. INTRODUCTION
Copper and its alloys are the preferred materials in many fields due to their good ductility, corrosion resistance, thermal conductivity, and electrical conductivity. Aluminum and its alloys, being one of key lightweight structural materials with low density, high specific strength, good thermal conductivity, and electrical conductivity, are desirable for structural components in the automotive and aerospace structures. Kahl and Osikowicz have shown that copper and copper alloys are the preferred materials for electrical conductors. Reference Kahl and Osikowicz1 Recently, interest in joining dissimilar aluminum-to-copper joints with good mechanical and electrical properties has strongly increased due to the low cost of aluminum and its capacity of carrying, roughly twice as much electrical current per mass unit. Therefore, in some applications, copper parts can be partly replaced by aluminum parts. For example, partial copper leadframes or busbar systems in automotive and industrial systems will be replaced by aluminum leadframes or busbars. Thus, it is very important to develop the feasible welding method to join these two dissimilar metals.
However, there are great difficulties to obtain an effective dissimilar joint of Cu/Al. Reference Henryk, Lidia and Mariusz2–Reference Xu, Liu and Chen4 It is mainly due to the great differences in their chemical and physical properties, and the large amount of brittle Al m Cu n intermetallic compounds (IMCs) which is detrimental to the mechanical properties of the joints. Therefore, it is essential to control the formation and growth of Al–Cu IMCs.
The joining of Cu/Al has been carried out by various welding methods, such as explosion welding, laser beam welding, and friction stir welding (FSW). Henryk et al. joined Cu and Al by explosion welding and reported that in microscale, the interfaces layers were mainly composed of three crystalline, equilibrium phases—Cu9Al4, CuAl, and CuAl2. Reference Henryk, Lidia and Mariusz2 During the bond formation, the layers of parent sheets near the interfaces underwent intense plastic deformation. Consequently, deformation microstructure features, i.e., structure refinement, equiaxed, or elongated dislocation cells, slip bands, and (micro) twins (in copperplate) were observed. Reference Henryk, Lidia and Mariusz2 Weigl et al. joined dissimilar Cu/Al connections by laser welding method with AlSi12 and CuSi3 filler materials. Reference Weigl, Albert and Schmidt3 Results indicated that in contrast to direct Cu–Al welds, the ductility of Cu–Al joint with AlSi12 filler material was significantly enhanced due to a more uniform element mixture and the decrease of the brittle phases. Reference Weigl, Albert and Schmidt3 Xu et al. investigated material flow and core/multishell structures in a friction stir welded aluminum alloy with embedded copper markers. Reference Xu, Liu and Chen4 Results showed that a unique core/multishell microstructure consisting of copper core, inner shell of AlCu and outer shell of Al2Cu can be formed between the copper marker and aluminum matrix due to the interdiffusion between copper and aluminum atoms coupled with the intense plastic deformation. Reference Xu, Liu and Chen4 Abdollah-Zadeh et al. joined 1060 aluminum alloy to a commercially pure copper joint by friction stir lap welding method. Reference Abdollah-Zadeh, Saeid and Sazgari5 Optimum mechanical properties can be obtained by adjusting the rotational speed and welding speed. The hard and brittle intermetallic phases Al4Cu9, AlCu, and Al2Cu which were formed in Cu/Al interface at various rotational speeds and various welding speeds affected the shear strength of the joint. Reference Abdollah-Zadeh, Saeid and Sazgari5 Jean et al. joined aluminum and copper by diffusion welding, hybrid friction diffusion bonding as well as FSW methods, the formation, evolution of the interface layer and effect of the interface layer between aluminum and copper on properties were revealed. Reference Jean Pierre, Franziska, Renè and Stefan6 Saeida et al. obtained lap joints of 1060 aluminum alloy and commercially pure copper by FSW and investigated the effects of welding speed on interface morphology, microstructure, and joint strength. Results indicated that the maximum tensile shear strength of Al–Cu lap FSW joint reached 2.6 kN at a welding speed of 95 mm/min. Reference Saeida, Abdollah-zadehb and Sazgarib7 IMCs of Al4Cu9 and Al2Cu were formed in the interface, which corresponds to the findings of Ouyang et al. Reference Ouyang, Yarrapareddy and Kovacevic8 Akbari et al. indicated that intermediate layer between copper and aluminum workpieces can effectively enhance metallurgical and mechanical properties of friction stir lap welding of Cu/Al. Reference Akbari, Bahemmat, Haghpanahi and Besharati Givi9 By using the copper anodized layer, the peak shear strength of welds can reach 4.67 kN, while welds without intermediate layer can merely reach 4 kN. This distinction was mainly due to the use of the copper anodized layer, which can prevent the formation of brittle IMCs and, as a result, improve the mechanical properties of Cu/Al joints. Reference Akbari, Bahemmat, Haghpanahi and Besharati Givi9 Similar studies were also carried out by Elrefaey et al., Reference Elrefaey, Takahashi and Ikeuchi10 they thought that Zn possibly reduced the formation of Al–Cu IMCs and thereby reinforced the mechanical properties of Cu/Al joints. Reference Elrefaey, Takahashi and Ikeuchi10 Firouzdor et al. studied microstructure and properties of revised Al-to-Cu lap FSW. Modified lap FSW was used to butt weld a small piece of 6061 Al to Cu at the top, with a slight pin penetration into the 6061 Al at the bottom. Reference Firouzdor and Kou11 At travel speeds up to 127 mm/min (5 ipm), the modified welds can be much better than the conventional lap welds—about twice higher in the joint strength and five to nine times higher in ductility. Reference Firouzdor and Kou11
Cold metal transfer (CMT) technology is a revolutionary innovation in the development of digital welding technology and low energy. It firstly achieves the integration of the motions of the wire into the joining process and into the overall control of the process. During the short circuit, without the aid of the electromagnetic force, droplet detachment can be smoothly transferred by the wire retraction motion. As a consequence, the heat input, spatter can be decreased greatly and the formation of IMCs can be minimized. Moreover, Al–steel, Mg–Ti, Al–Ti, Mg–Al dissimilar metal joinings have systematically studied by CMT method and other welding methods. Reference Cao, Sun, Chen and Wang12–Reference Wang, Gu, Sun and Xi18
Based on above studies, to reduce the formation of IMC and increase the mechanical properties, CMT process with low energy was used to lap weld AA6061-T6 and pure copper T2 with 4043 aluminum wire. The influence of different overlapping configurations on the weld appearance and the stability of welding process were discussed. Further, the microstructures, mechanical properties, and fracture analysis of the joints were studied.
II. EXPERIMENTAL PROCEDURE
A. Materials
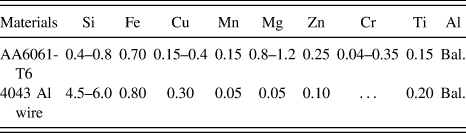
Aluminum alloy AA6061-T6 and pure copper T2 with a thickness of 1 mm were used in this study. 4043 aluminum wire with a diameter of 1.2 mm was selected as the filler metal in this study. Table I presents the nominal chemical composition of aluminum AA6061-T6 sheet and 4043 aluminum wire. Table II shows the chemical composition of pure copper T2. For the purpose of avoiding the influence of the surface contamination, prior to welding the copper sheet was only degreased by acetone and tap water. However, to avoid porosity produced in the welding processes, the Al sheet was degreased by acetone first, and then polished by abrasive cloth followed by cleaning with 5–10% NaOH solution at a temperature range of 40–70 °C for 3–7 min, and rinsed with tap water. This was followed by surface cleaning with 30% HNO3 solution at a temperature of 60 °C for 1–3 min and then rinsing with tap water.
Chemical compositions of aluminum alloy and wire (wt%).

Chemical compositions of pure copper T2 (wt%).

B. Sample fabrication
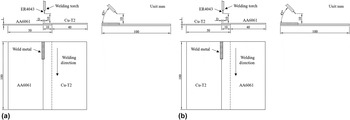
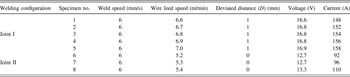
Referred to Fig. 1, lap-shear joint configurations were fabricated from 100 × 50 mm sheets. As shown in Fig. 1, two different configurations of AA6061-T6 to Cu-T2 joints were performed in the experiment with an overlap distance of 10 mm. The arrangement of the test sheets with respect to the weld torch was shown in Fig. 1. The Cu–Al joint presented that the Cu-T2 sheet was placed on the top of the AA-6061 sheet as shown in Fig. 1(a), and the Al–Cu joint presented that the AA-6061 sheet was placed on top of the Cu-T2 sheet as shown in Fig. 1(b). The angle between the welding torch and the lap seam was 45° away from the direction of welding. The welding direction was parallel to the lap seam and is offset from the edge of the Al sheet edge by a deviation distance (D). A Fronius arc welding system (CMT 3200, Fronius, Pettenbach, Austria) was used to fabricate the samples. Welding variables in Table III were changed to obtain sound weld appearance and satisfied mechanical properties. A 100% argon shielding gas with a flow rate of 15 L/min was used throughout the experiments.
Schematic diagrams of CMT welding of aluminum alloy AA6061-T6 and copper T2 sheets (dimensions in mm): (a) welding assembly schematic diagram of Cu–Al joint (top Cu sheet–bottom Al sheet), (b) welding assembly schematic diagram Al–Cu joint (top Al sheet–bottom Cu sheet).

Welding parameters.

C. Analysis of bonding mechanisms
To examine the quality of CMT Al–Cu joints, the cross-sections of the specimens were prepared and examined. The polished aluminum and copper workpieces were directly observed and analyzed by scanning electron microscope (SEM; Quanta FEG-450, FEI Company, Hillsboro, Oregon) equipped with a backscattered electron detector. The analyses of element distributions of the welds were carried out by energy dispersive x-ray spectrometer (EDS).
D. Mechanical testing
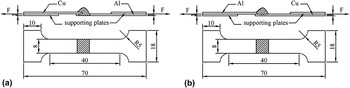
Three specimens in Fig. 2 machined from each weldment were subjected to quasi-static testing at room temperature in a CSS-2205 mechanical tester (Changchun Institute of Mechanical Science Co., Ltd., Changchun, China). To minimize inherent bending stresses in the testing of lap-shear specimens, supporting plates were attached to both ends of the specimens using masking tape to accommodate the sample offset. Load versus displacement curves were obtained at a loading rate of 1 mm/min. The joint strength was evaluated by the peak load. Three replicates were performed, and the average peak loads were reported. The fractured surface of the tensile sample was analyzed by SEM.
Specimens machined from welded AA6061 to Cu T2 sheets (dimensions in mm): (a) Cu–Al joint (top Cu sheet–bottom Al sheet), and (b) Al–Cu joint (top Al sheet–bottom Cu sheet).

III. RESULTS AND DISCUSSION
A. Macro features of welded Cu–Al joint and Al–Cu joint
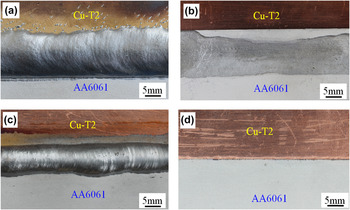
Firstly, to investigate the weldability of AA6061-T6 to Cu-T2 joints, the weld appearances of the joints were examined in Fig. 3. As shown in Fig. 3(a), Cu–Al joint has good wettability and spreadability at the deviated distance of 1 mm, wire feed speed of 6.5–7.0 m/min and the welding speed of 6 mm/s. For Al–Cu joint with a deviated distance of 0 mm, wire feed speed of 5.0–5.5 m/min, and the welding speed of 6 mm/s, good weld appearance can be also obtained as shown in Fig. 3(c). By comparison of the back side of Cu–Al joint and Al–Cu joint in Figs. 3(b) and 3(d), it can be clearly seen that the molten Al sheet for Cu–Al joint was larger than the molten Cu sheet for Al–Cu joint, which can be explained by the heat input and the difference of thermal conductivity between aluminum and copper. To further analyze the weldability of Cu/Al, the microstructures and properties of Cu/Al joints under two different joints will be discussed in detail.
Macro features of the welded joints: (a) top view of Cu–Al joint (top Cu sheet–bottom Al sheet), (b) back view of Cu–Al joint (top Cu sheet–bottom Al sheet), (c) top view of Al–Cu joint (top Al sheet–bottom Cu sheet), and (d) back view of Al–Cu joint (top Al sheet–bottom Cu sheet).

B. Microstructures of welded Cu–Al joint
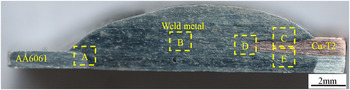
Figure 4 shows the macroscopic cross-section of Cu–Al joint (top Cu sheet–bottom Al sheet), which was welded at the wire feed speed of 7.0 m/min and the deviated distance of 1 mm (sample #5 in Table III). As shown in Fig. 4, Cu–Al joint was composed of three zones, aluminum-weld metal brazed interface zone A which was formed between Al base metal and weld metal, weld metal zone B, and copper-weld metal brazed interface zones C, D, and E which was formed by molten weld metal and partially molten Cu base metal.
Macroscopic cross section of Cu–Al joint (top Cu sheet–bottom Al sheet) welded under the wire feed speed of 7.0 m/min and the D of 1 mm (sample #5).

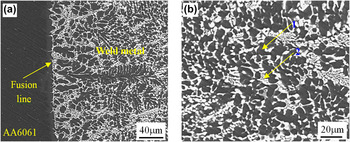
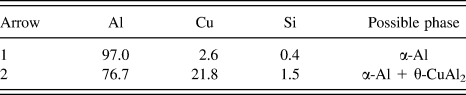
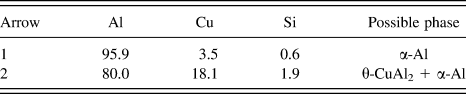
Figures 5 and 6 show the microstructures of different regions of sample #5 for Cu–Al joint (top Cu sheet–bottom Al sheet). Figure 5(a) presents the microstructures of Al base metal-weld metal brazed interface zone (region A in Fig. 4), and an obvious fusion line can be seen. Columnar crystals, which grew into the weld metal, were distributed in the fusion line near Al base metal side, because the molten metal solidified along the maximum negative-temperature gradient from base metal into the middle of the weld pool. Reference Sindo20 As shown in Fig. 5(b), the microstructures of weld metal (region B in Fig. 4), were composed of gray and black color α-Al solid solution (denoted by arrow 1) and α-Al and CuAl2 eutectic phase (denoted by arrow 2) with white color and coral shape. These phases were analyzed by EDS in Table IV.

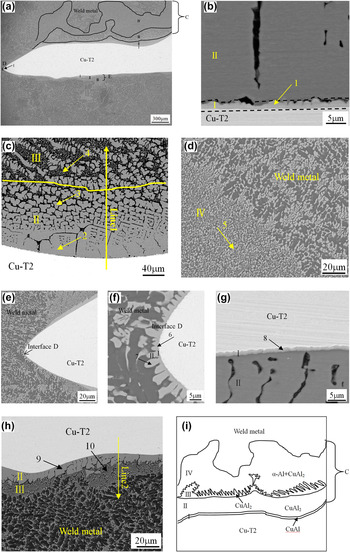
Microstructures of copper-weld interface between the weld metal and Cu-T2 base metal with Cu–Al joint: (a) lower magnification of C, D and E zones in Fig. 4, (b) higher magnification of I and II regions at zone C in (a), (c) higher magnification of II and III regions at zone C in (a), (d) higher magnification of region IV at zone C in (a), (e) higher magnification of zone D in (a), (f) higher magnification of I and II regions at zone D in (a), (g) higher magnification of I and II regions at zone E in (a), (h) higher magnification of II and III regions at zone C in (a), (i) schematic phase distribution of zone C in (a).

Chemical compositions of various phases in Fig. 5 (at.%).

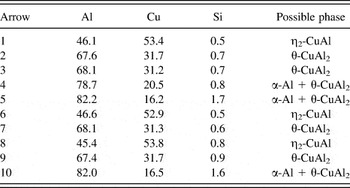
The microstructures of copper-weld metal interface zones C, D, and E in Fig. 4 were magnified in Fig. 6(a). To analyze conveniently the constituents of these phases in these interfaces, the copper-weld metal interface zones C, D, and E in Fig. 6(a) were also magnified, respectively, in Figs. 6(b)–6(h). Based on the Al–Cu binary phase diagram, SEM–EDS was used to analyze the chemical compositions of each phase (denoted by arrow 1–8 in Fig. 6) and the possible phases were listed in Table V. From Fig. 6(a), the copper-weld metal interface C was composed of four zones of zone I, II, III, and V, interface D was only composed of zones I and II, and interface E was composed of three zones of I, II, and III. The microstructures of zones I, II, III, and V in the interface C was magnified, respectively, in Figs. 6(b)–6(d). The microstructures of zones I and II in the interface D was magnified, respectively, in Figs. 6(e) and 6(f). The microstructures of zones I, II, and III in the interface E was magnified, respectively, in Figs. 6(g) and 6(h). From Fig. 6(b), the zone I in the interface C was mainly composed of phase η2-CuAl denoted by region 1, which was identified by EDS in Table V. The zone II in the interface C was mainly composed of phase θ-CuAl2 denoted by region 2, which was identified by EDS in Table V. The zone III in the interface C was mainly composed of phase θ-CuAl2 denoted by region 3 and α-Al solid solution denoted by region 4 in Fig. 6(c) and Table V. The zone V in the interface C was mainly composed of α-Al and θ-CuAl2 eutectic phase denoted by region 5 in Fig. 6(d) and Table V. To further show the detailed compositions in the interface C, the schematic figure in the interface C was redrawn in Fig. 6(i). From Cu-T2 base metal to weld metal, transition interface C was changed from intermetallic η2-CuAl, intermetallic θ-CuAl2 to α-Al and θ-CuAl2 eutectic phase. The thickness of the interface layer C was changed at various locations, and reached 200–750 μm. The interface D in Figs. 6(a), 6(e), and 6(f) was composed of layer I with 1 μm thick η2-CuAl intermetallic denoted by region 6 and layer II with a 5–10 μm thick θ-CuAl2 intermetallic denoted by region 7. The interface E in Figs. 6(a), 6(g), and 6(h) was composed of layer I with 1 μm thick η2-CuAl intermetallic denoted by region 8, layer II with 20 μm thick intermetallic θ-CuAl2 denoted by region 9, and layer III with 25–40 μm thick eutectic phase of α-Al solid solution and θ-CuAl2 denoted by region 10. By comparison, it can be seen that the copper-weld metal interface zones C, D, and E were composed of various IMC layers, which can be also identified by the result of transmission electron microscopy for an ultrasonically consolidated copper–aluminum interface. Reference Sietins, Gillespie and Advani21 But one thinner and smoother interface layer near Cu base metal with the thickness of 1 μm is common, such as region 1 in Fig. 6(b), region 6 in Fig. 6(f), and region 8 in Fig. 6(g), was composed of intermetallics η2-CuAl with sawtooth or tubular structure in Table V. The second layer between the third and the first layer was composed of θ-CuAl2 intermetallics with block or columnar structure, which were denoted by region 2 in Fig. 6(c), region 7 in Fig. 6(f) and region 9 in Fig. 6(h). Except there are the same layers I and II in the interfaces C, D, E, the features in the third layer are different. Because in the interface D in Figs. 6(e) and 6(f), only layer I and layer II were distributed between the weld metal and local molten copper base metal. For interfaces C and E, the same eutectic phase of α-Al and θ-CuAl2 can be found in the layer III. But, the thickness is different. However, the fourth layer between weld metal and third layer was only seen in the interface C in Figs. 6(a) and 6(d). Though some same phases can be found in the interfaces C, D, and E, their morphologies and thickness of the IMC layer were vastly different due to different temperature gradients and interfacial reaction times during the welding processes. From Fig. 6, the thicknesses of several IMCs layer at copper-weld interface zones of C, D, and E were about 550–750 μm, 3–10 μm and 40–65 μm, respectively. Compared with copper-weld interfaces of D and E, the thickness of IMCs layer at the C interface was the thickest among the three copper-weld interfaces, which was induced by the higher temperature and longer interfacial reaction time in copper-weld interface zone C. In addition, deviated distance D (1 mm) in the copper side can further strengthen this phenomenon. These results in this study were consistent with the results of the study on Ti–Al, Ti–Cu CMT joints in Cao et al. Reference Cao, Sun and Chen14,Reference Cao, Feng and Chen19 Aydin et al. also found that the thickness of IMCs layer was different during different temperature and reaction times. Reference Aydin, Kaya and Kahraman22 In a word, three copper-weld interfaces were mainly composed of CuAl and CuAl2 intermetallics, which are consistent with Refs. Reference Henryk, Lidia and Mariusz2–Reference Abdollah-Zadeh, Saeid and Sazgari5.
Chemical compositions of various phases in Fig. 6 (at.%).

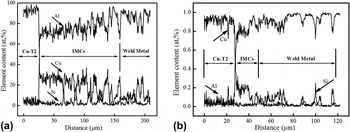
To further demonstrate the generation of Cu/Al IMCs, line scanning analysis along the scanning lines 1 and 2 in Figs. 6(c) and 6(h) were carried out and presented in Fig. 7. From the result of Fig. 7(a), the content of Cu element decreased gradually while the change of the content of Al was properly opposite. And this phenomenon demonstrated that a strong interfacial reaction was existed between weld metal and local molten Cu base metal, which led to the formation of IMCs layer including CuAl and CuAl2. By comparison of Figs. 7(a) and 7(b), it is manifest that the thickness of IMCs layer in interface C and E was different because of the difference of temperature field and reaction time in interface C and interface E.

C. Microstructures of welded Al–Cu joint
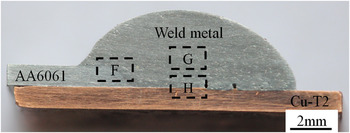
To further investigate the joining mechanisms of Al–Cu joint, the microstructures of Al–Cu joint were also analyzed. Figure 8 presents the macroscopic cross-section of Al–Cu joint (top Al sheet–bottom Cu sheet) with the wire feed speed of 5.4 m/min and the D of 0 mm (sample #8 in Table III). Similarly with Cu–Al joint, as shown in Fig. 8, Al–Cu joint was also composed of three zones, aluminum-weld metal interface zone F, which was produced between Al base metal and weld metal, weld metal zone G, and copper-weld metal interface zone H, which was formed by molten weld metal and locally molten Cu base metal. However, Al–Cu joint, compared with Cu–Al joint, has only one copper-weld interface zone H.
Macroscopic cross section of Al–Cu joint (top Al sheet–bottom Cu sheet) welded under the wire feed speed of 5.4 m/min and the D of 0 mm (sample #8).

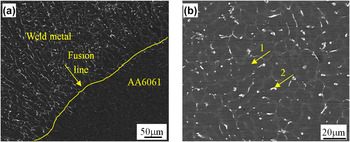
The microstructures of various regions of sample #8 for Al–Cu joint (top Al sheet–bottom Cu sheet) were shown by Figs. 9 and 10. Figure 9(a) presents the similar microstructures of aluminum-weld metal interface zone (region F in Fig. 8) with Fig. 5 in Cu–Al joint. An obvious fusion line and columnar crystals were both observed. The microstructures of weld metal, as shown in Fig. 9(b) (region G in Fig. 8), were also composed of gray and black α-Al solid solution (denoted by arrow 1) and white α-Al and CuAl2 eutectic phase (denoted by arrow 2). However, compared with Cu–Al joint, the amount of α-Al and CuAl2 eutectic phase and its size in the weld metal of Al–Cu joint greatly decreased, which can be explained by decrease of molten Cu base metal in the weld metal due to the change of heat dissipation and decrease of heat input. Table VI exhibits the chemical compositions of these phases by EDS.

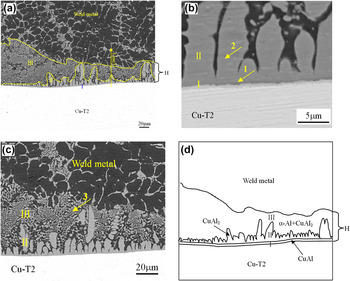
Microstructures of copper-weld interface between the weld metal and Cu-T2 base metal with Al–Cu joint (top Al sheet–bottom Cu sheet): (a) higher magnification of zone H in Fig. 8, (b) higher magnification of I and II regions at zone H in (a), (c) higher magnification of II and III regions at zone H in (a), (d) schematic phase distribution of zone H in (a).

Chemical compositions of various phases in Fig. 9 (at.%).

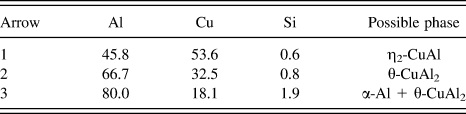
Figure 10 shows the microstructures of copper-weld metal interface zone H in Fig. 8. Combined with the Al–Cu binary phase diagram, the chemical compositions of each phase (denoted by arrows 1–3 in Fig. 10) were analyzed by SEM and EDS and the results were given in Table VII. In Fig. 10, interface zone H was also composed of layer I, layer II, and layer III. From Figs. 10(a) and 10(b), the first layer I distributed between copper base metal and the second layer II was composed of η2-CuAl intermetallic denoted by region 1 in Table VII. The second layer in Figs. 10(a) and 10(b) was composed of θ-CuAl2 intermetallic denoted by region 2 in Table VII. The third layer located between the second layer and weld metal was composed of α-Al and θ-CuAl2 denoted by region 3. To further reveal the compounds of the interface H of Al–Cu joint, corresponded schematic was also redrawn in Fig. 10(d). Compared with Cu–Al joint, interfacial components near the weld metal side was same. However, the total thickness of IMCs layer between local molten copper base metal and the weld metal was about 30–90 μm, which was much smaller than the total thickness of IMCs layer of zone C (200–750 μm) shown in Fig. 6(a). In conclusion, copper-weld metal interface H was also mainly composed of CuAl and CuAl2. It is worth emphasizing that, compared with Cu–Al joint, the distinction is the morphology of CuAl2 phase, which presents the transition from the block or columnar structure to single columnar structure.
Chemical compositions of various phases in Fig. 10 (at.%).

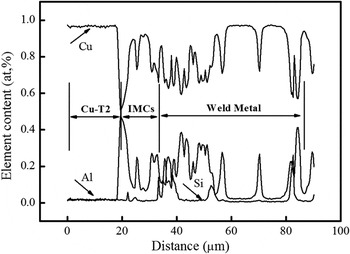
As shown in Fig. 11, EDS line analysis was undertaken to confirm the distribution of elements Cu, Al, and Si at the copper-weld metal interface. From Fig. 11, it can be found that from the Cu base metal to the weld metal, the content of Cu element decreased gradually while the content of Al element increased oppositely within certain limits, which revealed the generation of CuAl and CuAl2 from another view.
Results of line scanning analysis alone line 3 in Fig. 10(a) in copper-weld interface K of Al–Cu joint (top Al sheet–bottom Cu sheet).

D. Mechanical properties and fracture analysis of Cu–Al joint and Al–Cu joint
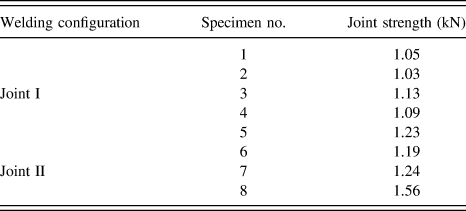
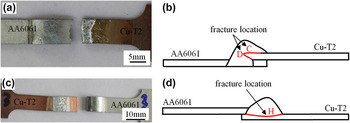
To further characterize the tensile load of Cu–Al joint and Al–Cu joint, mechanical tests were conducted and the results were shown in Table VIII. For Cu–Al joint and Al–Cu joint, their optimum joint load were 1.23 kN (sample #5) and 1.56 kN (sample #8), respectively. As shown in Fig. 12, the Cu–Al joint (sample #5) was fractured at the copper-weld metal interface zone C [presented in Figs. 4 and 6(a)], and the Al–Cu joint (sample #8) was also fractured at the copper-weld metal interface zone H [presented in Figs. 8 and 10(a)]. To further analyze the reason of sample #5 and sample #8 fractured at the same copper-weld interface zone, microhardness distribution of joints and fracture analysis were followed.
Strength of the welded AA6061-T6 to Cu-T2 joints.

Fractography of welded AA6061 to Cu-T2 specimen (#5) of Cu–Al joint and specimen (#8) of Al–Cu joint: (a) fractured specimen (#5), and (b) schematic of the fracture location, (c) fractured specimen (#8), and (d) schematic of the fracture location.

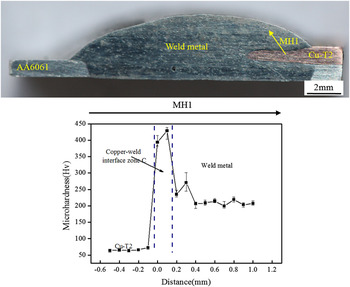
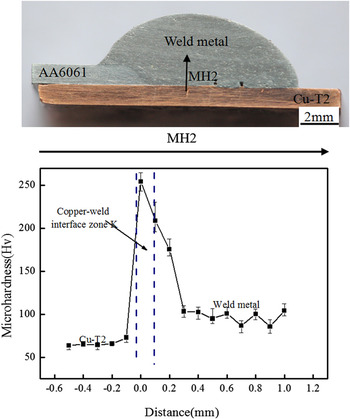
Figures 13 and 14 present the schematic location of microhardness analysis and results along the line MH1 in Fig. 13(a) and along the line MH2 Fig. 14(a) for the specimen #5 and #8 near the copper-weld interface zones of C [presented in Figs. 4 and 6(a)] and H [presented in Figs. 8 and 10(a)], respectively. From Fig. 13, the microhardness of Cu base metal and weld metal were around 70 HV and 200 HV, respectively. However, the microhardness of the copper interface zone C [presented in Figs. 4 and 6(a)] near the Cu base metal can reach up to around 430 HV. Similarly, as shown in Fig. 14, the microhardness of Cu base metal and weld metal were around 70 HV and 100 HV, respectively. However, the microhardness of the copper interface zone H [presented in Figs. 8 and 10(a)] near the Cu base metal can be up to a microhardness of 280 HV. These results have a close correlation with the generation of a large amount of Cu/Al IMCs, especially for the copper interface zone C [presented in Figs. 4 and 6(a)] of Cu–Al joint. In addition, the high microhardnesses were both measured at the copper interface zones of C [presented in Figs. 4 and 6(a)] and H [presented in Figs. 8 and 10(a)], which may deteriorate the mechanical properties of joints.
Micro-hardness distribution along line MH1 at copper-weld interface zone C shown in Fig. 4 for Cu–Al joint (specimen #5).

Micro-hardness distribution along line MH2 at copper-weld interface zone K shown in Fig. 8 for Al–Cu joint (specimen #8).

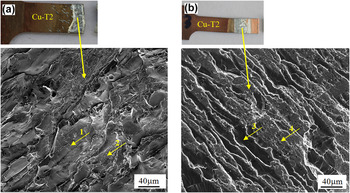
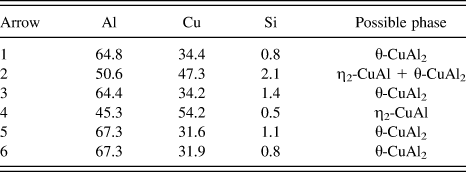
To further analyze the fracture reason, the fracture surfaces were observed by SEM. Figure 15 presents the fracture surfaces fractured at the brazing interface near copper side of specimen #5 and #8 in Fig. 12 and Table III. Figure 16 shows the feature of fracture side at copper side of specimen #5 and #8. In Figs. 15 and 16, the chemical compositions of each phase (denoted by arrow 1–6) were identified by EDS and shown in Table IX.
Fracture surface of welded AA6061 to Cu-T2 joints: (a) fracture at copper side of specimen (#5), (b) fracture at copper side of specimen (#8).

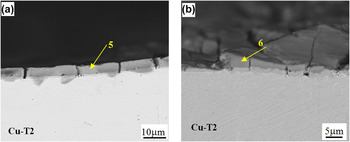
Observation of fracture side: (a) fracture side at copper side of specimen (#5) with Cu–Al joint, (b) fracture side at copper side of specimen (#8) with Al–Cu joint.


From Fig. 15(a), the fracture surface is composed of a large amount of brittle quasicleavage feature surface (denoted by arrow 1) and local tear ridge (denoted by arrow 2). However, from Fig. 15(b), the amount of brittle cleavage surface (denoted by arrow 3) decreased, and more stripped shear-tear structure (denoted by arrow 4) can be found. Based on the results of Table IX and Al–Cu binary phase diagram, a large amount of Cu/Al IMCs (such as CuAl, CuAl2) in fracture surface of specimen #5 and #8 contribute to high microhardness measured at the copper interface zones of C [presented in Figs. 4 and 6(a)] and H [presented in Figs. 8 and 10(a)]. These results can be further identified by observed results from fracture side in Fig. 16. For Cu–Al joint, the specimen #5 was fractured at the more brittle IMCs produced at the copper interface zone C [presented in Figs. 4 and 6(a)]. For specimen #5, the joint is composed of three copper interface zones of C, D, and E with amounts of brittle intermetallics, but the specimen suffered mixed stress condition. During tensile processes, shear stress mainly contributed to brittle zone C and normal stress mainly contributed to brittle zone D. Fracture happened firstly on the brittle zones, and finally led to the fracture location shown in Fig. 12(a). As shown in Fig. 16a, the observation of fracture side at copper side of specimen #5 was revealed that fracture occurred at the phase of CuAl2 [denoted by arrow 5 in Fig. 16(a)], which is well in agreement with the layer II in Fig. 6(c). For specimen #8, larger brazed area with small IMC in the brazed interface induced to a high joint strength. The specimen was also fractured at the phase of CuAl2 [denoted by arrow 6 in Fig. 16(b)], which is well in agreement with the layer II in Fig. 10(c). According to Ouyang's result, Reference Ouyang, Yarrapareddy and Kovacevic8 it indicated that the microhardness of CuAl and CuAl2 were 663–760 HV0.2 and 486–557 HV0.2, respectively. No matter what the copper-weld metal interfaces of Cu–Al joint in Fig. 6 or the copper-weld metal interface of joint II in Fig. 10, CuAl2 is the main interfacial phase, which may introduce the larger local stresses in the edge of the phase of CuAl2 than in the phase of CuAl.
In short, combined the analyses of the microstructures, microhardness distribution, fracture modes and fracture locations of welded AA6061-T6 to Cu-T2 Cu–Al joint and Al–Cu joint, it was found that the interface between the weld metal and Cu base metal is the weakest zone, because of substantial amount of Cu/Al IMCs (such as CuAl2, CuAl).
IV. CONCLUSIONS
According to the study of CMT lap welded AA6061-T6 to Cu-T2 Cu–Al joint and Al–Cu joint, the following ideas can be summarized:
-
(1) Al/Cu CMT welding–brazing joints with sound weld appearance and joint strength can be obtained for two lapped joints with various lapped sequences by CMT welding–brazing method with the Al 4043 wire as the filler. But the welding window was very narrower.
-
(2) The Cu–Al joint was composed of three copper-weld metal brazed interfaces, weld metal, and fusion zone between Al base metal and weld metal. The Al–Cu joint was only composed of one copper-weld metal brazed interface except weld metal and fusion zone. Three copper-weld metal brazed interfaces of Cu–Al joint had various interfacial features and various thicknesses because of the difference of the temperature and reaction time. Compared by Cu–Al joint, copper-weld metal brazed interface of Al–Cu joint had smaller Cu/Al IMCs with smaller thickness, which led to a higher joint strength.
-
(3) The interface between the weld metal and Cu base metal was the weakest region of two joints, which was mainly due to the existence of brittle Cu/Al IMCs. Cu–Al joint was fractured at the second layer with CuAl2 intermetallic. However, the Al–Cu joint was fractured at the boundaries between the first layer with CuAl intermetallic and second layer with CuAl2 intermetallic.
ACKNOWLEDGMENTS
This work was financially supported by National Nature Science Foundation of China (No. 51265028) and Pre-research of National Basic Research Program of China (2014CB660810), the Rose Willow Outstanding Individual Programs of Lanzhou University of Technology (J201203), and the Open Project of State Key Laboratory of Advanced Processing and Recycling of Non-ferrous Metals.