INTRODUCTION
Use of synthetic fertilizer nitrogen (N) for intensive agriculture has contributed to marked changes in the global food economy with increases in production and profitability (Gruber & Galloway Reference Gruber and Galloway2008). However, reactive N transfers to the environment from agricultural land are of considerable concern (Sutton et al. Reference Sutton, Oenema, Erisman, Leip, Grinsven and Winiwarter2011) and can contribute to anthropogenic greenhouse gas emissions (Kim & Dale Reference Kim and Dale2008; Baily et al. Reference Baily, Watson, Laughlin, Matthews, McGeough and Jordan2012), ocean acidification (Doney et al. Reference Doney, Mahowald, Lima, Feely, Mackenzie, Lamarque and Rasch2007), the eutrophication of fresh and marine water resources when also combined with phosphorus (P) transfers (Conley et al. Reference Conley, Paerl, Howarth, Boesch, Seitzinger, Havens, Lancelot and Likens2009; Paerl Reference Paerl2009) and human health issues (Majumdar Reference Majumdar2003).
Given expected increases in global population and food demand, the anthropogenic addition of reactive N to the environment is expected to increase (Gruber & Galloway Reference Gruber and Galloway2008), but this expectation is tempered by national and international agricultural mitigation measures to constrain use and manage N sustainably through increased efficiencies (Wall et al. Reference Wall, Jordan, Melland, Mellander, Buckley, Reaney and Shortle2011). In the European Union (EU), several measures falling under the ‘umbrella’ Water Framework Directive (CEC 2000) are in place to both mitigate excessive N transfers from land and monitor the status and trajectories of N in the environment. For agricultural impacts on water quality, these mitigation measures generally fall under the Nitrates Directive (CEC 1991), as implemented in national legislation, and their effectiveness is monitored under Water Framework Directive guidelines.
The thresholds and standards used to assess water quality can vary between EU nations and also water body types. In the Republic of Ireland, for example, groundwater nitrate-N thresholds are set at 75% of a maximum acceptable concentration (MAC) of 11·3 mg NO3-N/l (i.e. 8·5 mg NO3-N/l), where extra monitoring and catchment investigations are introduced if the exceeded threshold (as a mean) shows an upward trend from long-term data (Statutory Instruments 2010). This is an explicit human health protection threshold based on avoiding exposure over a MAC set by the World Health Organisation (2011). For estuarine water bodies, Irish legislation does not consider N (or P) loads, but requires a mean annual dissolved inorganic N (DIN) concentration of <2·6 mg/l and is combined with mean annual acceptable molybdate reactive P (MRP) concentrations. There are no formal regulatory nitrate-N concentrations for flowing waters; however, a mandatory mean annual MRP concentration of <0·035 mg/l is used to recognize P limitation in lotic systems (Statutory Instruments 2009).
Nitrogen transfers from agricultural land to water are considered to be a more likely risk where soils are permeable. In Ireland, deep, permeable soils are common in the south-east and south-west and, combined with longer growing seasons, these regions are predisposed to intensive agricultural enterprises; hence, N losses from land to water are potentially higher. Constraints on agricultural nutrient use, however, are implemented under the Nitrates Directive Nitrates Action Programme (NAP) under a whole-territory approach in Ireland rather than using nitrate-N vulnerable zones, as in other EU countries such as the UK.
A stocking rate limit equivalent to 170 kg organic N/ha is set under the Irish Nitrates Directive regulations and there are also limits on available N application in both organic and inorganic fertilizers. Grassland farmers may apply for derogation from this restriction to stock up to a limit equivalent to 250 kg organic N/ha, under stricter environmental controls and reporting requirements, and this derogation is subject to annual review (Humphreys et al. Reference Humphreys, Casey, Darmody, O'Connell, Fenton and Watson2008; Wall et al. Reference Wall, Jordan, Melland, Mellander, Buckley, Reaney and Shortle2011). In Ireland, derogations are taken up almost exclusively by dairy farms, with particular concentrations in the south-west region of the country. In the southeast, dairy farming is less widely practiced with a greater preponderance of cereal and other arable cropping and so application for derogation is less frequent.
Groundwater is monitored in Ireland by the Environmental Protection Agency using a national network of monitoring wells (McGarrigle et al. Reference McGarrigle, Lucey and Ó Cinnéide2010). Water sampling is seasonal with (generally) four samples per year from single strata and interpretation of groundwater chemical quality is based on data from regional aquifers. This resolution is similar for estuarine waters. River sampling for chemical water quality is approximately monthly to support biological metrics that are assessed less frequently. Throughout the EU, this type of water quality monitoring relies on long-term time-series to look for regional trends but does not infer hillslope scale or local land-management dynamics; the coupling between groundwater status and transfer of N to receiving rivers is not routinely interpreted. As many countries are moving towards increasing food production under the established constraints of agri-environmental regulations (Anon. 2010), it is becoming necessary to understand how processes (at these smaller time and spatial scales) might impact on larger routinely monitored scales. The current study, therefore, aimed to develop this principle on intensive agricultural land in Ireland where the risk of N loss to water is considered high. Specifically, as part of Nitrates Directive evaluations, the study objectives were to: (i) investigate the coupling of groundwater and surface water nitrate-N dynamics over 3 years, and (ii) ascertain any link between land-management and N dynamics over this period. These objectives were also considered important to add to the understanding of surface water and groundwater N dynamics under scenarios of agricultural intensification.
MATERIALS AND METHODS
Site description
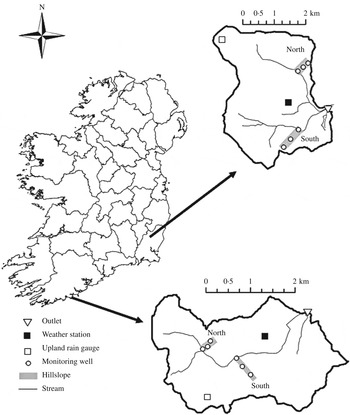
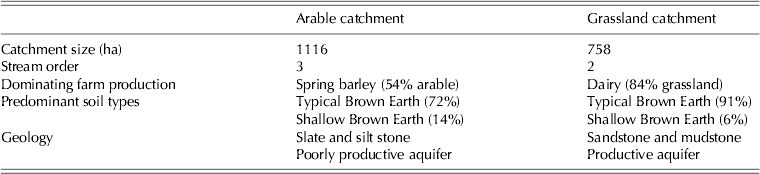
The current study was conducted in two agricultural catchments in the Republic of Ireland (Fealy et al. Reference Fealy, Buckley, Mechan, Melland, Mellander, Shortle, Wall and Jordan2010; Wall et al. Reference Wall, Jordan, Melland, Mellander, Buckley, Reaney and Shortle2011) (Fig. 1 and Table 1). One catchment, termed herein as the Arable catchment, is located in Co. Wexford and has an area of 1116 ha. The land is used predominantly for continuous arable crop production (54%, mainly spring barley), on well-drained acid brown earth soils, and 39% grassland (beef and sheep) with a livestock density of 1·02 livestock units per ha. The bedrock is Ordovician volcanic slate and silt stone of the Oaklands formation (Tietzsch-Tyler et al. Reference Tietzsch-Tyler, Sleeman, McConnell, Daly, Flegg, O'Connor and Warren1994). Production from the underlying unconfined aquifer is poor, with most flow occurring as fissure-flow within the stratified zones of highly permeable weathered rock overlying the competent bedrock. The 1981–2010 mean annual rainfall was 1060 mm at the nearest synoptic station (Johnstown Castle, Met Éireann). The other catchment, termed the Grassland catchment, is located in County Cork and covers 758 ha. The land use is mainly grassland (88·5%) dominated by dairy production, most operating a compact spring-calving seasonal production system based on grazed grass with a livestock density of 1·8 livestock units per ha. The soils are mostly well-drained brown earths, with loams dominating the texture in the B-horizon, overlying Devonian old red sandstone and mudstone of the Toe Head and Castlehaven formation (Sleeman & Pracht Reference Sleeman and Pracht1995). The underlying unconfined aquifer is classified as productive with a secondary permeability flow. The 1981–2010 mean annual rainfall was 1228 mm at the nearest synoptic station (Cork airport, Met Éireann). Both catchments have two focused study sites along hillslopes chosen to represent the land use, soil type, geology and topography that are typical of the catchment (Fig. 1). These hillslopes, in each catchment, are referred to as North and South.
Location of the agricultural catchments and hillslopes within the Arable catchment on slate geology and the Grassland catchment on sandstone geology (previously termed Arable A and Grassland A (Mellander et al. Reference Mellander, Melland, Jordan, Wall, Murphy and Shortle2012; Wall et al. Reference Wall, Murphy, Melland, Mechan, Shine, Buckley, Mellander, Shortle and Jordan2012)).

Catchment physical characteristics

Geophysical survey
A geophysical survey was conducted along each hillslope. This included ground penetrating radar, electromagnetic terrain conductivity (EM31 and EM38), two-dimensional (2D) resistivity and seismic refraction (conducted by Minerex Geophysics Ltd, Ireland). The ground conductivity surveys covered two fields per hillslope in a 5×0·5 m survey grid. The 2D-resistivity survey was made in linear profiles, following the topography, using electrodes with 3 m spacing. The profiles were conducted along a centre-line of the hillslope and at a perpendicular line parallel to the stream, at the bottom half of the hillslope. The seismic survey consisted of p-wave seismic refraction profiling. Each profile was surveyed using 24 vertical geophones (10 Hz) with 3 m spacing.
Monitoring wells
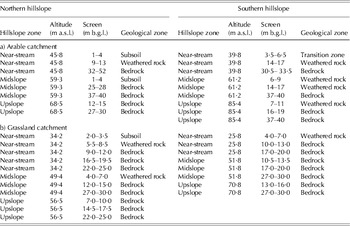
Each hillslope was equipped with three multilevel monitoring wells, in the near-stream, midslope and upslope, respectively. Each monitoring well had three piezometers (non-reactive PVC tubes, 26 mm in diameter) with a 1–4 m screen at different depths, apart from the upslope well of Arable North and Grassland South that had two piezometers and the near-stream of Grassland North that had two wells with a total of five piezometers (Table 2). The near-stream deep piezometer in Arable North had a 20 m screen.
Screening depths and geological zone of piezometers in (a) Arable catchment and (b) Grassland catchment

m a.s.l., metres above sea level; m b.g.l., metres below ground level.
Catchment hydrometeorology
Each catchment was equipped with a weather station (BWS200, Campbell Scientific, Shepshed, UK) in the central lowlands. These measured sub-hourly rainfall, air temperature, relative air humidity, global radiation and wind speed. An additional rain gauge (ARG-100) was sited on higher ground and catchment rainfall was reported as the mean of upland and lowland rain.
The piezometric water levels were recorded on a sub-hourly basis with level loggers (Solinst LT and LTC 3001). These were placed in the middle of the screen of each piezometer. Stream water level (m) was recorded on a 10-min basis with OTT Orpheus Mini vented-pressure instruments installed in stilling wells and discharge (m3/s) was calculated via rating curves developed (in WISKI-SKED software) on Corbett flat-v non-standard weirs in the catchments outlets using the velocity-area method with OTT Acoustic Doppler Current meters.
Water chemistry
Groundwater was sampled monthly within the screen of each piezometer using a low-flow sampling system (Geocontrol) and bladder pump and/or a 50 ml double valve bailer (Solinst). Samples were filtered (0·45 μ m) in situ and transported in cool boxes to the laboratory for analysis within 2–7 days. The samples were analysed for ammonium-N (NH4-N), total oxidized N (TON), nitrite-N (NO2-N) and total N (TN). Nitrate-N (NO3-N) was derived from TON minus NO2-N. Stream water near each monitored hillslope and water from tile drains were also sampled for analysis following the same protocol as for groundwater. In the Arable North hillslope, there were two stream sample sites, as the stream is split into two parallel streams upstream of the hillslope.
Stream water TON was monitored in the outlet on a sub-hourly basis using Hach–Lange Nitratax SC-Plus UV instruments (0·1–50 mg/l) concurrent with water discharge (Jordan et al. Reference Jordan, Melland, Mellander, Shortle and Wall2012, Reference Jordan, Cassidy, Macintosh and Arnscheidt2013; Melland et al. Reference Melland, Mellander, Murphy, Wall, Mechan, Shine, Shortle and Jordan2012).
RESULTS
Hillslope geology
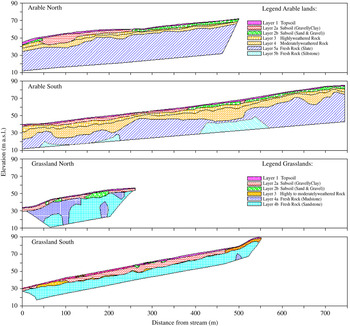
The geophysical data were used to create geological models of each hillslope (Fig. 2). In the Arable catchment, the models indicated layers of permeable material (0·5–2·5 m) overlying slate and siltstone. The upper half of the North hillslope had thinner and more permeable soils than the bottom half and the thickness and clay content increased down the slope. The slate varied in competence from transition zone (highly weathered rock, 1·5–9·0 m below ground level (m b.g.l.)) to moderately weathered rock (3·5–11·0 m b.g.l.), strong slate (7–20 m b.g.l.) and siltstone (>22 m b.g.l.). In the Grassland catchment, the models indicated layers of permeable material (0·9–4·6 m) overlying a three-dimensional pattern of strong mudstone and strong sandstone (with minor siltstone). The depth to strong bedrock varied from 3·6 to 19·7 m. In the Grassland North hillslope, there was a lens of gravel c. 7 m thick and 50 m long in the subsoil, upslope of the midslope monitoring well.
Geological models constructed from geophysical surveys of four hillslope profiles. Colour version available online.

Land management
During the observed period, both hillslopes of the Arable catchment were used for spring barley production. Typical management of spring barley crops in this catchment involves ploughing from January to February with sowing from late February to early April and harvesting from August to early September. The land is left fallow with natural regeneration of green cover between harvest and ploughing in spring. The mean input of N in this catchment in 2010 was 64 kg organic N/ha/year (Melland et al. Reference Melland, Mellander, Murphy, Wall, Mechan, Shine, Shortle and Jordan2012; Wall et al. Reference Wall, Murphy, Melland, Mechan, Shine, Buckley, Mellander, Shortle and Jordan2012) plus 68 kg N/ha/year as inorganic fertilizer N on the grassland area (n=30 fields) and 130 kg N/ha/year as inorganic fertilizer N on spring barley (n=106 fields). Chemical fertilizer N is typically spread from early March to early May. A small number of spring barley fields (n=3) also receive farmyard manure (up to 54 kg/ha organic N), typically spread either in October or late January into February, which offset some of the chemical N applied in these fields. Inorganic fertilizer N application to fields is prohibited from 15 September to 12 January, whereas slurry is prohibited from 15 October and farmyard manure from 1 November.
Both hillslopes of the Grassland catchment were in grass and used for dairy production. On average, the 2010 stocking rate in this catchment was reported at 1·8 livestock units per ha yielding an equivalent input of 155 kg organic N/ha/year (Wall et al. Reference Wall, Murphy, Melland, Mechan, Shine, Buckley, Mellander, Shortle and Jordan2012), most of which would be deposited on pasture directly by grazing animals with some organic N applied to grassland following collection during winter housing. The inorganic fertilizer N load across this catchment in 2010 was 225 kg N/ha/year (n=215 fields). Winter housing is typically from mid-November to late January or early February with grazing for the rest of the year. Nitrogen is typically spread on grassland throughout the year from mid-January to mid-September but with peak N application from March to June to match the potential grass growth curve. Restrictions on the timing of inorganic and organic N applications are the same as for the Arable catchment. On the Northern hillslope, one of the pastures was reseeded and slurry was spread in August 2010. During the monitored period there were also other fields within this catchment that were ploughed and reseeded (within 6 weeks), a periodic practice to maintain productive swards.
Catchment hydrology
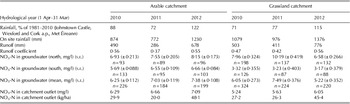
The annual mean rainfall measured on site for the three monitored hydrological years (1 April 2010–31 March 2013) was 959 mm in the Arable catchment and 1144 mm in the Grassland catchment. In both catchments, the hydrological years of 2010 and 2011 were drier than the long-term average and 2012 was wetter due to frequent summer rains (Table 3). In the Arable catchment, 2010 and 2011 were 12 and 28% drier, respectively, than the long-term average and 2012 was 22% wetter. In the Grassland catchment, 2010 and 2011 were 29 and 23% drier, respectively, than the long-term average and 2012 was 15% wetter (from nearest Met Éireann station, Table 3). The annual mean runoff for the monitored period was 484 mm in the Arable catchment and 563 mm in the Grassland catchment (Table 3). The lowest runoff was seen in 2011 in both catchments and the highest in 2012. The two catchments had similar average yearly runoff coefficients of 0·49 (0·37–0·55) in the Arable and 0·48 (0·42–0·56) in the Grassland catchment.
Hydrological and hydrochemical characteristics of the Arable and Grassland catchments for the three monitored hydrological years (1 Apr 2010–31 Mar 2013)

In the hillslopes of the Grassland catchment, the water table was typically <0·5 m under surface level in the near-stream zone and 12·0 m under surface level near the catchment divide. In the Arable catchment, the water table was typically 0·5 m (near-stream) to 8·5 m (upslope) under surface level.
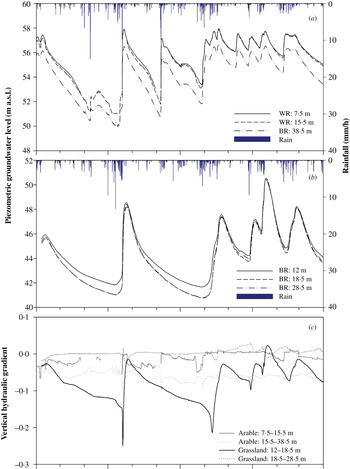
The groundwater of the transition zone and weathered zone of the Arable catchment showed a quick response time in piezometric water level to rainfall (1–9 h in the near-stream, 1–3 days in the mid- and upslopes) (Fig. 3 a). The Grassland catchment was more hydrologically buffered with longer response times in piezometric water level to rainfall (3–9 h in the near-stream, 3·5–13 days in the mid- and upslopes) (Fig. 3 b). There were also higher vertical hydraulic gradients over the year between the shallow and mid-depth piezometers in this catchment compared with the Arable catchment (average of −0·07 and −0·004, respectively; Fig. 3 c). This was reversed between the two deeper layers but considered less important for recharge.
Example of hourly averaged piezometric groundwater levels in three screening depths (WR=weathered rock and BR=bedrock) and hourly rainfall during the first hydrological year in the midslope (a) of the Arable South hillslope and (b) the Grassland South hillslope. (c) Vertical hydraulic gradients between different depths in the midslope of the Arable and Grassland South hillslopes. Colour version available online.

Nitrate-N concentration in groundwater
The fraction of ammonium-N and nitrite-N concentrations as a proportion of total N concentration in groundwater was small in both catchments (data not shown). In the Grassland catchment, the lower fractions of nitrate-N in relation to total N were found in the groundwater of the near-stream zone and in the groundwater of the upslope in the Southern hillslope.
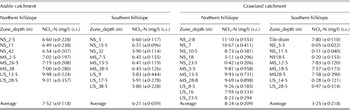
In the Arable catchment, the groundwater had a spatio-temporal mean nitrate-N concentration of 6·89±0·068 mg/l, with the highest annual mean in 2012 and spatially highest and lowest concentrations in the upslope zones of the Northern hillslope and Southern hillslopes, respectively (Tables 3 and 4). Despite the stratified geology (Fig. 2), the groundwater of the Arable catchment showed little variation in nitrate-N concentrations with depth.
Annual mean nitrate-N concentration and s.e. from monthly sampling over three monitored years (Apr 2010–Mar 2013) in piezometers of different depths and zones within hillslopes in the Arable and Grassland catchments

NS, near-stream; MS, midslope; and US, upslope.
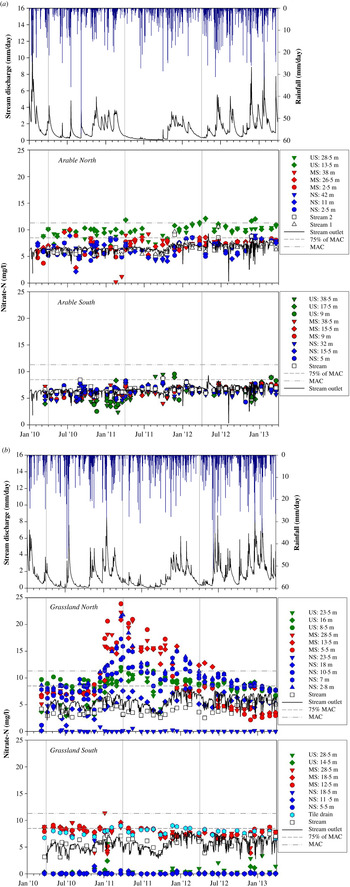
In the Arable catchment, groundwater and stream water nitrate-N concentrations and dynamics at the bottom of the hillslope were similar to each other throughout the monitored period (Fig. 4 a). In the Northern hillslope, there were seasonal trends in the groundwater that were not synchronized between the zones. In the upslope, the groundwater nitrate-N concentration peaked in April and dipped in October, in the midslope groundwater the concentration peaked in June–July and dipped in February and in the near-stream groundwater the concentration peaked in January–February and dipped in August. In the upslope, the groundwater nitrate-N concentrations were consistently higher than in the stream and in the other two zones. The nitrate-N concentrations increased over the monitored time in all zones. In the Southern hillslope, nitrate-N concentrations in the stream water most closely reflected the groundwater in the upper strata (transition zone (3·5–6·5 m) and weathered bedrock (14–17 m)) of the near-stream zone. In this hillslope, groundwater nitrate-N concentrations were more homogenous but some variations were observed, mostly as small increases during winter.
Time-series of daily catchment rainfall, daily total stream discharge in the outlet, monthly sampled nitrate-N concentration in groundwater and stream water in the two hillslopes and daily averaged nitrate-N concentration monitored in the stream outlet in (a) Arable catchment on slate bedrock and (b) Grassland catchment on sandstone bedrock. US, upslope; MS, midslope and NS, near-stream. MAC is the maximum acceptable concentration (11·3 mg NO3-N/l) and 75% of MAC is the Irish drinking water standards (8·5 mg NO3-N/litre). Colour version available online.

In the Grassland catchment, the groundwater spatio-temporal mean nitrate-N concentration was 6·24±0·176 mg/l with the highest annual mean in 2011 and spatially highest mean in the midslope zone of the Northern hillslope (Tables 3 and 4). There were variations in nitrate-N concentration both between the hillslopes, hillslopes zones and geological strata. The near-stream zone of the Northern hillslope had a clear vertical gradient with highest nitrate-N concentrations in shallow groundwater (2·8 m). In the Southern hillslope, all groundwater strata of the near-stream and upslope zones had mean nitrate-N concentrations close to the limit of detection. In the midslope, however, the groundwater mean nitrate-N concentration was 7·66±0·119 mg/l and a tile drain draining that zone into the stream had similarly higher concentrations.
In the Grassland catchment, there was more variation in groundwater nitrate-N concentrations not only between the zones and strata but also with time (Fig. 4 b). The stream water at the bottom of the hillslope did not directly reflect groundwater nitrate-N concentrations. In the Northern hillslope, only the deeper groundwater in the near-stream bedrock had lower nitrate-N concentrations than the stream water. Stream water was most similar to the near-stream groundwater in the bedrock at 18 m depth. In the Northern hillslope, there was a period of increased nitrate-N concentrations in groundwater of all zones, particularly in the midslope where the nitrate-N concentrations started to increase in November 2010. This reached a peak of 23·9 mg/l in the weathered rock at 5·5 m depth (22·3 mg/l in the bedrock at 28·5 m) in March 2011 and returned to concentrations similar to that before the peak (c. 7·0 mg/l) in January 2012. Thereafter, the concentration continued to decrease below the background concentration and eventually reached low values of 2·2 mg/l towards the end of the monitoring period. In the near-stream groundwater the concentrations started to increase in December 2010, reached a peak of 21·8 mg/l in the subsoil at 2·8 m depth in April 2011, with a second peak of 15·1 mg/l in December 2011 and returned to background concentrations in October 2012. In the upslope groundwater, the rise in nitrate-N concentration was more modest, starting in February 2011, reaching a peak of 12·4 mg/l in the bedrock at 8·5 m depth in July 2011 and eventually returning to background conditions in March 2012. In the Southern hillslope groundwater, all depths of the near-stream zone had low nitrate-N concentrations (<0·60 mg/l) throughout the monitored period, apart from one sampling occasion in November 2010 when the concentration peaked at 6·2 mg/l. Also the upslope had low nitrate-N concentrations, but with a slight increase in 2012. The groundwater in the midslope and in the tile drain had nitrate-N concentrations higher than the stream water in the first 2 years but in 2012 these were slightly lower than the stream water concentration.
Nitrate-N in stream water
In the Arable catchment, the nitrate-N concentrations in the sampled stream water at the foot of both hillslopes were similar to the sub-hourly monitored values in the outlet (Fig. 4 a). The 3-year mean nitrate-N concentration at the catchment outlet was 6·68±0·021 mg/l, which was similar to the catchment spatiotemporal mean concentration in the groundwater (6·89±0·068 mg NO3-N/l) (Table 3). There were quick dilution dips corresponding to rain events and a prolonged dip over the dry summer of 2011; however, during 2010 and the wet 2012, there was no clear dip over the summer.
In the Grassland catchment, the nitrate-N concentrations in the stream water at the base of the Northern hillslope were lower than the monitored values at the outlet. At the base of the Southern hillslope, however, the nitrate-N concentrations were generally higher than at the base of the Northern hillslope but similar to the monitored values at the outlet (Fig. 4 b). The 3-year-mean nitrate-N concentration at the catchment outlet was 5·64±0·034 mg/l, which was slightly lower than the spatial and temporal mean nitrate-N concentration in the groundwater (6·24±0·176 mg/l) (Table 3). There was seasonality, in both catchments, with typically higher nitrate-N concentrations in winter and lower during the summers with lower baseflow conditions in 2010 and 2011 compared with 2012. The event of localized increased nitrate-N concentration in groundwater reported above was not reflected in the adjacent stream water, beyond the trends of increasing autumnal stream water concentrations observed as in the previous year. Similar to the Arable catchment, during the wet 2012 the background stream nitrate concentration increased and there was no clear decrease during summer.
DISCUSSION
Nitrate-N in groundwater
Arable catchment
In the Arable catchment, it is likely that N transfer to groundwater was driven by water recharge during rain events, which in this catchment appeared to respond quickly (vertical unsaturated hydraulic response <1–3 days). However, in agreement with the findings by Rouxel et al. (Reference Rouxel, Molénat, Ruiz, Legout, Faucheux and Gascuel-Odoux2011) the spatio-temporal vertical transfer of N to shallow groundwater appeared to be heterogeneous. The geophysical survey, together with observations from soil pits (data not shown), revealed that the soils were deeper and had higher clay content (low effective porosity) and the groundwater table was shallower (thin unsaturated zone) closer to the stream. Fenton et al. (Reference Fenton, Schulte, Jordan, Lalor and Richards2011) reported different vertical travel times for Irish settings due to differences in effective porosity and depth to saturated zone. Based on this understanding, a conceptual model of water flow and nutrient transport in the transects was proposed, with the groundwater having a quicker hydrological response but more buffered chemical response (i.e. opportunities for chemical attenuation and/or transformation) in the near-stream zone and a slower hydrological but less buffered chemical response in the upslope zone. This gradient in both hydraulic head and nitrate-N concentration was more pronounced in the Northern hillslope as the Southern hillslope was more homogenous.
The spatio-temporal 3-year-mean nitrate-N concentration of groundwater in the Arable catchment was below the Irish groundwater standard nitrate-N threshold (8·5 mg/l) and the drinking water standard nitrate-N MAC (11·3 mg/l). However, there were zones and times when the groundwater and drinking water standards were exceeded. In the upslope of the Northern hillslope, where the soils were both thinner and more permeable than further down the slope, the 3-year-mean nitrate-N concentration exceeded the groundwater threshold standard. In this hillslope, the upslope zone had a peak nitrate-N concentration (above the MAC) in April which coincided with the main period of fertilizer application to spring barley fields. It also followed shortly after ploughing, and coincided with the onset of organic matter mineralization due to rising temperatures (but was during a period when crop growth and N uptake is only beginning to accelerate). This peak in N concentrations also coincided with a period of high water table and frequent rainfall, and highlights a potentially vulnerable time for N loss in spring cropping systems over thin soils. The midslope, with its thicker and less permeable soils, had a peak in nitrate-N concentration 2–3 months later. Soil texture has an influence on the N leaching rate with higher retention rates in clay-rich soils (Hubbard et al. Reference Hubbard, Sheridan, Lowrance, Bosch and Vellidis2004). This suggests different leaching/retention rates of nitrate-N varying with soil depths (depth to saturated zone) and clay content (effective porosity), thus increasing closer to the stream where the soils have higher clay contents (assuming clay content having a larger influence than depth to saturated zone). Peaks in nitrate-N concentration in the groundwater of the midslope and near-stream zone were also periodically above the MAC and, in the near-stream zone, occurred when the delayed peak coincided with a high water table. In the Southern hillslope, the soils were more homogeneous in permeability and clay content which probably also caused less variability in nitrate-N concentrations although there were some fluctuations that appeared to be more associated with weather conditions than with land management. The uniform concentrations between strata and zones in combination with a quick vertical hydrological response to rainfall suggest that there was less chemical buffering within this hillslope. The upslope, however, had thinner soils, similar to the Northern hillslope, and there were occasions when nitrate concentrations peaked above the MAC in that zone.
The stream water by the foot of the hillslopes and the shallow groundwater were similar, both in terms of water flux and nitrate-N concentration dynamics. That, together with the geology consisting of a highly permeable layer of weathered slate on top of the competent slate bedrock, suggests that once water has been recharged into the shallow groundwater it will move towards the stream quicker than in other dense layers and with less attenuation of nitrate-N along the transfer pathways.
Grassland catchment
The higher N source pressure (organic N and chemical fertilizer load) in the Grassland catchment may have resulted in a surplus soil mineral N above the grass demand for growth that was potentially available for transfer to the groundwater. Even with higher nutrient loadings, however, the Grassland catchment had lower mean nitrate-N concentration in both groundwater and surface water. This catchment was more chemically and hydrologically buffered (i.e. opportunities for attenuation become higher as there is lower interaction with faster hydrologic pathways and runoff). The time lag between event occurrence and changes to the water table position ranged from 3·5 to 13 days, controlled by soil type, thickness and antecedent conditions and resulted in lower and more spatially and temporally variable groundwater nitrate-N concentrations. In the Northern hillslope, however, there were shallow lenses of gravel that may have caused a patchy quick transfer of soil-water N to the groundwater. In the Southern hillslope, the near-stream zone was saturated close to the surface with a high content of organic materials and high potential for denitrification.
Despite the spatial 3-year mean nitrate-N concentration of groundwater in the Grassland catchment being below current standards according to the Irish regulations for groundwater, there were zones and times when the concentrations peaked above MAC for sustained periods. This was particularly so in the Northern hillslope, in the shallow groundwater of the near-stream zone, and all monitored strata of the midslope and the shallow groundwater of the upslope. In the Southern hillslope, the spatial 3-year mean nitrate-N concentration was below current regulations. However, in the midslope groundwater the MAC was exceeded occasionally and likely due to recharge during rain events.
When the two fields in the Northern hillslope were ploughed during a pasture reseeding event, it is likely that soil N was mineralized and released into the soil-water and subsequently flushed into the groundwater. The higher response in nitrate-N concentration to this event in the midslope zone was explained by a lens of gravel that may have induced preferential flow into the groundwater upslope of that monitoring well. It was also here that the nitrate-N concentrations after the peak reached low nitrate-N concentrations during the wet year of 2012, probably due to exhaustion of N sources and the rain having a diluting effect (i.e. a localized area of low chemical buffering capacity).
In the Grassland catchment overall, the nitrate-N concentrations were more heterogeneous in time, zone and strata as explained by being more hydrologically buffered, i.e. with slower pathways linking land and water and therefore nitrate-N being more exposed to chemical attenuation and/or transformation. Another explanation could be due to the effects caused by the reseeding event. In the near-stream zones strong chemical buffering was indicated by low nitrate-N concentrations and a higher proportion of ammonium-N and nitrite-N (in all levels of the Southern hillslope and as a gradient with depth in the Northern hillslope – data not shown). This indicated a potential transformation of nitrate-N via denitrification, DRNA and, perhaps, more limited nitrification in these zones (Kelso et al. Reference Kelso, Smith, Laughlin and Lennox1997; Batson et al. Reference Batson, Mander and Mitsch2012); but there was also likely to be mixing (and therefore dilution) with deeper and older water of lower nitrate-N concentrations (Tesoriero et al. Reference Tesoriero, Duff, Saad, Spahr and Wolock2013). It is, however, unclear from these data whether transformation or dilution has the largest attenuating effect. In the Southern hillslope, it appears that the natural, near-stream buffering zone was bypassed by higher nitrate-N content water from the uplands via under-field drainage similar to that reported by King et al. (Reference King, Hughes, Balogh, Fausey and Harmel2006) and Tesoriero et al. (Reference Tesoriero, Duff, Wolock, Spahr and Almendinger2009). As the natural near-stream buffering zones often consist of more poorly drained soils and the function of under-field drainage systems is to improve land drainage, these drainage systems often coincide with near-stream buffering zones in intensively managed agricultural landscapes.
Nitrate-N transfer to stream water
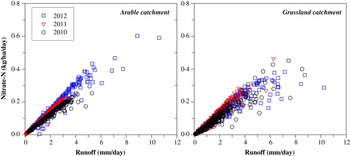
The stream flow in the Arable catchment was largely generated by groundwater throughout the year. Using methods such as hydrograph separation, loadograph recession analysis (LRA) and end member mixing analysis (EMMA) for a large rain event in spring, Mellander et al. (Reference Mellander, Melland, Jordan, Wall, Murphy and Shortle2012) reported that the dominating water and nutrient transfer pathways were found to be within the delayed flow in the transition zone and the weathered bedrock. A particular event caused increased nitrate-N concentrations during 1–2 May 2012, probably due to the previous N application and build-up of mineral N (Fig. 4 a). The frequent number of rain events in the summer of 2012 diluted the stream water nitrate-N concentration during the events but probably transferred a substantial amount of N into the groundwater, which increased the base level concentration in the groundwater and consequently in the stream during baseflow conditions. In line with the findings of Molénat et al. (Reference Molénat, Gascuel-Odoux, Ruiz and Gruau2008), there was a linear correlation between nitrate-N load and water runoff (Fig. 5) with no decrease towards a limiting nitrate-N supply within the monitored range. This indicated that the catchment nitrate-N export in stream water was largely transport-limited rather than supply-limited within years and thus the N loads were dependent on stream water discharge (Molénat et al. Reference Molénat, Gascuel-Odoux, Ruiz and Gruau2008). The annual increase in nitrate-N concentration in the groundwater was, however, reflected in the stream water. Between 2010 and 2011 there was an increase of 0·11 mg NO3-N/l in the groundwater, which was coincident with an increase of c. 15% in the nitrate-N load, as seen in the trend (slope) of the nitrate-N load and runoff correlation (Fig. 5). Despite this, the annual total load was higher in 2010 (29·9 kg NO3-N/ha/year) due to more runoff and, consequently, the highest annual load (48·1 kg NO3-N/ha/year) was in 2012 when both the concentration and runoff were highest.
Daily Nitrate-N load as a function of daily catchment runoff for three hydrological years (1 Apr 2010–31 Mar 2013) in the Arable catchment and Grassland catchment. Colour version available online.

In the Grassland catchment, stream flow was also mainly generated by groundwater throughout the year. With the same methods as for the Arable catchment, a large summer rain event revealed the dominant water and nutrient transfer pathway to be in the shallow bedrock (Mellander et al. Reference Mellander, Melland, Jordan, Wall, Murphy and Shortle2012). The increased nitrate-N concentration observed in the groundwater in 2011 was not reflected in the stream water until 2012 when the yearly average nitrate-N concentration was at its highest. There was a linear correlation between nitrate-N load and water runoff similar to the Arable catchment (Fig. 5). However, the strength of correlation was lower, indicating that factors other than runoff may control the loads. In contrast to the Arable catchment, the nitrate-N loads from the Grassland catchment appeared to have a degree of supply limitation from a runoff of c. 6 mm/day, i.e. where the increase in nitrate-N load with runoff was dampened (Fig. 5), inferring dilution at higher runoff, likely due to its higher capacity to retain and denitrify N inputs and a lower capacity to nitrify organic N during the events. The lowest load of 26·3 kg NO3-N/ha/year was in 2011 and the highest load of 45·4 kg NO3-N/ha/year in 2012. Higher nitrate-N concentrations in winter and lower concentrations during the summers with lower baseflow conditions (2010 and 2011) in the Grassland catchment also suggest that N concentrations and loss are being partially regulated by leaching with high retention rates and potentially denitrification in some zones of that catchment. The lack of plant uptake in winter can lead to residual soil N being mobilized and lost in winter drainage, leading to higher concentrations, despite the higher volumes of water flushing through the soils. The fact that, during the wet year of 2012, background concentrations at the stream outlet increased and did not dip through the summer suggests that, with water-logged conditions and associated poor growth and uptake of mineralized or applied N and with summer drainage occurring, nitrate-N concentrations can be increased during summer provided the hydraulic gradient is maintained.
Potential implications for intensive agricultural production
The unique time-series of nitrate-N concentration in the River Thames, UK reported by Howden et al. (Reference Howden, Burt, Worrall, Whelan and Bieroza2010) revealed a large increase in nitrate-N loads as the result of an extensive ploughing of permanent grassland, an increased use of fertilizers and increased drainage of land in the 1960s. Similarly, under agricultural scenarios in Ireland with an increased demand for food production (Anon. 2010), it is likely that there will be a small increase in the area of land which will be ploughed and drained (primarily for pasture renovation). This may have implications for N loss from soils to ground and surface waters. Such activity may increase base level concentrations of N in soil waters and potentially also the supply of N for transfer to groundwater, streams and receiving lakes and estuaries. If this occurs in landscapes with a high capacity to attenuate N along the transfer pathways, as in the Grassland catchment in the current study, there may be local and temporary increases in mineralized N in soils and nitrate-N in groundwater, which will be followed by recovery. However, in the current study at least, the local and temporary increases observed in the Grassland catchment groundwater nitrate-N concentrations in one hillslope were not reflected by related changes (of the same magnitude) in stream water nitrate concentration or flux at the catchment outlet (other than impacts from rainfall-runoff changes). These findings, regarding the transient nature of both spatial and temporal events in groundwater nitrate-N concentrations following their response to land management, need to be considered when assessing and interpreting less frequent national monitoring campaigns where local and temporary transient nitrate-N concentrations may be picked up and falsely interpreted as regional and permanent trends. However, in catchments with groundwater generated stream flow with quick hydrological response and less potential for N attenuation, as in the Arable catchment of the present study, it is possible that increased N concentrations in groundwater from local N mineralization will increase concentrations in surface water and so potentially the N transfer to surface waters. This could be irrespective of potential increased transfer from increases in source inputs.
Increased drainage of land may locally connect the streams to the uplands, which commonly have thinner and more permeable soils and where shallow groundwater is likely to have higher N concentrations due to less attenuation. This would be magnified in years with wet summers and with an existing high groundwater nitrate-N status (King et al. Reference King, McDonald, Moore, Agrawal, Fischer and Balogh2010; Healey et al. Reference Healey, Ibrahim, Lanigan, Serrenho and Fenton2012) and could transfer a proportion of shallow groundwater to the stream during baseflow rather than deep groundwater with lower N concentrations.
CONCLUSIONS
In two groundwater-driven and intensively managed agricultural catchments in Southern Ireland, field N sources were connected to surface water via groundwater and nitrate-N in groundwater was influenced both spatially and temporally by management, soil, geology and weather. Four main points can be concluded from the current study:
-
1. Land management impacts on groundwater were sometimes significant but were also localized to zones and strata within the hillslope scale. The variability in nitrate-N concentration highlights the need for insight into these differences when interpreting groundwater quality data from a limited number of sampling points and occasions, such as in national monitoring campaigns. This is important to distinguish between nitrate concentration events from trends in groundwater.
-
2. Despite the local and temporary peaks, the spatio-temporal mean nitrate-N concentration in groundwater of both catchments was below current regulatory standards and was similar to the temporal average in the stream water. Nitrate-N loads were deemed high but not relative to any standard target.
-
3. A relatively small increase in annual spatial nitrate-N concentration (+0·11 mg/l) in the groundwater of the Arable catchment was reflected in an increase in the relative nitrate-N load in the stream outlet by 15%. This may suggest coupling between groundwater nitrate-N concentration and eventual catchment load but, in this case, the total loads appeared to be more influenced by the coincidental amount of runoff. Inter-annual variability in runoff could, therefore, be a potentially overwhelming factor on N loss that will have to be considered in trend assessments of estuarine water quality status.
-
4. The grassland dominated catchment on sandstone was hydrologically and chemically more buffered (for example, processes involving assimilation, attenuation and denitrification) than the catchment dominated by arable land on slate bedrock but in both catchments there was less hydrological buffering and more chemical buffering closer to the stream. As intensified agriculture may locally increase nitrate-N concentrations in groundwater, catchments with little chemical attenuation within the landscape and/or a dense under-field drainage system may possibly deliver more nitrate-N to surrounding waters.
As Ireland seeks to increase food production in the next several years it will be important to consider these factors in terms of nitrate-N concentrations in groundwater, receiving stream waters and as loads to estuarine waters – a strategy that may only be realized with the same kind of land and river monitoring demonstrated here.
This work was conducted as part of the Agricultural Catchments Programme, an evaluation project under the EU Nitrates Directive and funded by the Irish Department of Agriculture, Food and the Marine. We acknowledge farmers for cooperation and access to their land. We also thank and acknowledge Mr Oliver Shine, Mrs Sarah Mechan, Mr Denis Brennan, Mr David Ryan, Mr Brian O'Connor and Mr Mark Treacy for technology and technical support. The geophysical survey and associated interpretation was conducted by Minerex Geophysics Ltd, Maynooth, Ireland.