One of the worst series of events that can affect the stock market is arguably war followed by defeat. Barro (Reference Barro2006) proposes an explanation for the so-called ‘equity premium puzzle’ (i.e. anomalously higher historical returns of stocks over government bonds), using the probability of a disaster, such as war. Jorion and Goetzman (Reference Jorion and Goetzmann1999) suggest that European wars can explain the higher historical US equity premium. In the French case, Le Bris and Hautcoeur (Reference Le Bris and Hautcoeur2010) measure the impact of the two world wars on long-term stock returns. This article is dedicated to the study of the effects of wars upon the French stock market.
There have been a number of recent studies with a particular focus on the financial and economic developments around World War II. Frey and Kucher (Reference Frey and Kucher2000) analyse war-time conditions using foreign government bond prices at the Zurich stock exchange. Oosterlinck (Reference Oosterlinck2003, pp. 326–44) compares prices of Vichy bonds with pre-war French bonds to measure the legitimacy of Vichy France. Brown and Burdekin (Reference Brown and Burdekin2002) study German bonds traded in London. Occhino et al. (Reference Occhino, Oosterlinck and White2008) show how occupied France financed its own exploitation; Oosterlinck (Reference Oosterlinck2010) describes the market microstructure and the changes in market organisation during the Occupation. Oosterlinck and Riva (Reference Oosterlinck, Riva, Baubeau and Ogren2010) study the impact of the war on the competition among French stock exchanges. Marseille (Reference Marseille and Dard2000) argues that, in France, several industries, such as construction firms, have a better performance than the market.
Most of these studies use market prices to understand war. This article focuses on wars in order to understand the French stock market and its long-term trends. France has endured three wars within its own national territory: one clear defeat (1870), one very difficult victory (World War I) and one defeat with a partial victory (World War II). Each of the three wars created highly specific conditions, which had powerful effects upon financial markets. Such conditions included the indemnity which was paid after 1871, the end of the gold standard due to World War I, and the occupation indemnity and nationalisations due to World War II. Despite these factors, which were specific to each war, one common rule remains: the importance of the way the war was financed. To understand the behaviour of the markets during periods of war, the importance of the manner by which the war is financed should not be underestimated. As the Latin phrase highlights, Pecunia nervus belli ‘money is the sinew of war’.
This article firstly describes the behaviour of the stock market during these disturbed periods and secondly it attempts to explain the differences observed by studying the way in which each war had been financed. The key mechanisms of interest are the inflationary consequences of the money created to finance the wars. There was no monetary creation and associated inflation during the Franco-Prussian War. However, during World War I there was inflation in a relatively free market, whilst during World War II, there was inflation under conditions of financial repression (as defined by Reinhart and Sbrancia Reference Reinhart and Sbrancia2011). In the end, the two world wars led to a similarly significant destruction of market values in real terms: in these two cases, stocks were bad hedges against this inflation. Additionally, World War II was characterised by strong financial repression, which led to a surprisingly short-lived rise in stock prices until 1943. Finally, war also affects the nature of the stock market over the long run: a long-term increase in interest rates occurred after 1871; World War I marked the end of monetary stability and the disappearance of public utilities firms; and, finally, the nationalisation of one-third of the market began after World War II. Due to the destruction of market values, which occurred after the two world wars, the role of the stock market in the French economy became less important. This destruction of market values explains the first part of the U-shaped pattern of the role of the market in the economy (Rajan and Zingales Reference Rajan and Zingales2003).
The first section of this article presents the data used for drawing interpretations of the effects of the three wars on stock market performance. The second section puts forth the argument that the performance of stock prices during the examined periods of war is affected by how each war was financed. The third section presents the long-term effects of each war. The fourth section presents measurements of the global impact of the two world wars on the French stock market. The last section concludes.
I
Accurate US stock market data exist from 1871 largely thanks to the precursory work of Alfred Cowles (Reference Cowles1939); the data for the period 1815–71 have been recently completed by Siegel (Reference Siegel1994) and Goetzmann et al. (Reference Goetzmann, Ibbotson and Peng2000) up until the year 1925. The specific economic history of the United States has led to the investigation of the economic situation in other countries. Dimson et al. (Reference Dimson, Marsh and Staunton2002) compiled a panel of stock indices, which is comprehensive, but lacks in quality compared to the US data. Dimson et al. discovered that despite the wars, stocks performed well in Europe in the twentieth century. A major shortfall in Dimson's compilation is that the quality of the collected data can, in certain instances, be poor. Indeed, the data often consist of a compilation of old indices built by statistic administrations to gauge macro-economic conditions, rather than the effective return of an investment in stocks (Hautcoeur Reference Hautcoeur2006). For the most part, these old indices only include industrial firms whilst they exclude banks and utilities, which were heavily weighted in the actual portfolios and were highly sensitive to inflation and public regulation. In many cases, the indices were also built either without market capitalisation weighting or by weighting by nominal capital, book value and transaction volumes, leading to strong biases.
This study uses a new database for the French stock market, which ranges from 1854 to 1998 (see Le Bris and Hautcoeur Reference Le Bris and Hautcoeur2010). The historical CAC 40 (HCAC 40) is a monthly index of the 40 most prominent shares among French firms, ranked each year by market capitalisation, thus avoiding survivor's bias.Footnote 2 The index is weighted by these capitalisations. These 40 stocks are few in number, compared to the quantity of listed firms, but they represent a major part of the total market capitalisation. Today, the Euronext's CAC 40 represents about 70 per cent of the French market capitalisation; the same percentage as it was during war periods (see table 1 in Le Bris and Hautcoeur Reference Le Bris and Hautcoeur2010, p. 146). Indeed, the distribution of the firms' sizes is not linear. When focusing on the 40 most prominent firms from 1854 to 2007, it becomes evident that the largest has an average weighting of 12.73 per cent whereas the fortieth largest firm has a weighting of only 0.69 per cent. The top ten firms represent more than 60 per cent of the market, whereas the final ten account for less than 8 per cent. Thus, a blue chips index captures the most important stylised facts of the value-weighted return of all shares, as demonstrated by Annaert et al. (Reference Annaert, Buelens, Cuyvers, de Ceuster, Deloof and de Schepper2011) in the Belgian case. Other assets are used to compare stock performances: data on bond prices are derived from Le Bris and Hautcoeur (Reference Le Bris and Hautcoeur2010), black market prices of gold and currencies during World War II are derived from Vigreux (Reference Vigreux1948), data for GDP are derived from Lévy-Leboyer and Bourguignon (Reference Levy-Leboyer and Bourguignon1985) and INSEE (1951).
Nominal and real prices during and after the wars

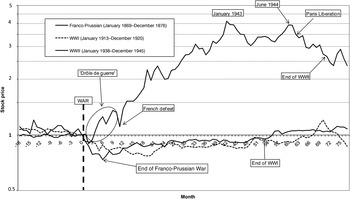
Stock market prices presented similar movements prior to the declaration war: the prices remained stable. The market seemed not to expect serious negative consequences from the wars. Examining a period of 18 months before the war, prices decreased approximately 10 per cent before both World War I and II, and remained perfectly stable during the same period before the Franco-Prussian War. Once the war began, variations differed strongly. After the quick defeat in 1871, stock prices fell 20 per cent. At the beginning of World War I, stock prices fell about 15 per cent. However, the scenario is very different for World War II. Two months after the declaration of war, during the drôle de guerre, and after the armistice, stock prices rose very quickly, with an apparently weak impact stemming from the military defeat. This paradoxical rise in nominal prices during World War II was very homogeneous until January 1943. During the 41 months between the declaration of war and January 1943, only 10 months were negative, whereas this is the case approximately half of the time during regular (non-war) periods. Between the declaration of war and January 1943, prices rose to four times their original value. After 1943, the trend was reversed, but the coefficient remained at 2.5 by the end of the war.
Price reaction of the HCAC 40 during the wars

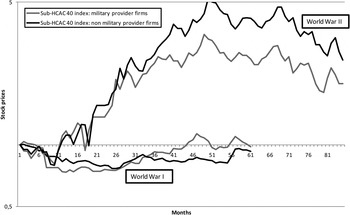
It can be argued that these global market figures hide specific individual stock reactions according to the exposure of the individual firms to the war. A war may be good news for some industries, as it predicts increased production and expected future profits. To test this potentially positive reaction to the beginning of the conflict (and conversely a negative reaction to the end of the war), two equally weighted sub-indices are constructed. The first one, named ‘Military providers’, is comprised of steel and aluminium industries, metallic mines, and manufacturers of electric engines. A second sub-index includes all other firms of the HCAC 40. Figure 2 shows the run of these two sub-indices during the two world wars.Footnote 3 This comparison does not show any better reaction by the ‘Military providers’ index during either World War I or World War II.
‘Military provider’ firms compared to non-military provider firms during the two world wars

Three reasons can explain the lack of a premium for the ‘Military provider' sub-index. First, this index is a poor measure for the potential positive effect of the war, because the French stock market does not list any pure players in the weapons industry, but only firms with multiple activities including weapons, or indirect interests in military spending. Secondly, most of the firms in the steel and mining industries are located near the German frontier, thus in the worst possible location during both world wars. Thirdly, in the case of World War II, the firms, or parts of the firms, which manufactured weapons were nationalisedFootnote 4 in 1936 (Frankestein Reference Frankestein1980). On the contrary, at the individual stock level, we can observe positive reactions to the start of the war by firms mainly established outside Europe, such as the Port de Rosario in Argentina and the Banque d'Indochine.
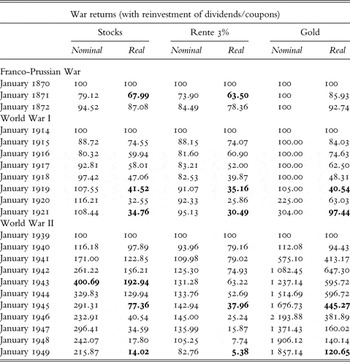
Nominal and real prices are definitively different. The stock prices studied so far are those quoted in the stock market; they are nominal. With the value of the French franc falling, the real performance is lower. It is reasonable to assume that investors are more concerned with real performances than with nominal ones. In Table 1, the returns achieved by stocks and state bonds are displayed, assuming a hypothesis of reinvestment of dividends and coupons. In order to measure all the ‘war effect’, it is necessary to look at the resulting situation a few years after the war: until when GDP recovered, up to the pre-war level (1922 after World War I, 1950 after World War II). The years following immediately the end of the war must be included in the analysis of its effects. To offer a comparison, gold prices are also considered.
Three wars, two near-total losses. The Franco-Prussian War caused a 30 per cent real loss for both stocks and bonds. One year later, the loss in the value of stocks was less than 15 per cent, but more than 20 per cent for bonds. At the end of World War I, the decrease in real value is about 60 per cent for stocks, and about 70 per cent for bonds. Two years after, the situation was worse: 65 per cent for stocks and 80 per cent for bonds. However, World War II was different, with a nominal increase, but a dramatic real performance. At the end of stock prices in 1943, the real performance was +93 per cent, but at the end of the war the real variation was –30 per cent and –60 per cent for bonds. A few years later, in January 1949, the loss was more or less complete with –86 per cent for stocks and –95 per cent for bonds since 1946, 1947 and 1948; the inflation rate was around 50 per cent each year.
During these two last wars, gold achieves very attractive performances. Two years after the end of World War I, gold holders had the same real value as the period prior to the war. The highest value of stocks, in January 1943, of +93 per cent pales in comparison to the +500 per cent achieved by gold. At the end of World War II, gold keeps a 400 per cent increase and a 20 per cent increase in January 1949.
II
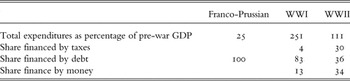
These different price reactions during the three wars can be explained by the methods used to finance each conflict. Each war caused multiple events, which acted strongly upon stock prices; but a key factor, which is necessary to understand market behaviours, is the way in which the costs of each war were financed. The main cost of the Franco-Prussian War was an indemnity of 5 billion francs, financed by the issue of standard long-term debt (called the Emprunts Thiers). Two billion of Rente 5% were first issued (21 June 1871) with an actuarial rate of 6.5 per cent, whereas the market rate was only 5.8 per cent at that time (Vaslin Reference Vaslin and Gallais-Hamonno2007). A second issue of 3 billion was launched (15 July 1872) with an actuarial rate of 6.32 per cent against only 5.59 per cent on the bond market (Vaslin Reference Vaslin and Gallais-Hamonno2007). This premium caused what could be considered a huge success: the bid was 43.86 billion. The French state sold bonds for only 3.5 billion, coming from Germany (471 million), Belgium (396), UK (334) and the Netherlands (83) (Marion Reference Marion1926). These large issues did not destabilise the French financial market. Five billion francs of new debt was just equal to the market capitalisation of the HCAC 40 in January 1871. The comparison with the stock market capitalisation is used to represent the size of these amounts. Thus, the ‘financial cost’ of the war represents only approximately 100 per cent of the market capitalisation. This new debt caused a fall in bond prices; however, financial stability was maintained. Due to the maintenance of financial stability, markets only reacted to real activity. This 5 billion cost of the Franco-Prussian War represents 25 per cent of the pre-war GDP; for the two world wars, the financial cost will be much more significant (see Table 2).
A comparison of war finance
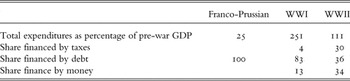
Source: Occhino et al. (Reference Occhino, Oosterlinck and White2008, pp. 1–45).
World War I can be considered to mark the birth of modern monetary inflation. Evidenced by such inflationary episodes as the American War of Independence, the American Civil War and the French Revolution, the ultimate effects of money-financed deficits were well established even before the twentieth century (Burdekin and Langdana Reference Burdekin and Langdana1995; Tallman Reference Tallman1993). Just before 1914, new public debt was non-existent in France; budgets were in surplus. The beginning of the war was financed by short-term debt. However, from 1916, long-term bond issues were massive: between 1915 and 1924, new Rente were issued for 45 billion francs. It was nearly the double of all issues during the preceding century. Indeed, between 1798 and 1914, the total of new Rente issued was only 26.3 billion francs in nominal value (Vaslin Reference Vaslin and Gallais-Hamonno2007). The impact on bond prices was direct because of the increase in interest rates resulting from this higher demand. Massive issues of long-term public debt should, arguably, have a negative impact on stock prices, since they represent an alternative choice for savers, a higher cost of debt for firms, and lead to a higher discount rate.
Nevertheless, the main effect came from monetary creation (such as advances from the Banque de France and a special short-term debt: the Bons de la Défense Nationale Footnote 5), which, in turn, caused an unanticipated level of inflation, whose impact was very strong. The Banque de France (and the Banque d'Algérie) created new money (advances) to provide francs to the government, totalling 25.9 billion by the end of the war. However, the main source of new money came from the issue of short-term debt. The value of this debt was approximately 2 billion in 1913, and it subsequently increased to 83 billion francs in 1920. To serve as a basis of comparison, the market value of the HCAC 40 in January 1914 was only 12 billion. All this new money, without any new wealth in the economy, led to the inflation of consumer prices.
Conventional wisdom suggests that nominal stock returns should be relatively high when inflation is high, and vice-versa. This view is held since stocks represent claims on real assets that should increase in value with inflation. In the case of the French stock market during World War I, it is shown (in Section III) that this theoretical relationship does not work for 37 per cent of the market capitalisation that accounts for firms with fixed sale prices. Empirical literature does not confirm this relationship. In the period 1926–96 in the United States, which presented a weak inflation compared to France, there is no discernible relationship between stock performances and inflation rates.Footnote 6 ‘Accordingly, stocks are not good hedges against inflation rates’ (Sharpe et al. Reference Sharpe, Alexander and Bailey1999). As early as 1938, John B. Williams (Reference Williams1938, p. 48) observed that the increase in the quantity of money did not impact on stock prices, unlike the effect on the prices of goods and services.
A strong correlation between inflation and stock returns is found only when studying a long-term holding period to measure stock returns. According to Boudoukh and Richardson (Reference Boudoukh and Richardson1993), a five-year holding period provides a better correlation. According to Siegel (Reference Siegel1994), the hedge against inflation is obtained only with a 30-year holding period. But this long-term approach implies a constant reinvestment of dividends, which is challenged by Rappaport (Reference Rappaport2006). This potential long-term relationship is rejected over a 10-year holding period in France after the world wars (see Le Bris and Hautcoeur Reference Le Bris and Hautcoeur2010, figure 8, p. 169); whereas the idea of a 30-year holding period cannot be tested due to the pace of historical events (i.e. World War II occurred just 30 years after the end of World War I).
To explain the negative relationship in the short term, Geske and Roll (Reference Geske and Roll1983) suggest a chain of macro-events: when stock prices fall in anticipation of worsening economic conditions, the government tends to increase the budget deficit. A rise in inflation is then expected. This idea cannot be easily accepted because of the constraints upon the public deficit during the war. Also, for the rise in stocks during World War II, the indirect relationship posited by Fama (Reference Fama1981) (i.e. stocks are positively correlated to GDP and inflation is negatively correlated to GDP) is not relevant. In any case, the inflationary periods of the two worlds wars led to real, dramatic losses for stockholders in France, as exhibited in Table 1. Nevertheless, during these two conflicts, the patterns of the market are not similar, since a paradoxically strong nominal rise is observed during World War II.
During World War I, the majority of the rules of the free capital market were preserved; the market did not suffer a strong financial repression. Rapidly, new legislation framed the financial market: as early as June 1914 a lawFootnote 7 (reinforced in May 1916) prohibited the issue of new securities without special authorisation. Moreover, all public issuers could halt their payments on existing securities (following the decree of 30 August 1914). International freedom of capital was also restricted, since capital export and securities imports were regulated. A law passed on 20 September 1915 forbade the introduction of foreign sovereign bonds on French soil (see Bernal et al. Reference Bernal, Oosterlinck and Szafarz2010). However, the export of capital was not totally impossible; foreign securities could be bought at the bourse, and the holding of gold was not forbidden. The French government only rented and bought foreign securitiesFootnote 8 to pay for importations in dollars or sterling. Prices of goods and services were kept unconstrained in most cases. An important exception applied to real estate: rents were frozen (and even suspended in many cases) from 14 August 1914. Prices of a few crucial products (sugar, grains, bread, petrol, coal, milk and wheat) were also gradually controlled (Langlinay Reference Langlinay and Chatriot2005). Due to this context of a relatively free market, stock prices adjusted without any constraint and so market values could decrease quickly.
World War I and World War II differ in the level of capital freedom. The financial repression applied can explain the surprising rise of stock prices during the second world conflict. During World War II, the monetary creation is carried out in a context where frontiers are closed to the exportation of money (the second pillar of financial repression according to Reinhart and Sbrancia Reference Reinhart and Sbrancia2011). Money can only buy national assets and is oriented to buy public debt (the first pillar of financial repression). It is a case of a financial repression, called the politique du circuit (see Oosterlinck Reference Oosterlinck2010, p. 212). This policy was designed several years before the war (see Wolff Reference Wolff1937), whilst the gold standard was not effective until 1936 (Mouré Reference Mouré2002), and it was applied to finance both the war and then the German occupation.
The war with Germany led to a first wave of monetary creation. With the mobilisation générale, 25 billion from the Banque de France was made available for the government.Footnote 9 Another agreementFootnote 10 saw an additional 20 billion being offered by the Banque. This amount was nearly equal to the value of all stocks listed; in January 1939, the market capitalisation of the HCAC 40 was only 42 billion. In February 1940, 20 billion was spent by the government; on 9 May, only 21.6 billion was spent, but, after the defeat (10 June), this figure rose to 36 billion. This advance rose to 57.7 billion on 1 August, after a new agreement between the government and the Banque de France.
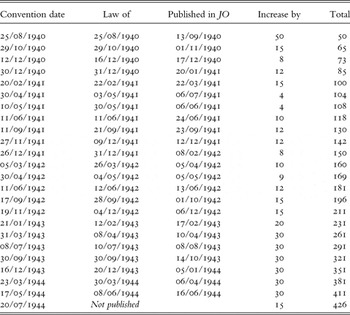
Then the German occupation caused the creation of an incredible amount of new money. The armistice convention of the 22 June 1940 set an occupation indemnity of 400 million francs a day, to be paid by the French government. In May 1941,Footnote 11 this amount decreased to 300 million a day, but rose to 500 million in winter 1942Footnote 12 upon the occupation of southern France. As a result, together with some additional expenditures (such as Italian indemnity and maintenance of military bases), the French government transferred 80 billion in 1940, 130 billion in 1941, 124 billion in 1942, 220 billion in 1943, and 142 billion in 1944 (Sédillot Reference Sédillot1945). The total amount was approximately 700 billion, of which 426 billion francs originated in a new account of advances from the Banque de France: the frais d'entretien des troupes d'occupation (see Table 3). These amounts are huge compared to the 40 billion which accounts for the market capitalisation of the HCAC 40 in January 1939. Germany was able to buy all the stocks in the HCAC 40 twice over just with the amount transferred in 1940, and 17 times over (700/40) with all the francs transferred during the war.
Money issued by the Banque de France to pay for the German occupation: loans for frais d'entretien des troupes d'occupation (in billion)
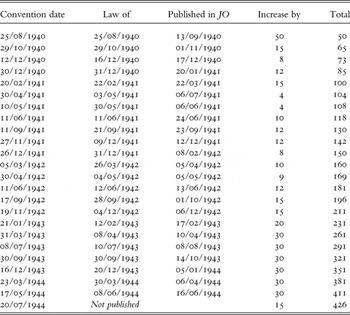
Source: Sédillot (Reference Sédillot1945).
The new money created without any new wealth generation within the French economy should arguably have caused price adjustment (i.e. inflation), but most of the prices were at that time controlled in an authoritarian manner. All prices were legally frozen from 1939, with only a few exemptions. A powerful administration (7,000 civil servants in 1943) issued 2 million procès-verbaux or statements (with strong financial penalties) in the period 1940–50 (Chélini Reference Chélini1998). At that time, people fled the franc for real assets, whose prices could increase freely in nominal value. It was a flight to quality, and a subsequent boom for stocks. Stocks representing claims on real value (for instance, real estate or retail stores with many real estate properties, like Au Printemps) provided the best performances (Marseille Reference Marseille and Dard2000). In January 1943, stock prices were four times greater than in 1939. This sharp increase occurred despite several statutes being implemented by the authorities ‘to render stocks as unattractive as possible’ (Oosterlinck Reference Oosterlinck2010, p. 211). Stock prices started to fall in 1943, probably because the end of this exceptional situation of monetary creation, which started in 1939 with the declaration of war, seemed to be on the horizon with the prospect of a German defeat. In January, the first big German defeat in Stalingrad took place, as did the fusion of the Giraud and Leclerc armies in Tunisia.
This impact of monetary creation not only affected stocks, but led to a huge price rise for all kinds of real assets. Real estate prices increased, despite new legislation requiring administrative authorisation before any transaction.Footnote 13 Stamps, carpets, jewellery and books experienced a massive boom (Sédillot Reference Sédillot1945). Using the hedonic method, Oosterlinck (Reference Oosterlinck2009) built an art index based upon 3,000 canvasses sold during the war in Drouot, the main French auction house. General movements are similar to those of the stock market, but are stronger, with a similar peak in January 1943, indicating prices six times those of the pre-war period.
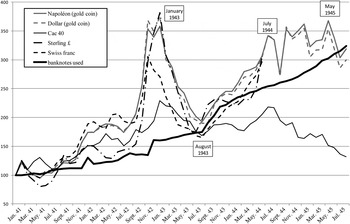
Figure 3 displays the prices of gold, currencies, stocks and the amount of banknotes as an indicator of monetary creation. It is noticeable that the stock increase is very weak compared to the prices of gold and foreign currencies (as in the black market). This could arguably be due to the characteristics of these assets: gold and currencies can be used to pay for anything at any time, unlike stocks. Stocks and firms can support political restrictions (such as taxation, controls on profits and dividends), but gold and currencies cannot. Indeed, whilst the stock market is official, the market for gold and currencies is black. Moreover, with the end of the war, assets other than stocks continued to grow, whereas stock prices remain stable despite the pursuit of inflation.
Prices of English stocks, gold, currency and bank notes used during World War II

To summarise, the new money issued (according to the politique du circuit) during the war led to an increase in the prices of real assets, including stocks. The prospect of a German defeat induced an initial fall in the price of real assets in 1943. The pursuit of inflationary policies after the Libération caused a resurgence of real asset prices. This was the case for all assets studied except for stocks, since other, better hedging assets were more accessible within the more open economy observed after the Libération. But, arguably, the nationalisations that occurred at this time could also have discouraged investment in stocks.
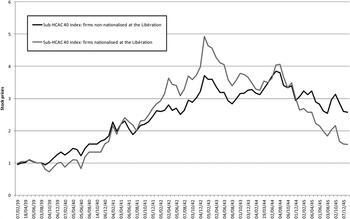
The ‘flight to quality’ explanation for the behaviour of stock prices during World War II can be contested by another important potential factor, namely the gradual integration of the nationalisations, with a weak indemnity, of the Libération. To test the impact of the nationalisations, two sub-indices of the historical CAC 40 were constructed. The first one includes firms, which were not nationalised, and the second one only includes firms that were nationalised at the Libération. The monthly values of these two sub-indices are displayed in Figure 4.
Firms non-nationalised compared to firms nationalised at the Libération, 1939–46

In January 1943, at the peak of the stock prices, the index of future nationalised firms was higher than that of the non-nationalised firms. Nevertheless, the two indices were close at the beginning of 1944. The divergence ultimately occurred during that year. Thus, nationalisations and, more importantly, low compensations were not priced early. It does not come as a surprise, since uncertainty was exceptionally high at this time. Even if the principle of nationalisation could be expected, detailed arrangements for financial compensation were very vague. For example, with regard to the coalmines, the first nationalised industry, the nationalisation that had been planned to be put into effect from the 1 January 1945 was announced on the 14 December 1944. However, the project of financial compensation would not be known until 15 months later, on 19 March 1946. Thus, this comparison allows ‘future nationalisation’ to be rejected as the leading driver of the behaviour of stock prices during the war. Wars caused spectacular price variations, but they also changed the nature of the market significantly.
III
In 1871 and 1872, in order to pay the indemnity to the Prussians, two big issues of debt took place, which led to a high level of interest rate in France. This debt of 5 billion francs was approximately 25 per cent of the French GDP (Occhino et al. Reference Occhino, Oosterlinck and White2008, pp. 1–45). The second issue of 3 billion francs is the most significant of the entire century; it was sold with a 6.32 per cent actuarial rate (Vaslin Reference Vaslin and Gallais-Hamonno2007). The prior interest rate maximums (above 5.5 per cent) were short-lived (see Appendix).Footnote 14 After the massive issues of 1871–2, the interest rate fell more slowly, in comparison to the previous interest rate peaks of 1830, 1848 and 1852. A new progressive wave of saving and the huge amount of debt issued to pay the post-war tribute go some way to explain this slow decrease in interest rates.
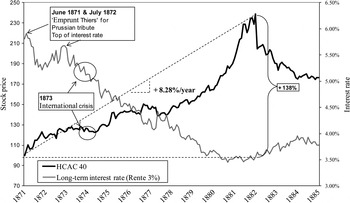
This gradual interest rate decrease was accompanied by a symmetrical increase in stock prices. This increase was very regular and large, with 8.28 per cent per annum in geometric mean between January 1871 and January 1882. While a financial crisis affected international markets in 1873, the French market was, at the same time, unconcerned, since all weak business had been settled after the French defeat two years previously (Juglar Reference Juglar1889). A decrease in interest rates caused a mechanical growth in stock prices, since bond investment was less attractive, the discount rate decreased, and an indirect effect caused the fall in the cost of debt for firms. Therefore, a relationship can be said to exist between this progressive decrease in interest rates and the growth in stock prices. This gradual increase in stock market prices ended with the ‘crash of the Union Générale’ in January 1882 (see Bouvier Reference Bouvier1960).
Stock prices and interest rates (Rente 3%), 1871–85

After World War I, the volatility of the movements of prices increased. The mean and standard deviation of monthly price variations were 0.10 per cent (non-annualised) and 2.20 per cent (non-annualised) before 1914; however, they became 0.47 per cent and 5.92 per cent after World War I (see Le Bris and Hautcoeur Reference Le Bris and Hautcoeur2010). Of course, the real economic situation was more volatile after 1914, but this cannot explain the entire rise in price volatility. The end of the gold franc provides a new source of common risk: monetary value.
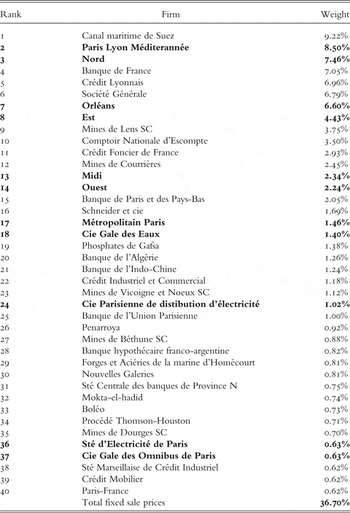
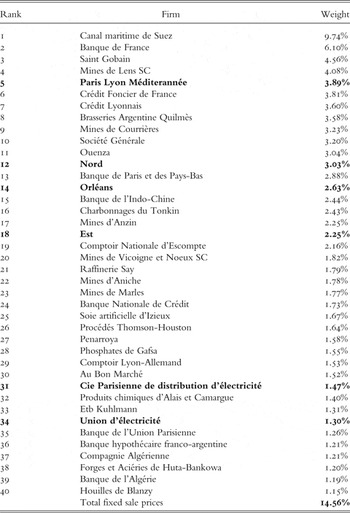
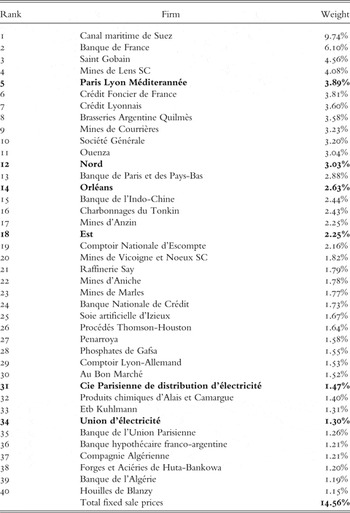
A second long-term effect of World War I was the disappearance of most of the public utility firms as blue chips securities in the French stock market. A well-known explanation is the high taxation level after the war, the impact of which had been multiplied by inflation, since the tax rate was applied on nominal apparent profits (see Hautcoeur Reference Hautcoeur and Grottard2001). However, the effect of inflation is more violent upon firms with fixed sale prices. In 1914, 37 per cent of the market capitalisation was composed of businesses with a ‘fixed sale price’ (see Table 4a). All concession firms (electricity, water, railways) had contracts with political authorities; they were unable to freely determine their selling price. Inflation increased costs for these firms, but sale prices were fixed by contracts, thus, these firms could not perform in the same manner. The rise in their spending, with stable revenues, led these firms to fail, or, at the very least, to a large decrease in their profits. Ten years after the start of the war, less than 15 per cent of market capitalisation was composed of firms with ‘fixed sale prices’ (see Table 4b).
HCAC 40 in 1914 with firms' fixed sale prices (in bold)

HCAC 40 1924 with firms' fixed sale prices (in bold )
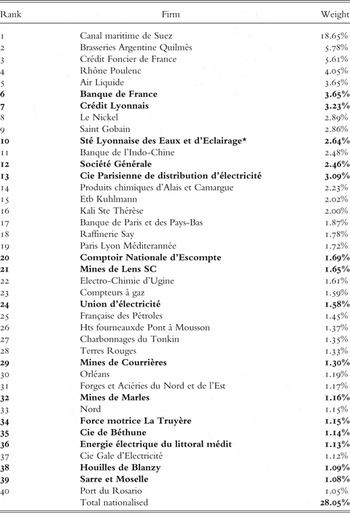
World War II has had a long-term impact on the components of the stock market. The nationalisations of the Libération can be considered as an outcome of the war. This policy was in the programme of the Conseil National de la Résistance.Footnote 15 It can be argued that, at the very least, the war accelerated the movement toward nationalisation. Several industries were nationalised, including the banking (four major companies only), the energy (electricity, coal, gas) and the insurance (not present in the HCAC 40 since this industry was not concentrated enough) sectors; 28 per cent of the 1939 HCAC 40 was nationalised (see Table 5). It is the first time in French history that such a big part of the market artificially disappeared. For instance, the nationalisation of the railways in 1936 represented only 5.88 per cent of the 1936 HCAC 40.
HCAC 40 in 1939 with firms nationalised after World War II (in bold)

* water part is not nationalised.
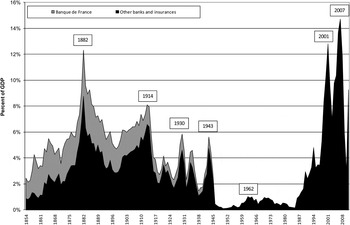
These nationalisations affected the industrial composition of the French stock market for a long period. The diversification of the stock market decreased, since specific industries disappeared. For example, the banking industry, which had played a major role in the stock market since 1854, became only a minor player. Before World War II, the market value of the banking industry, without the Banque de France, was always above 2 per cent of GDP; however, after the nationalisations it only accounted for approximately 0.1 per cent. Just a few decades later, a new listed bank industry was established. Indeed, classical banking activities were legally frozen. For example, it was at that time forbidden by law to open new agencies, and this law remained active until 1966. New banks developed new markets to finance real estate (Union du Crédit pour le Bâtiment), consumption loans (Cetelem) and business (Indosuez). It is interesting to note that policymakers in charge of drafting nationalisation laws were aware of this problem. In the case of the insurance nationalisation law, it is mentioned that there was a need ‘to maintain a free industry, strong enough to be able to adapt to new insurance business’,Footnote 16 assuming implicitly that nationalised firms would be unable to adapt their business model. Despite the existence of these new banks, privatisations of major French banks (Société Générale and BNP) during the 1980s were necessary in order to restore the banking industry to a place in the stock market similar to the one it occupied before World War II.
Market capitalisation of the bank industry to GDP, 1854–2010

IV
The nationalisations of the Libération led to the large-scale destruction of market value. For French ex-stockholders, nationalisation indemnities had been paid between 1945 and 1946 in the form of new specific state-guarantee bonds. During each of the years 1946, 1947 and 1948, the inflation rate was above 50 per cent. For a fixed rate bond, three years of 50 per cent inflation led to a real loss of 90 per cent. As a result, a large part of the pre-war market value of nationalised industries had disappeared by 1950. The value of the indemnity paid to stockholders of nationalised assets is arguably underestimated by these modalities. To illustrate this point further, it is worth mentioning that foreign stockholders of gas and electricity firms benefited – thanks to the threat of a lawsuit – from a more generous level of compensation, with a currency guarantee on capital and interest, as well as an amortisation on 7 years instead of 50 years. As a result, in 1950 foreign ex-stockholders received one-third of the annual payment, whereas they held only 7 per cent of the capital of the nationalised firms (Schaufelbuehl Reference Schaufelbuehl2009).
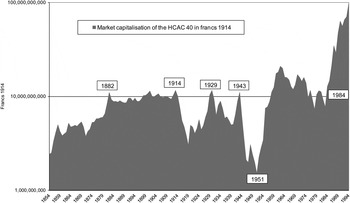
These losses for bondholders, who were ex-stockholders of firms that became nationalised, were added to the dramatic real performances of stock markets during the two world wars. The real performance of an investment in stocks in 1914 brought a loss of 66 per cent by 1921. This already weakened market capitalisation suffered a further fall of 86 per cent during World War II (Table 1). These successive instances of market value destruction caused a fall in the role of the stock market in the economy. The ratio of the capitalisation of the 40 biggest stocks to French GDP was 22 per cent in January 1914. This ratio was only 7.71 per cent in January 1919. Market capitalisation to GDP ratio fell again after World War II, from 8.16 per cent to less than 2 per cent. The 1914 level was only again reached in 1994 (Le Bris and Hautcoeur Reference Le Bris and Hautcoeur2010). For each war, the changes were mainly the consequences of political choices: inflation with fixed selling prices after World War I and inflation under financial repression and nationalisations during World War II. World wars were clearly the source of the first phase of the ‘Great Reversal’ (Rajan and Zingales Reference Rajan and Zingales2003) of the role of the market in the French economy. The market value of the 40 most prominent French firms, in constant francs, provides a singular illustration of this decline. Despite the increase in GDP, the 1951 value in gold (franc 1914) of the main French listed firms was only 15 per cent of what it was in 1914. The 1914 value of 10 billion gold francs was only reached again in 1958, and then finally surpassed in 1984.
Market capitalisation of the HCAC 40 firms in constant francs, 1854–1994

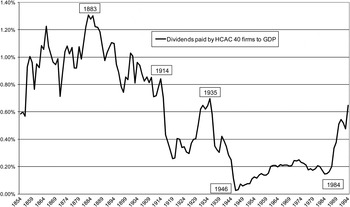
These changes in the ratio of market capitalisation to GDP, or the long-term decline in market value, fit well with what is observed on dividends paid by French firms. The market capitalisation can be considered as the present value of all future dividends of the firms. The Franco-Prussian War did not have any long-term effect on dividends. After World War I, the worst year for dividends was 1919, when only 100 million gold francs of dividends were paid. However, by the end of the 1920s, the value level of pre-war dividends paid had almost recovered. The impact of World War II was clearly stronger, since the value of dividends paid fell to just 10 million (franc 1914) in 1946 and 1947. The level of dividends in 1914 was only reached again in 1965, whereas during this time the GDP of France had multiplied 3.5 times. Furthermore, the amount of dividends paid in 1965 was close to 1883 levels (Le Bris and Hautcoeur Reference Le Bris and Hautcoeur2010). The overall situation seems worse when the ratio of dividends paid to GDP is examined. The ratio was between 0.80 and 1.20 per cent before 1914, falling to 0.40 per cent after World War I, and to 0.20 per cent after World War II. This ratio remained at such a low level until the end of the 1980s. Therefore, given these facts, it becomes clear that the role of the market in the economy became considerably less significant after the effects of the two world wars.
Dividends paid by HCAC 40 firms to GDP, 1855–1984

V
Wars have had a clear impact on stock prices. In the short term, this effect depended on the way the war was financed. Despite the French defeat, the Franco-Prussian War was not disproportionately expensive for French savers. The politique du circuit, a case of financial repression, explains the paradoxical rise of stock prices during World War II. Nevertheless, the two world wars led to a final and dramatic loss for stockholders, faring only a little better than bondholders did. Furthermore, war conflicts did not only affect the stock market via direct effects on performances. Each war caused structural changes in the French stock market. The Franco-Prussian War increased the interest rate, which was followed by a slow decrease, leading to a symmetrical gradual increase in stock prices until the crash of January 1882. World War I caused a structural change in the stock price returns, which was characterised by a large increase in price volatility. Moreover, the end of the stability of consumer prices caused the failure of most of the public utilities firms, since they supported fixed sale prices. World War II ended with the nationalisation of several industries, whose major consequence was a reduced and less diversified stock market.
The successive losses caused by each world war, added to the poorly compensated nationalisation of one-third of the market at the Libération, led to the destruction of almost all the market value. The stock market could therefore no longer play its role in the economy. The major result of the two world wars was thus a decrease in the role of the market in the French economy. From this point of view, the period marked by the beginning of World War I ceased only at the beginning of the 1990s, which is consistent with the idea of the ‘short historical twentieth century’ (Hobsbawn Reference Hobsbawn1994). It will be interesting to study the case of other belligerents.
Appendix. Interest rates of long-term government bonds, 1752–2010
This figure presents an original long-term figure of the rate observed on French long-term bonds using a compilation of several studies. It should be noted that before 1960, these rates are derived from perpetual bonds and from solely 10-year bonds afterwards. 1752–97: Emprunt d'Octobre (Velde in Sylla online-database), 1798–1824: Rente 5% (Vaslin), 1825–52: Rente 3% (Courtois), 1853–1950: Rente 3% (author), 1951–69: Rente 5% (author), 1970–2006: Emp. Etat LT (Banque de France) 2007–10: OAT TEC 10 (Agence France Trésor)