Controversy continues to surround the issue of Germany's level of labor productivity in manufacturing compared with that of Britain before World War II. A long tradition going back at least as far as Ernest Williams has suggested that Britain was already falling behind Germany in manufacturing in the late nineteenth century, and this view was bolstered by the views of Alexander Gerschenkron and David Landes, who saw Germany as modernizing before World War I on the basis of heavy industry.1
Williams, Made in Germany; Gerschenkron, Economic Backwardness; and Landes, Unbound Prometheus.
Chandler, Scale and Scope.
However, this traditional view has proved difficult to square with work in the historical national accounts (HNA) framework. In a series of studies working at the level of the aggregate economy, Angus Maddison showed that GDP per hour worked and GDP per employee were substantially higher in Britain than in Germany before World War II, projecting with times series from a benchmark close to the present.3
Maddison, Phases, Dynamic Forces, Monitoring, and World Economy.
Fremdling, “Productivity Comparison.”
Ibid., pp. 39–42; and Hoffmann, Das Wachstum.
By projecting with the time series of Charles Feinstein and Hoffmann from a benchmark for circa 1935 produced by Broadberry and Fremdling, Broadberry then showed that labor productivity in manufacturing was slightly higher in Germany than in Britain in the pre–World War I period.6
Feinstein, National Income; Hoffmann, Das Wachstum; Broadberry and Fremdling, “Comparative Productivity”; and Broadberry, “Manufacturing.”
Hoffmann, Das Wachstum; and Broadberry and Fremdling, “Comparative Productivity.”
Hoffmann, Das Wachstum; Ritschl, “Spurious Growth”; Burhop and Wolff, “Compromise Estimate”; Broadberry and Fremdling, “Comparative Productivity”; and Fremdling and Stäglin, “Die Industrieerhebung.”
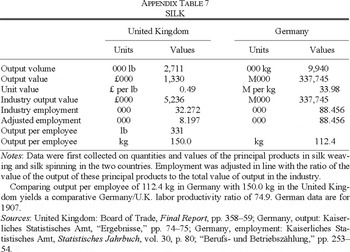
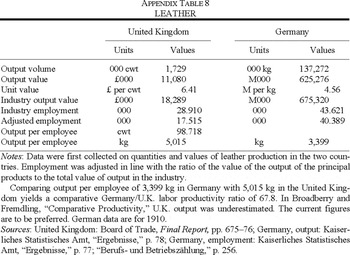
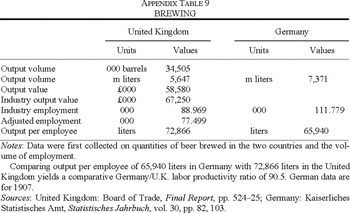
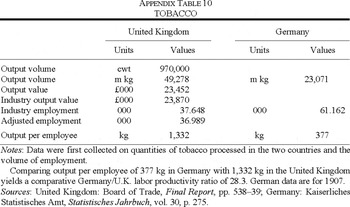
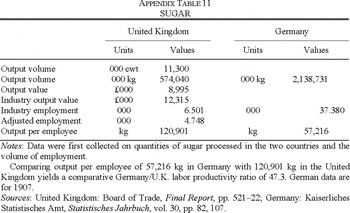
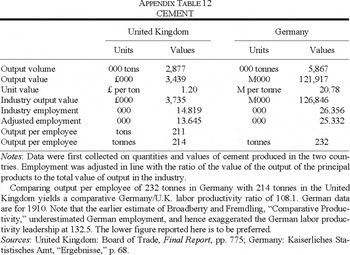
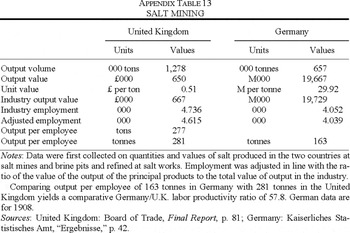
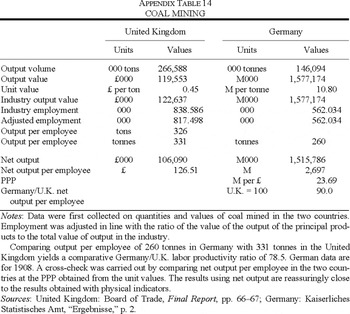
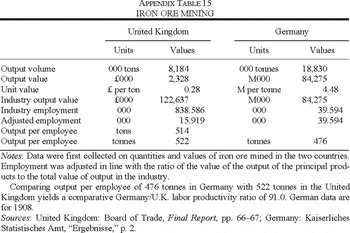
It would therefore be very helpful to have a benchmark estimate of the comparative Germany/U.K. labor productivity level in manufacturing for the pre–World War I period that is entirely independent of the HNA time series data. The first objective of this article is to provide such an estimate, based on the British industrial census for 1907 and official German data for a number of industries in 1907/08. As well as establishing more firmly the aggregate picture of broadly equal labor productivity in the pre–World War I period, this new benchmark provides for the first time disaggregated estimates of comparative labor productivity in different branches of industry for the pre–World War I period. The sectoral picture suggests that a substantial German labor productivity lead in heavy industry (chemicals, metals) was offset by a substantial British labor productivity lead in light industry (textiles and food, drink and tobacco). In addition, Britain had a labor productivity advantage in mining, an important nonmanufacturing industry.
A second objective is to experiment with alternative indices of German manufacturing output, to check for the consistency between time series projections and direct benchmark estimates. The two benchmarks for circa 1907 and circa 1935 are broadly consistent with the time series projections based on the Hoffmann index for Germany. A new series of Burhop and Wolff for the pre–World War I era can be incorporated in a way that is consistent with the two benchmarks, but suggests a somewhat larger German labor productivity lead between the 1870s and the 1890s than suggested by the Hoffmann series.9
Burhop and Wolff, “Compromise Estimate”; and Hoffmann, Das Wachstum.
Ritschl, “Spurious Growth.”
A third objective is to rework Fremdling's income-based estimates of comparative Germany/U.K. industrial labor productivity, based on nominal net income per employee in British and German industry, converted at PPPs for agricultural and industrial products and converted at market rates.11
Fremdling, “Productivity Comparison.”
Burhop and Wolff, “Compromise Estimate”; and Hoffmann, Das Wachstum.
A BENCHMARK FOR CIRCA 1907
Data Sources
Although there was no full industrial census for Germany before World War I, much high quality information was collected. Some of this information was published in the form of a complete employment census for 1907, while for a number of industries, further information on the quantity and value of output and material inputs appeared in various sources. The Imperial Office of the Interior (Reichsamt des Inneren) started industry surveys regarding output (value and volume), input (value and volume), employment, and wages for some industries already in 1897. After the turn of the century, such surveys were conducted several times and for some industries on an annual basis. The findings were finally published by the Imperial Statistical Office.13
Kaiserliches Statistisches Amt, “Ergebnisse”; and “Die Ergebnisse.”
In contrast to the British census of production, Germany's statistical office did not strictly apply the concept of value added. The modern national accounting standards use the term “gross value added” as the value of output less the value of intermediate goods consumed in the production process. The British census of 1907 used the term net output instead of gross value added. The German term Nettoproduktionswert basically corresponds to the modern concept of gross value added, but because the Imperial Office of the Interior did not collect comprehensive data on intermediate goods consumed, this measure is likely to be biased.14
Tooze, Statistics, pp. 56–57.
Nevertheless, this industrial census is a very useful source, covering nearly all firms in the surveyed industries. All firms listed by trade associations (Berufsgenossenschaften) were asked to submit anonymously information about the type of business, the number of establishments, the number of employees, the wage bill, the volume and value of intermediate goods consumed, and the volume and value of production and of goods sold.15
All employees of the firms listed by the Berufsgenossenschaften were counted for the industrial census, not only the insured employees.
In our judgment, these sources are sufficient to allow us to make reasonably reliable estimates of physical output per worker in Germany in 1907/08, along the lines of those produced for 1935/36 by Laszlo Rostas and reworked by Broadberry and Fremdling.16
Rostas, Comparative Productivity; and Broadberry and Fremdling, “Comparative Productivity.”
Board of Trade, Final Report.
Weighting Scheme
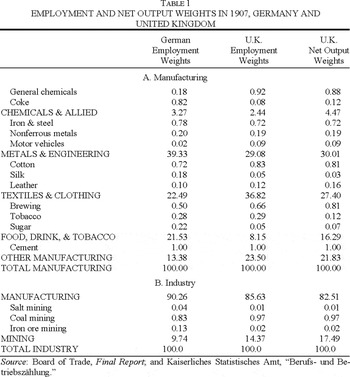
Although it is possible to estimate net output for some German industries, we do not have sufficient information to do this reliably for the whole manufacturing sector. Hence for Germany, we are forced to rely on employment weights, shown here in Table 1. For the United Kingdom, we have both employment and net output weights, which are also shown in Table 1. We shall see, using U.K. data, that the choice of net output or employment weights makes little difference, so that the lack of German net output weights is unlikely to be too serious a problem.

The structure of industry was quite different in the two countries, with German manufacturing more oriented towards heavy industry, particularly metal production, and British manufacturing more oriented towards light industry, particularly textiles and clothing. However, note that although Britain had quite a large share of net output in food, drink, and tobacco, this accounted for a smaller share of employment, because of high net output per worker. Britain also had a substantially larger share of the labor force in mining than did Germany.
The weighting scheme in Table 1 is derived in the following way. First, employment (and also net output for Britain) was allocated across major sectors (indicated in upper case letters) from census sources.18
Ibid.; and Kaiserliches Statistisches Amt, “Berufs- und Betriebszählung.”

Results
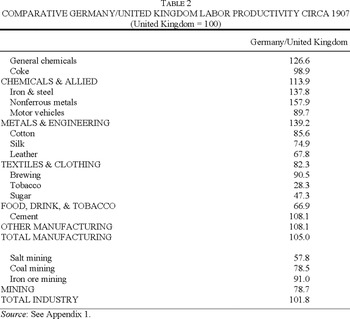
The individual industry results reported in Table 2 are based mainly on comparisons of physical output per worker in the two countries, with a value above 100 indicating a German productivity advantage and a value below 100 indicating a British productivity advantage. The single figure for each sector is arrived at by taking the geometric mean of results using German and British employment weights. The figure for total manufacturing is 105.0, which is the geometric mean of 105.5 using German employment weights and 104.6 using British employment weights. Note that using British net output weights makes no real difference, yielding a comparative productivity ratio of 104.5. For total industry the geometric mean of 101.8 is derived from 102.9 using German employment weights and 100.8 using British employment weights, whereas the use of British net output weights yields a figure of 100.0.
One might argue that these comparative labor productivity measures are biased because the British data are for 1907 throughout, whereas German data are for 1907 (motor vehicles, cotton, silk, brewing, tobacco, sugar), 1908 (chemicals, coke, iron & steel, nonferrous metals, mining), and 1910 (leather, cement) respectively. Taking employment weights, 28 percent of the German data are for 1907, 68 percent for 1908, and 4 percent for 1910. Between 1907 and 1908 (1910) labor productivity increased faster in Germany than in Britain, thus our benchmark might overstate German productivity leadership. If projections are based on Hoffmann's classic figures, comparative labor productivity improved in favor of Germany between 1907 and 1908 (1910) by 8.2 percent (14.7 percent).19
Hoffmann, Das Wachstum.
Just as important as the results for total manufacturing and total industry is the distribution of comparative productivity ratios across major sectors. The key finding here is that Germany had higher labor productivity in heavy manufacturing, particularly in ferrous and nonferrous metals, but also in chemicals, while Britain had higher productivity in light manufacturing, particularly textiles and clothing and food, drink, and tobacco. Britain also had a productivity advantage at this time in mining.
TIME SERIES PROJECTION, 1871–1938
Methodological Considerations
Benchmarks are available only for a small number of years. To build up a full picture of the evolution of comparative productivity over time, it is necessary to use time series to project forwards and backwards. However, this inevitably raises potential index number problems because of variation in the weighting schemes used in the output time series for the two countries, and differences in the proportion of output covered between the two benchmarks for each country. This has led to some controversy since the work of the Income Comparisons Project (ICP) for the post-1950 period, with H. Krijnse Locker and M. D. Faerber providing an early statement of the problem.20
Krijnse Locker and Faerber, “Space and Time.”
Having initially provided a set of benchmarks that conflicted with time series projections, Alan Heston, Robert Summers and Bettina Aten have acknowledged that this is unsatisfactory in the following terms:
If per capita G.D.P. in India relative to Korea is 40% in a 1970 benchmark and 35% in a 1975 benchmark, then one inference is that the growth rate per capita in Korea must have been about 5% more than in India between 1970 and 1975. Often such an implied result is not consistent with the national growth rates in the two countries, posing a problem to users. 21
Heston, Summers and Aten, “Price Structures,” p. 2.
One solution offered by Summers and Heston to the problem of inconsistency between benchmarks and time series projections was to change the national growth rates as well as the benchmarks, in a process known as “consistentization.”22
Summers and Heston, “New Set.”
It was hard to sell the idea of modifying country growth rates to countries, international organizations and to men or women of affairs. Therefore in our recent uses of consistentization we have not modified country growth rates, but only the different benchmark estimates.23
Heston, Summers and Aten, “Price Structures,” p. 6.
The methodology adopted by Broadberry has been to recognize the need to tell a coherent story, but at the same time, to acknowledge the inevitability of some disagreement between constant price time series projections and current price benchmark estimates.24
Broadberry, “Manufacturing,” “How Did the United States?” and “Relative Per Capita Income”; Krijnse Locker and Faerber, “Space and Time”; Nuxoll, “Differences”; and Dowrick and Akmal, “Contradictory Trends.”
Broadberry, “Manufacturing.”
Applying this to the case of the United States and the United Kingdom during the period 1870–1990, Broadberry was critical of Marianne Ward and John Devereux's claim, on the basis of a new benchmark, that U.S. per capita income in 1872 was 18 percent higher than in the United Kingdom, compared with Maddison's result, based on time series projection, that the United States was at 78 percent of the U.K. level, a discrepancy of 40 percentage points, or more than 50 percent of the Maddison estimate.26
Broadberry, “Relative Per Capita Income”; Ward and Devereux, “Measuring British Decline”; and Maddison, Monitoring.
Broadberry, “How Did the United States?”
Feinstein, National Income; Kendrick, Productivity Trends; and Maddison, Monitoring.
Choice of Benchmark
The first issue that must be decided is the choice of benchmark on which to base the time series projections. As we have constructed a new benchmark for 1907, this obviously provides one option for the base. However, we could alternatively use either the Broadberry and Fremdling benchmark for 1935 or the Fremdling, Herman de Jong and Marcel Timmer benchmark for 1935/36.29
Broadberry and Fremdling, “Comparative Productivity”; and Fremdling, de Jong and Timmer, “British and German Manufacturing.”
Fremdling and Stäglin, “Die Industrieerhebung” and “Eine Input-Output-Tabelle”; and Reichsamt für wehrwirtschaftliche Planung, Die deutsche Industrie.
Broadberry and Fremdling, “Comparative Productivity.”

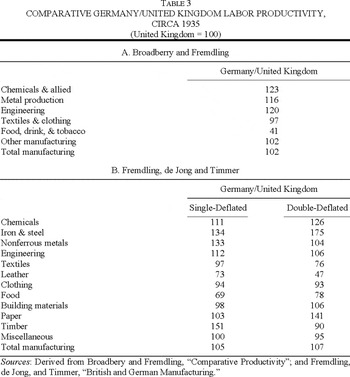
A comparison between the Broadberry and Fremdling and the Fremdling, de Jong, and Timmer benchmarks for circa 1935 is provided in parts A and B of Table 3. Reassuringly, there is a strong measure of agreement amongst the different benchmarks, despite the conceptual differences and the distortions introduced by military planners. First, note the narrow range for the total manufacturing comparative productivity ratio in the different studies, with Fremdling, de Jong, and Timmer arriving at a ratio of 105 or 107, compared with the Broadberry and Fremdling ratio of 102.32
Fremdling, de Jong and Timmer, “British and German Manufacturing”; and Broadberry and Fremdling, “Comparative Productivity.”
Broadberry, “Manufacturing.”
Fremdling, de Jong, and Timmer, “British and German Manufacturing”; and Broadberry and Fremdling, “Comparative Productivity.”
Revisions to the German Time Series Data
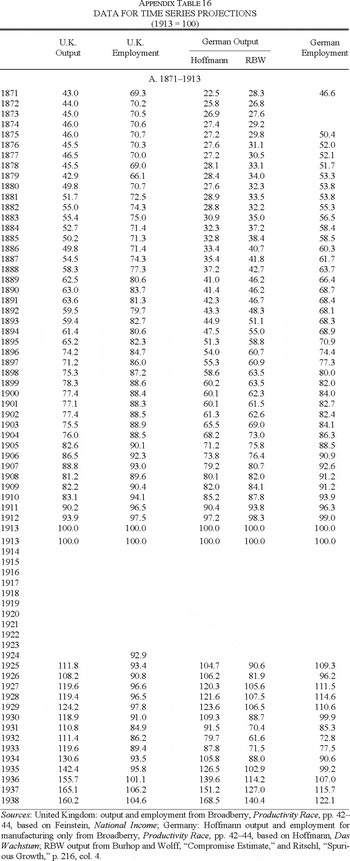
The British historical national accounts for this period are uncontroversial and we employ Feinstein's index of production for manufacturing, as in Broadberry's previous work.35
Feinstein, National Income; and Broadberry, Productivity Race.
Feinstein, National Income.
Hoffmann, Das Wachstum.
Feinstein, National Income; Hoffmann, Das Wachstum; and Broadberry, “Manufacturing.”
Hoffmann's industrial production index was calculated from time series of physical output for 11 industries and a labor income series for one industry (metal processing).39
Hoffmann, Das Wachstum, pp. 344–95.
Ibid., pp. 389–95.
We will report first the results of time series projection using the Hoffmann industrial production index recalculated on to a manufacturing-only basis by Broadberry.41
Hoffmann, Das Wachstum; and Broadberry, Productivity Race.
Hoffmann, Das Wachstum.
One of the most important output series used by Hoffmann has been criticized recently. Ritschl presents a new time series for metal processing, the most important branch of German industry, for the years 1913 and 1925–1938, which suggests that the level of output in the interwar period was much lower relative to the prewar period than in the Hoffmann series.43
Ritschl, “Spurious Growth”; and Hoffmann, Das Wachstum.
It is not clear how Ritschl treats the territorial losses of Germany after World War I. Territories covering about 35 percent of German 1913 steel output were lost after the War. Ritschl fixes output of metal processing industry to 1913 = 100, but it is not clear if he uses 1913 territory or 1921 territory to do this.
Burhop and Wolff, “Compromise Estimate.”
Ibid.
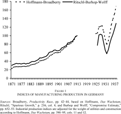
Two indices of manufacturing output in Germany between 1871 and 1938 are plotted in Table 1. First, there is the original Hoffmann industrial production index adjusted on to a manufacturing-only basis by Broadberry.47
Hoffmann, Das Wachstum; and Broadberry, Productivity Race.
Ritschl, “Spurious Growth”; and Burhop and Wolff, “Compromise Estimate.”
Ibid.; and Hoffmann, Das Wachstum.
Ritschl, “Spurious Growth”; and Hoffmann, Das Wachstum.

FIGURE 1 INDICES OF MANUFACTURING PRODUCTION IN GERMANY
Results
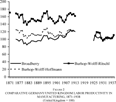
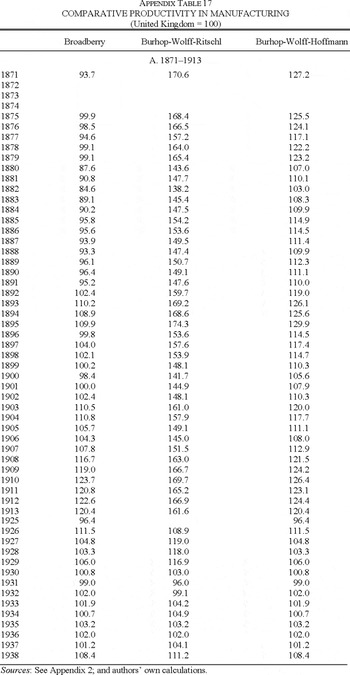
Figure 2 displays the time series projection from the 1935 Broadberry/Fremdling benchmark estimate for comparative Germany/U.K. labor productivity in manufacturing.51
Broadberry and Fremdling, “Comparative Productivity.”
Broadberry, Productivity Race; and Hoffmann, Das Wachstum.

FIGURE 2 COMPARATIVE GERMANY/UNITED KINGDOM LABOR PRODUCTIVITY IN MANUFACTURING, 1871–1938 (United Kingdom = 100)
The second projection in Table 2, labeled “Burhop-Wolff-Hoffmann,” uses Burhop and Wolff's data for the prewar period and Hoffmann's data for the interwar period.53
Burhop and Wolff, “Compromise Estimate”; and Hoffmann, Das Wachstum.
Finally, we calculated an index using Burhop and Wolff's data for the prewar period and Ritschl's data for the interwar period.54
Burhop and Wolff, “Compromise Estimate”; and Ritschl, “Spurious Growth.”
Ibid.; and Hoffmann, Das Wachstum.
INCOME BASED ESTIMATES
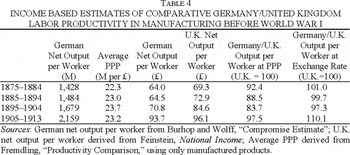
We can compare these findings based on output data with alternative estimates of comparative Germany/U.K. labor productivity in manufacturing based on income data. This is important because Fremdling found labor productivity in German industry to vary between around half to two-thirds of the British level between the 1870s and World War I, which appears to conflict strongly with our findings of broadly equal labor productivity.56
Fremdling, “Productivity Comparison.”
Burhop and Wolff, “Compromise Estimate”; and Hoffmann, Das Wachstum.
Fremdling, “German National Accounts”; and Hoffmann, Das Wachstum.
In addition, some heavy industrial products were also protected by import duties.
Fremdling, “Productivity Comparison.”
Ibid., p. 30.

In Table 4, we derive British net output per employee from information in the historical national accounts combined with the 1907 Census of Production. This involves using Feinstein's time series of NNP from the income side to project the value of net output in manufacturing from the 1907 Census, and the time series of employment in manufacturing from Broadberry to project the 1911 manufacturing labor figure from Feinstein.62
Feinstein, National Income, table 1; Broadberry, Productivity Race, p. 43; and Feinstein, National Income, table 60.
Deane and Cole, British Economic Growth, p. 166.
Hoffmann, Das Wachstum, p. 390.
Burhop and Wolff, “Compromise Estimate,” p. 642; and Hoffmann, Das Wachstum.
The whole period is divided into four sub-periods, 1875–1884, 1885–1894, 1895–1904, and 1905–1913. The average PPPs for manufactured products move more closely in line with the exchange rate than Fremdling's PPPs for a wider range of commodities, which were heavily influenced by protected agricultural products.66
Fremdling, “Productivity Comparison,” p. 33.
Engel, “Die erwerbstätingen juristischen Personen,” p. 468, gives some support to our hypothesis of an equal manufacturing labor productivity in Britain and Germany around 1880. According to our extrapolation, nominal manufacturing labor productivity was 1,428 M between 1875 and 1884. Engel estimates a gross manufacturing output per worker of 3,600 M for the early 1870s. A reasonable assumption is that net output per worker (labor productivity) is about 40 percent of gross output, or 1,440 Marks, a figure quite close to our extrapolation.
CONCLUSION
Labor productivity in manufacturing was about the same in Germany and Britain from the late nineteenth century to World War II, supporting the earlier findings of Broadberry.68
Broadberry, Productivity Race.
Williams, Made in Germany; Gerschenkron, Economic Backwardness; and Landes, Unbound Prometheus.
Starting from Broadberry and Fremdling's 1935 benchmark estimate of comparative labor productivity in manufacturing, we project backwards to 1871 and forwards to 1938 using new time series data of Germany's manufacturing output.70
Broadberry and Fremdling, “Comparative Productivity.”
Hoffmann, Das Wachstum, p. 390; and Burhop and Wolff, “Compromise Estimate.”
We support our finding for the pre–World War I period using new income data from Burhop and Wolff.72
Ibid.
Fremdling, “Productivity Comparison.”
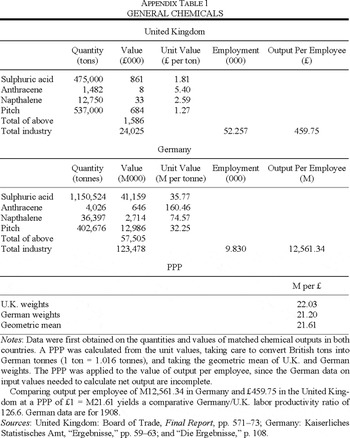
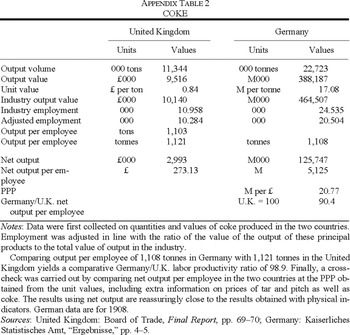
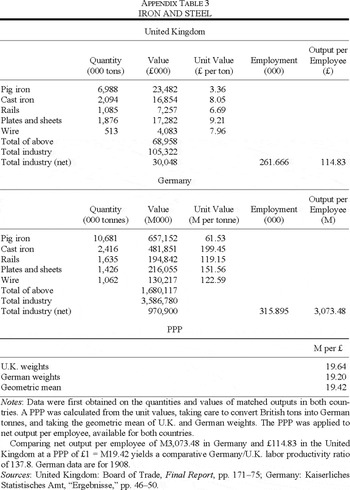
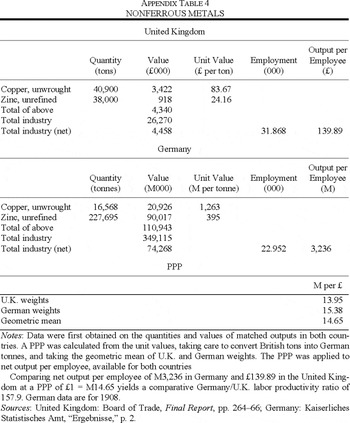
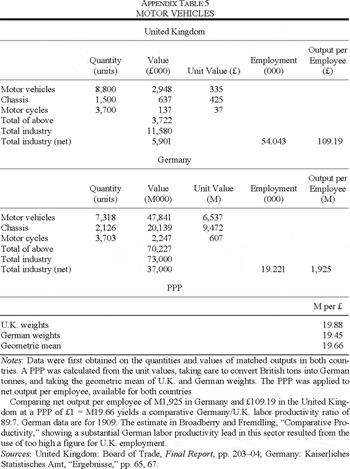
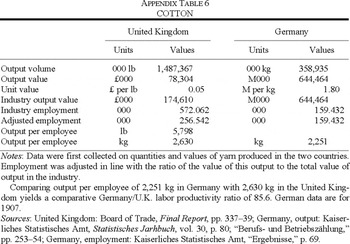
Appendix 1: Underlying Data for 1907 Benchmark
General Note: individual figures in the tables have been rounded, whereas the calculations use unrounded figures. This results in a few very small apparent discrepancies.


Appendix 2: Data For Time Series Projections

Appendix 3: Comparative Productivity in Manufacturing

We would like to thank participants in the Berlin Colloquium, the Second Conference on German Cliometrics, and the referees for helpful comments. Remaining errors are our responsibility. The financial support of the European Commission Marie Curie Actions, (Contract no. MRTN-CT-2004-512439) as well as the support of Juliane Schrader is gratefully acknowledged.