Introduction
Magnetic materials that exhibit a coupling between structural and magnetic transitions, also known as magnetostructural phase transitions (MSTs), have received considerable interest in terms of fundamental science and technological applications due to their remarkable magnetoresponsive properties, namely giant magnetocaloric effects (MCEs), magnetoresistance, magnetostriction, and magnetic shape memory effects.[Reference Pecharsky, Gschneidner and Pecharsky1–Reference Kainuma, Imano, Ito, Sutou, Morito, Okamoto, Kitakami, Oikawa, Fujita, Kanomata and Ishida5] Recently, MnCoGe compounds that belong to the family of materials that undergo MSTs with the chemical composition MM′Z, where M and M′ are 3d transition elements, and Z is Si or Ge, are actively studied as materials with the potential to show large MCEs. It has been reported that stoichiometric MnCoGe crystallizes in an orthorhombic TiNiSi-type structure (space group Pnma) or hexagonal Ni2In-type structure (space group P63/mmc) at low temperature.[Reference Niziol, Zieba, Zach, Baj and Dmowski6–Reference Szytula, Pedziwiatr, Tomkowicz and Bazela8] Both the orthorhombic and hexagonal structures show collinear ferromagnetic (FM) ordering below the Curie temperature T Co = 345 K and T Ch = 283 K, respectively.[Reference Kaprzyk and Niziol7, Reference Lin, Tegus, Brück, Dagula, Gortenmulder and Buschow9] However, the saturation magnetic moment (M S) of MnCoGe in the orthorhombic structure is 3.86 µ B/f.u. (4.13 µ B/f.u.[Reference Lin, Tegus, Brück, Dagula, Gortenmulder and Buschow9]), which is much larger than that of the hexagonal structure with a value 2.76 µ B/f.u.[Reference Kanomata, Ishigaki, Sato, Shinohara, Wagatsuma and Kaneko10] FM MnCoGe with an orthorhombic structure undergoes two separate phase transitions: (a) a second order magnetic phase transition to a paramagnetic (PM) phase at T C ~ 345 K, and (b) a first-order structural transition to a high temperature hexagonal structure of Ni2In-type at the structural transition temperature (T M) ~ 650 K.[Reference Kanomata, Ishigaki, Suzuki, Yoshida, Abe and Kaneko11] Since the two transition temperatures T C and T M occur in well-separated temperature ranges, a first-order MST cannot be obtained in the stoichiometric MnCoGe compound. However, reports have shown that a MST can be achieved in these compounds by decreasing T M and stabilizing it in the Curie temperature window between T Co (345 K) and T Ch (283 K). Some common methods reported to obtain coupled MSTs in these MnCoGe-based compounds are to change the chemical composition,[Reference Fang, Yeh, Chang, Chang, Zhu and Li12] create transitional metal vacancies,[Reference Wang, Wang, Chen, Nashima, Kanomata, Mizuseki and Kawazoe13, Reference Liu, Zhu, Feng, Chen, Wang, Wu, Liu, Meng, Luo and Li14] add interstitial atoms,[Reference Trung, Zhang, Caron, Buschow and Bruck15] dope with elements such as Cr, Fe, Cu, Zn, Zr, Al, and V,[Reference Trung, Biharie, Zhang, Caron, Buschow and Bruck16–Reference Ma, Zheng, Xuan, Shen, Cao, Wang, Zhong and Du22] apply an external pressure,[Reference Caron, Trung and Brück23] and isostructural alloying.[Reference Zhang, Shi, Ye, Nie, Han and Wang24]
Samanta et al.[Reference Samanta, Dubenko, Quetz, Stadler and Ali18] reported that doping Cu for Mn in MnCoGe decreased the T M so that it coincided with T C to produce a MST. In this case, the MST resulted in a giant MCE in wide temperature range with a maximum magnetic entropy change (−ΔS M) of 53.3 J/kg/K for a field change of μ oΔH = 5 T. In contrast, Zhang et al.[Reference Zhang, Li, Liu, Tao, Wu, Wang, Zhou, Xue, Cheng, Yan, Long and Long25] found that doping Cu for Co in MnCoGe reduces not only the T M but also the T Co, thus making it impossible to realize a coupled MST. Interestingly, they found multiple first-order magnetic transitions below T Co in MnCo1−xCuxGe compounds.[Reference Zhang, Li, Liu, Tao, Wu, Wang, Zhou, Xue, Cheng, Yan, Long and Long25] In the current work, we partially substituted Ag, a 4d transition metal with a larger metallic radius and isoelectronic to Cu, for Mn in Mn1−xAgxCoGe (0.01 ⩽ x ⩽ 0.1) and studied its influence on the structural, magnetic, and magnetocaloric properties.
Experimental techniques
Bulk polycrystalline Mn1−xAgxCoGe (0.01⩽ x ⩽ 0.1) samples of nominal compositions were prepared by arc-melting high purity elements (99.99%) under an ultrahigh purity argon atmosphere. The samples were flipped and remelted to ensure homogeneity. The ingots were wrapped in tantalum foil and annealed in high vacuum (~105 Torr) at 1123 K (850 °C) for 48 h and slowly cooled to room temperature. The crystal structures were determined by powder x-ray diffraction (XRD) using Cu Kα radiation at room temperature. The magnetic properties were measured using a superconducting quantum interference device (SQUID by Quantum Design) magnetometer in the temperature interval 5–380 K in applied magnetic fields up to 5 T. The samples were first cooled to 10 from 380 K at zero field. The zero-field-cooling (ZFC) measurements were taken while heating the samples to 380 K in an applied magnetic field, and then followed by field-cooled cooling (FCC) measurement to 10 K. The phase transition temperatures were determined from the minimum of the dM/dT versus T curves in M(T) during the heating cycle. The magnetization isotherms M(H) were measured in the close vicinity of transition temperatures with increasing temperature after the samples were cooled down from 380 to 10 K at zero magnetic field. Differential scanning calorimetry (DSC) measurements were carried out using a DSC 8000 instrument (Perkin-Elmer) in the temperature range 150–543 K to detect the temperature induced first-order structural transitions. A temperature sweep at the rate of 30 K/min during heating and cooling was employed. The latent heat (L) was estimated from the endothermic peaks of the heat flow curves using the equation,  $\; L = \int_{T_{\rm s}}^{T_{\rm f}} {({\rm d}Q/{\rm d}T){\rm d}T} $, where dQ/dT is the thermal variation of heat flow, and T s and T f are the initial and final temperatures of the structural phase transition on heating, respectively. The total entropy changes (ΔS T) were calculated using ΔS T = L/T M, where L is the latent heat in J/kg and T M is the structural transition temperature in K defined by the peak position in the DSC heat flow curves.
Results and discussion
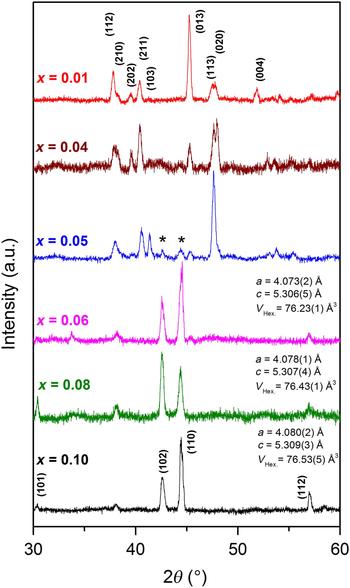
Figure 1 shows the room temperature XRD patterns of Mn1−xAgxCoGe (0.01 ⩽ x ⩽ 0.1). For low Ag content (x ⩽ 0.04), the compounds predominantly crystallize in an orthorhombic TiNiSi-type structure, with a trace of hexagonal Ni2In-type phase for x = 0.05. For higher Ag concentrations (x ⩾ 0.06), the hexagonal Ni2In-type structure was found as the main phase with trace of the orthorhombic phase. The XRD results indicate that with the substitution of Mn by Ag, the high-temperature hexagonal Ni2In-type phase is predominantly stabilized at lower temperature. A shift in the XRD peak positions of the hexagonal phase toward lower 2θ angles was observed for higher Ag content. Such a shift indicates the expansion of the hexagonal unit cell due to the substitution of Mn (R Mn = 1.304 Å) with larger Ag (R Ag = 1.445 Å) atoms.[Reference Pearson26] As expected, the calculated values of the lattice parameters a and c, and the corresponding unit cell volume, were found to increase with increasing Ag concentration as shown in Fig. 1.
Room temperature XRD patterns of Mn1−xAgxCoGe (0.01 ⩽ x ⩽ 0.1). The XRD peaks for x = 0.01 (orthorhombic phase) and x = 0.10 (hexagonal phase) are indexed. The symbol “*” represents a trace of hexagonal Ni2In type phase in x = 0.05.

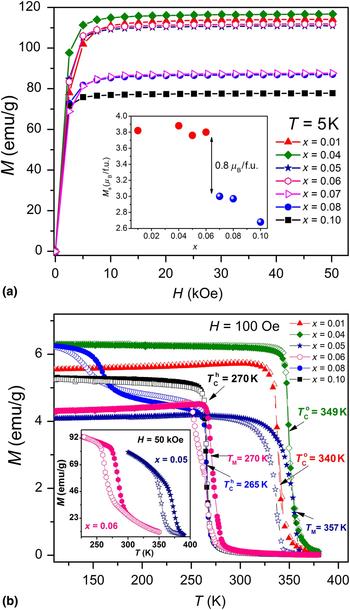
The field dependence of the magnetization M(H) at low temperature T = 5 K is shown in Fig. 2(a). The M(H) curves show that the compounds have a typical FM type of ordering in the ground state. As shown in the inset of Fig. 2(a), a sharp drop in the saturation magnetization (M S) of about 0.8 µ B/f. u. for Ag concentrations x > 0.06 was observed. It is well known that the M S of stoichiometric MnCoGe in orthorhombic structure (3.86 µ B/f.u.) is much larger than in the hexagonal structure (2.76 µ B/f.u.) with ΔM S = 1.1 µ B/f.u.[Reference Kanomata, Ishigaki, Sato, Shinohara, Wagatsuma and Kaneko10] This indicates that compounds with the larger value of M S (x ⩽ 0.06) stabilize in the FM orthorhombic phase, and those with lower value of M S (x > 0.06) stabilize in the FM hexagonal phase in the ground state.
(a) Field dependence of the magnetization M(H) at T = 5 K. Inset: The saturation magnetization (M S) as a function of silver concentration (x) at T = 5 K. (b) The temperature dependence of the magnetization M(T) for Mn1−xAgxCoGe (0.01 ⩽ x ⩽ 0.1) on heating and cooling in applied magnetic fields of 100 Oe and 50 kOe (see inset of (b)). The solid black arrows point to the critical temperatures (T Co, T M, T Ch) specific to the M(T) curves. The line connecting the magnetization data points are guide to the eye.

Figure 2(b) shows the thermomagnetic M(T) curves of Mn1−xAgxCoGe (0.01 ⩽ x ⩽ 0.1) during heating (ZFC) and cooling (FCC) cycles in an applied field H = 100 Oe. The inset of Fig. 2(b) shows the M(T) curves of the samples with x = 0.05 and 0.06 at H = 50 kOe. All of the compounds show FM ordering at low temperatures. At high temperature, a magnetic phase transition from a FM to a PM state was observed at the Curie temperatures T Co and T Ch for x ⩽ 0.04 and x > 0.06, respectively. The T C of orthorhombic and hexagonal phases do not change significantly with Ag concentration (x ⩽ 0.04 and x > 0.06), thus forming a so-called Curie temperature window of width ~90 K. For x = 0.05 and 0.06, a thermal hysteresis characteristic of a first-order structural transition was observed during heating and cooling at H = 100 Oe and 50 kOe. This indicates that, for x = 0.05 and 0.06, T M decreases until it coincides with the highest and lowest temperatures of the window (T Co and T Ch) to produce a first-order MST from a FM orthorhombic phase to a PM hexagonal phase. A jump-like change with temperature hysteresis typical for a temperature induced first-order transition (FOT) was also observed for the sample with x = 0.08 at low magnetic field 100 Oe in the 100–175 K temperature interval. However, considering the lack of DSC peaks in this temperature range (see Fig. 3(d)) such transition cannot be identified as structural one i.e., temperature induced structural transition at zero magnetic field. Therefore, it has a magnetic origin and may be related to a change in the magnetic state of the d-electrons, or some sort of spin-flip phenomena. Hence, by partial substitution of Ag for Mn in MnCoGe, a MST can be achieved and tuned in a wide temperature range, ~360 to 270 K. The values of the characteristic temperatures T Co, T Ch, and T M obtained from the M(T) curves are given in Fig. 2(b).
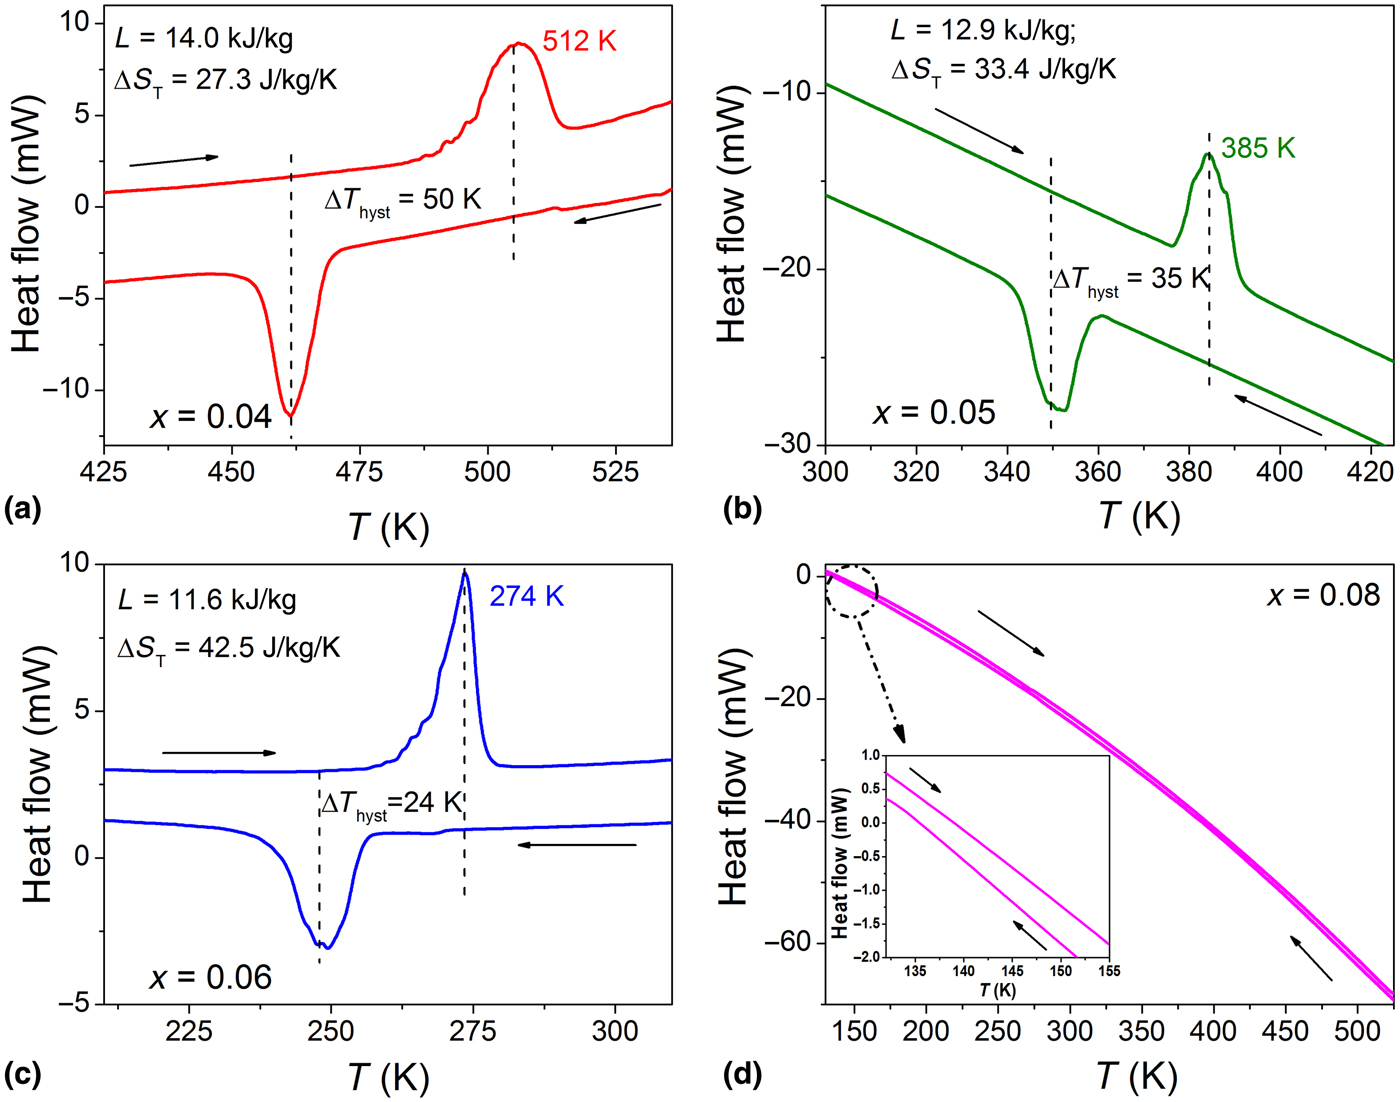
(a)–(d) DSC heat flow curves as a function of temperature. The solid arrows indicate the heating and cooling cycles, respectively. Inset of (d): Enlarged view of the DSC curves in the temperature range 132–155 K for x = 0.08.

The martensitic transition was studied using DSC measurements. As shown in Figs. 3(a)–3(d), large endothermic/exothermic peaks with thermal hysteresis characteristics of first-order martensitic transitions were observed in the heat flow curves in the heating/cooling cycles for x = 0.04, 0.05, 0.06, and 0.08. From the DSC data, T M and thermal hysteresis (ΔT hyst) were found to decrease linearly with Ag concentration in the range 0.04 ⩽ x ⩽ 0.06. Thus, the first-order structural transitions seen in the M(T) curves were verified by the DSC measurements. For x > 0.06, no peaks were observed in the DSC as shown in Fig. 3(d). The values of T M from the DSC measurements agree well with the M(T) measurements. The values of T M, ΔT hyst, latent heat (L), and corresponding total entropy change (ΔS T) associated with the structural transitions are shown in Figs. 3(a)–3(c).
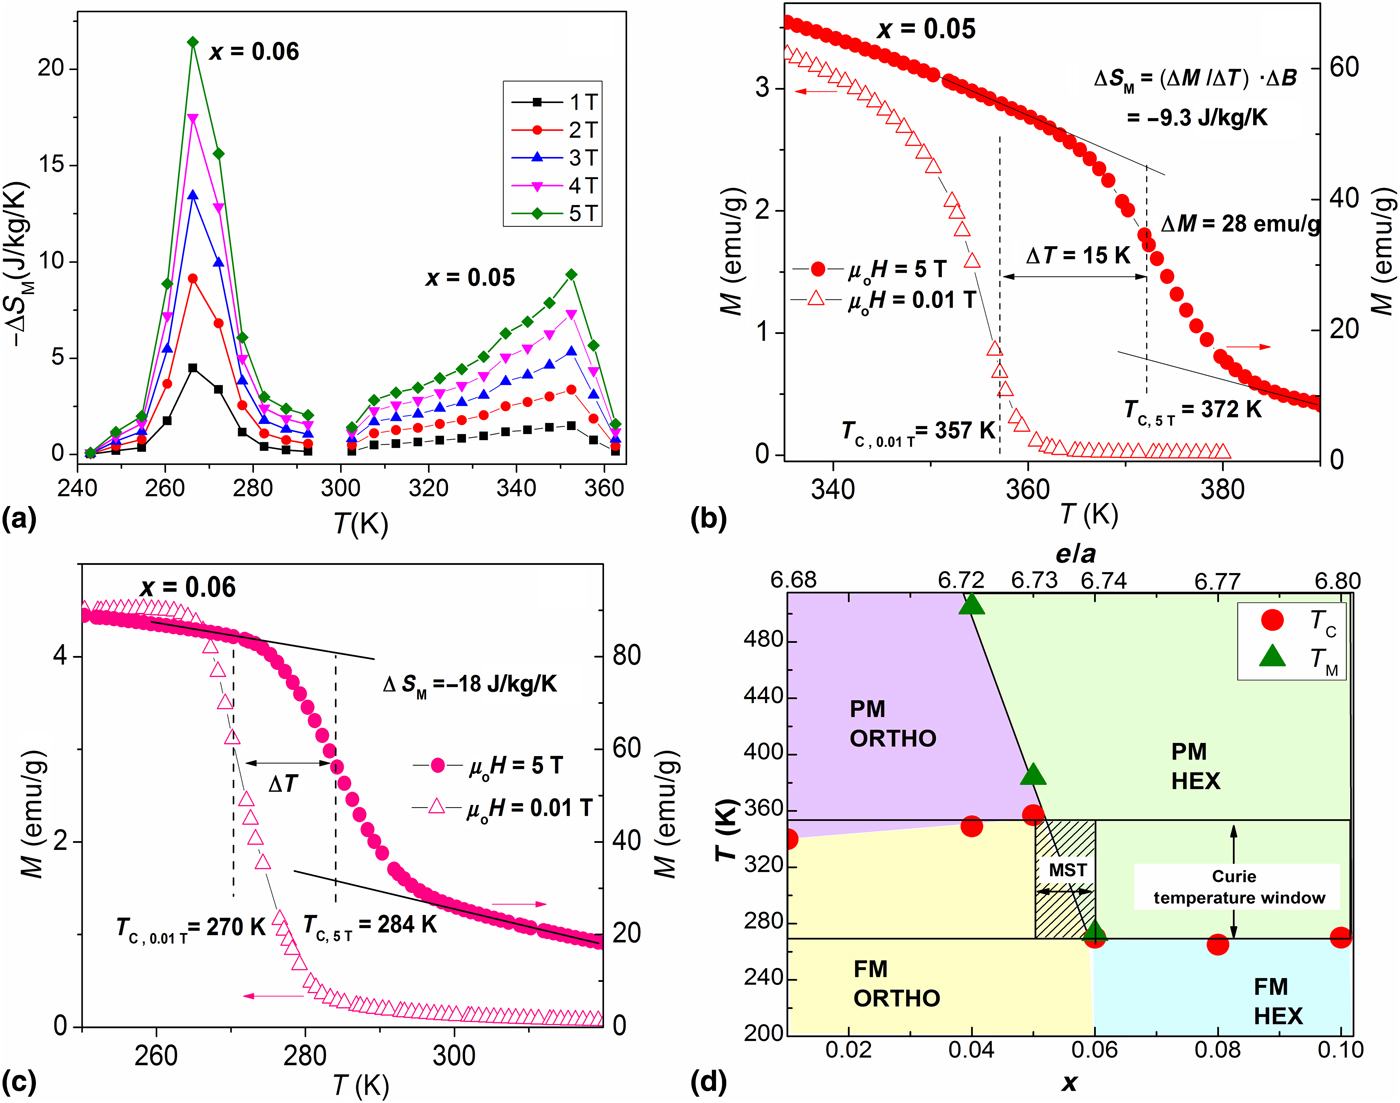
The magnetic entropy changes ΔS M(T) were calculated from the isothermal M(H) curves (see supplementary Figs. S1(a) and S1(b)) using the Maxwell relation,  $\Delta S_{\rm M} = \int_0^H {{(\partial M/\partial T)}_H} {\rm d}H$. The ΔS M(T) near the MST temperatures for field changes up to 5 T are plotted in Fig. 4(a) for x = 0.05 and 0.06. A direct MCE (i.e., a negative ΔS M) was observed in both compounds at the MST. Large −ΔS M values of 22.0 J/kg/K and 9.4 J/kg/K (μ oΔH = 5 T) were found for x = 0.06 and 0.05 at 270 and ~360 K, respectively. Even though the values of −ΔS M are lower than those of Mn1−xCuxCoGe compounds (53.3 J/kg/K for μ oΔH = 5 T) as reported in Ref. Reference Samanta, Dubenko, Quetz, Stadler and Ali18, they are larger or comparable with those of other MnCoGe based compounds and some other well-known MCE materials. Some other compounds include the following: MnCoGeB0.01 (−ΔS M = 14.6 J/kg/K),[Reference Trung, Zhang, Caron, Buschow and Bruck15] Mn1−xCrxCoGe with x = 0.18 (−ΔS M = 15.6 J/kg/K) and x = 0.25 (−ΔS M = 12.3 J/kg/K),[Reference Trung, Biharie, Zhang, Caron, Buschow and Bruck16] MnCo1−xZnxGe with x = 0.06 (−ΔS M = 20.6 J/kg/K) and x = 0.045 (−ΔS M = 26 J/kg/K),[Reference Samanta, Dubenko, Quetz, Stadler and Ali19] MnCo0.98Zr0.02Ge (−ΔS M = 7.2 J/kg/K),[Reference Aryal, Quetz, Pandey, Dubenko, Stadler and Ali20] Mn1−xAlxCoGe for 0 ⩽ x ⩽ 0.02 (−ΔS M = 18 J/kg/K−1),[Reference Aryal, Quetz, Pandey, Samanta, Dubenko, Hill, Mazumdar, Stadler and Ali21] CoMn1−xFexGe for x = 0.085 (−ΔS M = 20.6 J/kg/K), and x = 0.12 (−ΔS M = 20.6 J/kg/K−1),[Reference Yuce, Bruno, Emre and Karaman27] Gd5Si2Ge2 (−ΔS M = 18 J/kg/K),[Reference Pecharsky and Gschneidner28] MnFeP0.45As0.55 (−ΔS M = 18 J/kg/K),[Reference Tegus, Bruck, Buschow and de Boer2] and La(Fe0.88Si0.12)13H1 (−ΔS M = 23 J/kg/K).[Reference Fujita, Fujieda, Hasegawa and Fukamichi29]
(a) Magnetic entropy changes (−ΔS M) for a magnetic field change of μ oΔH = 5 T for x = 0.05 and 0.06. (b), (c) M(T) curves obtained with μ oH = 0.01 T (open symbols) and μ oH = 5 T (closed symbols) used to estimate ΔS M using the Clausius–Clapeyron equation for samples x = 0.05 and 0.06, respectively. (d) Magnetic and structural phase diagram as a function of concentration (x) and e/a ratio for Mn1−xAgxCoGe (0.01 ⩽ x ⩽ 0.1) compounds.

In order to check the reliability of the ΔS M values obtained by applying Maxwell relation at a first-order transition, the Clausius–Clapeyron equation [ΔS M = (ΔM/ΔT)ΔB], was used to calculate the ΔS M values as discussed in Ref. Reference Kainuma, Imano, Ito, Sutou, Morito, Okamoto, Kitakami, Oikawa, Fujita, Kanomata and Ishida5. The values of ΔS M estimated using Clausius–Clapeyron equation for x = 0.06 and 0.05 were found to be 18 and 9.3 J/kg/K, respectively (see Figs. 4(b)–4(c) for the data). Notably, the ΔS M values calculated using two methods are in good agreement.
The usefulness of the studied material as a working material for magnetic refrigeration was estimated by calculating the refrigeration capacity (RC). The RC measures the amount of heat that can be transferred between the hot and cold reservoirs in an ideal refrigeration cycle. The RC was estimated taking the product |(ΔS M)peak| × δT FWHM, where δT FWHM = T hot − T cold is the temperature that define the full-width at half-maximum of ΔS M(T). Large RC values of ~308 and 272 J/kg were found for x = 0.06 and x = 0.05, respectively, for μ oΔH = 5 T, which makes these compounds potential for magnetic refrigeration applications.
Using magnetic and DSC data, a magnetic and structural phase diagram as a function of concentration (x) and valence electron concentration ratio (e/a) has been constructed (Fig. 4(d)). One can see that T M decreases rapidly with increasing the Ag concentration (increasing e/a ratio) while T C of the orthorhombic phase (x < 0.05) and hexagonal (x > 0.06) phase remains almost unchanged, resulting in a Curie temperature window. For x = 0.05 and 0.06, T M coincides with the edge of the temperature window to produce a first order MST. From Fig. 4(d) it is concluded that, when substituting Ag within the concentration range 0.05 ⩽ x ⩽ 0.06, T M falls in the Curie temperature window and produces a first-order MST that can be tuned through a wide temperature range.
Conclusions
In conclusion, the effects of Ag doping on the structural, magnetic, and magnetocaloric properties of MnCoGe compounds were studied. Results show that doping small amounts of Ag for Mn results in: (i) a rapid decrease of T M, which stabilizes the hexagonal Ni2In-type phase at lower temperatures; (ii) a Curie-temperature window of width ~90 K; (iii) a first-order MST with large values of ΔS T (42.5/33.4 J/kg/K), −ΔS M (22/9.4 J/kg/K), and RC (308/272 J/kg) for x = 0.06 and x = 0.05 at μ oΔH = 5 T, respectively. Finally, a concentration dependent magnetic and structural phase diagram has been constructed for the new system of compounds that possess a magnetostructural instability (i.e., a MST). The observed large values of the MCE and RC at the MST, and its tunability in a wide temperature range, illustrate the potential for Mn1−xAgxCoGe compounds as working materials in magnetic cooling technologies.
Supplementary material
The supplementary material for this article can be found at https://doi.org/10.1557/mrc.2018.228.
Acknowledgments
This work was supported by the US Department of Energy (DOE), Office of Science, Basic Energy Sciences (BES) under Award No. DE-FG02-06ER46291 (SIU) and DE-FG02-13ER46946 (LSU).