


Nomenclature
a0 Initial radius
a(t) Radius
a* Dimensionless radius a/a 0
A A factor denned as 
C Heat capacity
g Gravitational acceleration
(Gr 0) Grashof number based on initial conditions βg(Two–Tm) a 0 3/v2
h Heat-transfer coefficient between ice and water
H Ratio of specific to latent heat in ice (C i(T m–T io)/L)
k Thermal conductivity
k 1 A dimensionless factor 0.667Z ½ N equal to the initial dimensionless melting rate
l Hole depth
L Latent heat of fusion
L′ Total of latent heat plus heat necessary to warm ice to T m
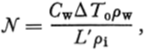
N A factor defined as C wΔT 0ρw/L′ρi
(Nu) Nusselt number ha/k
(Pr) Prandtl number Cμ/k
Q Strength of line source
Q* Dimensionless line source Q/πk w(T w0–T m)
t Time
t 1 End of heating period
t 2 Time when the hole radius reaches a critical value
t* Dimensionless time α w t/a 0 2
T Temperature
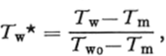
T w* Dimensionless water temperature (T w–T m)/(T w0–T m)
T i* Dimensionless ice temperature (T i–T m)/(T m–T i0)
U Melting velocity
U* Dimensionless melting velocity a 0 U/αw
x Cartesian coordinate
Z Dimensionless parameter (Gr 0)(Pr)a 0/l
Subscripts
o Initial
m Melting
w Water
i Ice
cr Critical
Greek letters
α Thermal diffusivity
β Coefficient of volumetric expansion
δ Thermal boundary layer thickness
v Kinematic viscosity
π Constant
ρ Density
Introduction
The work reported here provides an approximate analysis of the rate of enlargement of a drill hole through an ice shelf, due to the presence of a line heat source (i.e. a heating cable placed inside the hole filled with water) and the subsequent freezing rate upon its removal. The drill hole is 500 m deep and with an initial radius of 0.150 m. Because of the high closure rate of ice, the drill hole is filled with water during the latter part of drilling. Instrumentation and investigation beneath the hole requires the hole dimension to be maintained above a minimum radius of 0.125 m. In order to provide sufficient time to carry out these measurements, a specified heating cable will be placed throughout its entire depth to enlarge the original drill hole to a certain extent. Thus it is necessary to have some information about the extent of melting as a function of heating duration, and the rate of refreezing upon the removal of the heating cable, as well as the total duration before refreezing has reduced the hole dimension to 0.125 m in radius. The main objective of this work is to develop a calculation procedure aimed at providing a reasonable estimate of the change of hole dimension due to melting and refreezing under a variety of conditions without the need for excessive numerical computation.
Analysis
In generalizing the melting–freezing processes associated with the drill hole, the problem can be considered as follows: A hole of depth / and initial radius of a0 is drilled through an ice medium of infinite extent and of initial ice temperature Tio and is filled with water at temperature Two as soon as the drilling is completed. Immediately, a line source of constant strength Q (energy per unit length and time) is introduced along the axis of the hole for o < t ≤ t 1 and is removed for t ≥ t 1. The problem is to obtain the change of the radius as a function of time and to determine the time when the hole radius is reduced to its critical t 2 value a cr = 0.125 m.
The problem investigated here consists of two distinct stages. During the period 0 < t < t 1, the hole size increases as a result of melting of the surrounding ice. For t > t 1, the loss of heat from the melted water to surrounding ice results in refreezing. Accordingly, the problem will be analyzed in terms of a melting followed by a freezing period.
Melting period
A complete description of the heat transfer problem requires consideration of both the ice and water phases, which are two-dimensional (both axial and radial) and unsteady. Furthermore, in the water phase, the inclusion of free convection with the possible effect of maximum density would make a rigorous solution of the problem extremely tedious and difficult, and for the purpose at hand, this would not be justified. Instead the problem will be greatly simplified by the assumption that the heat transfer across the water-ice interface can be described by the use of a heat-transfer coefficient (which can be estimated from other studies). If T w is the average temperature of the water phase, the macroscopic heat balance for any depth in the water is

where a is the hole radius, T m the melting temperature and Q the strength of the line source used to increase the water temperature as well as being transferred into the surrounding ice medium. If Tm and Q are taken as constant throughout the depth, the heat transfer problem in the ice will be reduced to a one-dimensional one, in the radial direction only. Furthermore, if the effect of the curvature of the cylindrical bore hole on heat transfer is neglected, the one-dimensional heat conduction equation in Cartesian coordinates can be used for the present study (it is believed that the use of this assumption will not cause any significant error; on the other hand, considerable saving in computation is obtained with its use).
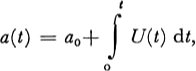
For problems in conduction of heat involving melting or freezing, the melting (or freezing) rate is not constant but decreases with the increasing time, and the time dependence of the rate diminishes as time increases. Under such situations, the use of a pseudo-steady-state assumption becomes reasonable. Namely, the temperature distribution obtained with the condition of constant melting rate (i.e. U = constant) can be used to approximate the actual temperature distribution. With the above considerations the temperature distribution in the ice (Reference Carslaw and JaegerCarslaw and Jaeger, 1959) and the governing equations of the melting period are given as




and initial conditions
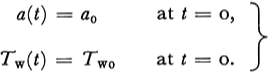
The temperature of the ice and water are given by Equations (2) and (3) respectively if T w(t) and a(t) are known. These latter quantities can be obtained from a simultaneous solution of Equations (1), (3) and (6) with the initial condition of Equation (7). For this solution, the value of the heat-transfer coefficient h between the water and the ice surface is needed.
The pertinent heat transfer problem in the water phase is not unlike that of the free convection of fluid in a cylindrical container with one open end. A theoretical solution of this was given by Reference LighthillLighthill (1953) for the case of constant surface temperature and fluid temperature at its upper surface. Lighthill’s problem is obviously different from the present case. Nevertheless, if the free convection is significant and the water temperature remains more or less uniform and does not vary significantly with time, his results would give a reasonable approximation to the present problem. The average Nusselt number is given as

where

where β, v and α are the volumetric expansion coefficient, kinematic viscosity and thermal diffusivity of water respectively. l is the height of the cylindrical container and in the present problem is equal to the depth of the drill hole. The justification for using Equation (8) is given in the Appendix.
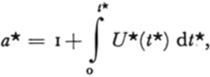
With the introduction of dimensionless variables,




Equations (1), (3) and (6) can be


at

The Nusselt number (Nu) introduced in Equation (8), expressed in terms of the dimensionless variables is

with

where (Gro ) is the Grashof number based on initial conditions.
Combining Equations (17) and (21) yields

where

From Equation (16)

Substituting Equation (25} into (23), one has
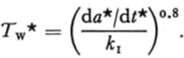
Further differentiation yields

Substituting Equations (21), {26) and (27) into Equation (18) and using the relation given in Equations (23) and (24), a second-order differential equation with a* as the dependent variable is obtained

with

and

Thus the extent of melting can be obtained from the solution of the above initial-value problem. Details of the calculation are given in later sections.
Freezing period
After a certain heating period (i.e. t = t 1 or t* = t 1*) the line source is removed from the drill hole. One is interested in estimating the subsequent freezing rate, and in particular, the duration before the hole size reaches to a critical value (i.e. t = t 2 when a = a er = 0.125 m), Strictly speaking, freezing would not commence immediately upon the removal of the heating source. In fact, since the water temperature at the end of the heating period (i.e. T w(t 1)) will be above T m, one would expect heat transfer from water to surrounding ice to continue until the water temperature dropped to T m. However since T w is only slightly above T m, as shown in later calculations, this period is expected to be of short duration. For practical purposes, one may assume an instantaneous drop of T w to that of T m upon the removal of the heating source. The temperature profile at this point is schematically shown in Figure 1.

Due to the existence of the temperature gradient, heat is conducted away radially, which, in turn, necessitates the freezing of water. To estimate the rate of freezing, the heat-balance integral method of Reference GoodmanGoodman (1958) is used. The basic premise of Goodman’s method is based on the physical fact that the significant part of the temperature profile ties only within a restricted neighborhood near the boundary. This region, in the case of one-dimensional conduction, is called the thermal layer whose thickness δ is, in general, much less than the overall dimension of the medium under consideration. The integral method is used to attempt to obtain an approximate solution by satisfying the conduction equation over this thermal layer on an average basis.
In the present case, the thermal layer refers to the region extending outward from the ice-water interface. This thickness is denoted by 8, then for x > a+δ, the temperature remains undisturbed, i.e. T i = T i0.
The one-dimensional conduction equation for the ice is given as

Integrating Equation (31) from x = a to x = a+δ yields
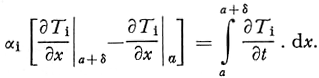
Assume the dimemionless temperature profile in ice can be represented by

It can be seen that the temperature of the ice-water interface is at the melting temperature (T i* = o) and the temperature becomes T i* = –1 at x = a+δ, namely, the temperature outside the thermal layer remains undisturbed. Furthermore ∂T i*/∂x = o at x = a+δ, indicating no heat flow beyond the thermal boundary layer.
In terms of the dimensionless temperature, Equation (32) becomes
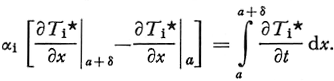
The right-hand side can be evaluated as follows

Since T i* = –1 at x = a+δ and T i* = o, at x = a, Equation (35) reduces to
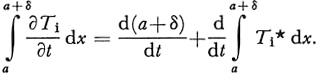
The integral on the right-hand side of the above expression can be evaluated with the use of Equation (32)
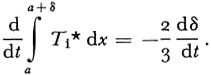
Thus

The temperature gradient at x = a is

Substituting Equations (36) and (37)

At the ice-water interface, x = a, one has

or

Combining Equations (38) and (39), one has

Integrating Equation (40) with the initial condition, t = t 1, δ = δ 0, one has
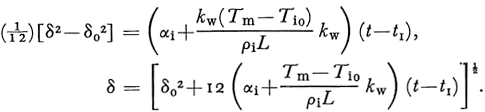
The change of the dimension of the drill hole due to freezing can be obtained by combining Equations (39) and (41) as

and by simple integration, one has

where am is the hole radius at the end of the heating period. In terms of dimensionless varables Equation (4a) becomes

where

and

Thus one can predict the change of the drill-hole radius after the removal of the heating source provided the value of δ0 is given.
To evaluate δ0, the temperature profile in the ice at t = t 1 obtained from Equation (2) has to be matched with that of Equation (33). In other words, one attempts to obtain equivalence between the following two expressions

and

It is obvious that these two expressions cannot be made to be equivalent. In an approximate manner, one may require the temperature gradient at the water-ice interface by these two expressions to be the same since it is the ability of ice to conduct heat which determines the rate of freezing,

In terms of dimensionless variables, one has
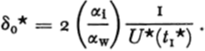
Accordingly one can calculate the change of drill-hole radius from Equations (43) or (47) based on the final conditions of the melting period.
Calculation
As shown in the previous section, for the melting period, the change of drill-hole size is obtained from the solution of Equation (28) with the initial conditions given by Equations (29) and (30).
Numerical solutions of Equation (28) were obtained using the Runge–Kutta method, The following conditions and property values were used:
Depth of drill hole l = 500 m
Initial drill hole radius a 0 = 0.15 m
Melting temperature T m = −2°C
Initial ice temperature T i0 = −20°C
Initial water temperature T w0 = −1°C
Strength of line source Q = 185 W/m
L = 80 kcal/kg
C w = 4.185 kJ/kg deg
C i = 2.092 kJ/kg deg
ρ w = 1000 kg/m3
ρ i = 900 kg/m3
K w = 0.05533 kJ/m deg s
k i = 0.2218 kJ/m deg s
ΔT 0 = T wo − T m = 3 deg
L′; = L+C i(T m–T i0) = 372 kJ/kg


The results are shown in Figure 2 in which the dimensionless hole size a* is plotted against t*. The freezing curves at the end of each heating period t 1* are calculated in the following manner: At the end of any particular heating period, a pair of values am*, and U* are computed. The value of U* is used to estimate the δ0* from Equation (47), and with the given value of a m*, Equation (43) is used to compute a* with the given values of H = C i(T m– T io)/ L = 0.1125 and α1/αw = 8.9. The change of a* versus t* for the freezing period is also shown in Figure 2 on dotted lines each of which correspond to a particular value of t 1*. Figure 3 shows the total time available for experimentation or the length of time when the drill hole reaches the critical radius = 0.125 m (i.e. the value of t* for which a* = 0.125/0.150 = acr 0.833) as a function of heating duration. It gives a straight-line relationship on a double logarithmic plot.

With everything being identical to the case given above but with ao = 0.30 m, and aer = 0.25 m, the melting and freezing curves are shown in Figure 4. The time available for experimentation is also shown in Figure 3. It can be seen that the single line can represent both cases as long as the proper proportional factor is used to convert the dimensionless time to real time.


Conclusions
From the approximate solution it can be concluded that for a specific line heat source, for a dimensionless heating period of t1* – 0.5 for example (or 0.985 d and 3.90 d of heating for a0 = 0,15 m and 0.30 m respectively), the time available for conducting experiments under the drill hole is 12.8 and 50.7 d for a0 = 0.15 m and 0.30 m respectively. Since the curve is linear on a double logarithmic plot, it can be extrapolated confidently for lower values of t 1*. If the duration is longer than needed to accomplish the intended scientific investigations, we need only reduce the heating period or the line strength.
MS. received 20 November 1974 and in revised form 31 January 1975
Appendix
JUSTIFICATION OF USING EQUATION (12) FOR THE CALCULATION OF HEAT TRANSFER COEFFICIENT A
Lighthill (1953) gave a very thorough analysis on the fine convection within a heated vertical tube. He concluded that the flow regimes and subsequently the heat transfer can be classified into three categories and arc determined solely by the magnitude of the parameter A, which is defined as

Specifically the three regimes of flow field found are:
-
(a) A < 1 000: the flow is similar with 3 stagnant portion at the bottom.
-
(b) 1 000 < A < 10 000: the flow is of boundary-layer type but not filling the tube.
-
(c) A > 10000: the limiting case becomes identical to the case of a vertical plate.
The heat transfer result is shown in Figure 5. The Nussclt-number expression of (a) and (c) is also shown in the Figure. The results of (b) arc tabulated and no expression is available. A visual observation indicates that an extrapolation of the Nusselt number expression of (c) gives essentially the same values as the tabulated results cf (b). Furthermore for the condition considered in this calculation, the corresponding value of the parameter A is always greater than 1 000. For this reason the Nusselt number expression of (c) (i.e. Equation (8)) is used in the calculation.



