1 Introduction
Citizens’ beliefs about uncertain events are fundamental variables in many areas of political science, including work on attitudes (e.g., Zaller and Feldman 1992), cognitive biases (e.g., Gerber and Green Reference Gerber and Green1999; Bartels Reference Bartels2002; Bullock Reference Bullock2009), ambivalence (e.g., Alvarez and Brehm Reference Alvarez and Brehm1997), misinformation (e.g., Berinsky Reference Berinsky2017), or citizen forecasts (e.g., Murr Reference Murr2011; Leiter et al. Reference Leiter, Murr, Ramirez and Stegmaier2018), to name just a few. While beliefs are often theoretically conceptualized in the form of distributions, obtaining reliable measures of these beliefs in terms of full probability densities is a difficult task (Savage Reference Savage1971; Garthwaite, Kadane, and O’Hagan Reference Garthwaite, Kadane and O’Hagan2005; Goldstein and Rothschild Reference Goldstein and Rothschild2014). Most survey questions are focused on the first moment of an underlying distribution and thus miss important information about beliefs’ variance or uncertainty.
The question we ask in this letter is whether there is an effective way to elicit average citizens’ belief distributions in the context of online surveys? This paper discusses five different elicitation methods designed to capture citizens’ uncertain expectations. We present experimental evidence and evaluate which question format is best suited to elicit continuous beliefs as distributions from regular (i.e., nonexpert) survey respondents. That is, we are interested in how well these methods capture subjective distributions when compared to a benchmark and which of these methods performs best.
Our results suggest that an elicitation method originally proposed by Manski (Reference Manski2009) performs well. It contains five sequential survey questions that reliably measure average citizens’ subjective belief distributions and that are easily implemented in the context of regular online surveys. They are also easy and quick to answer and, hence, not too cost-intensive in online surveys. We expect that a wider use of this method will lead to considerable improvements in the study of citizens’ expectations and beliefs and, therefore, to important political science theories. In addition, it should also prove a useful tool to Bayesians who wish to elicit subjective prior distributions from nonexperts (Gill and Walker Reference Gill and Walker2005).
To illustrate the use of the method in an applied example, we elicit people’s expectations about the 2020 U.S. presidential election. Eliciting citizens’ beliefs is a common element in citizen forecasts (Murr Reference Murr2011), for which it would be valuable to distinguish between citizens who are more certain (i.e., who have narrow belief distributions) from those who are less certain about the election outcome (i.e., who have wide belief distributions) and weight them accordingly. Hence, we ask respondents to provide their full belief distribution concerning Donald Trump’s likely vote share in the November 2020 election. In Section 5, we describe how the elicitation methods discussed in this letter can be applied to this practical task. Based on the Manski question format, we find that respondents expect a popular vote share of 48% for Donald Trump with a standard deviation of 5.5%. We further find considerable differences in both expectations and uncertainties between Democrats (44%, sd 4.6%) and Republicans (52%, sd 8.1%).
The remainder of this letter proceeds as follows. The next section discusses the elicitation process. Section 3 then presents the experimental setup and the five elicitation approaches we evaluate. Section 4 presents the results. Section 5 provides a brief illustration using Trump’s vote share in the November 2020 election as an example. Section 6 concludes.
2 Eliciting Beliefs as Distributions
The elicitation of beliefs as distributions has a long tradition in statistics, psychology, and economics. In political science, Bayesians seek to elicit prior distributions from experts to inform their statistical models (Gill and Walker Reference Gill and Walker2005; Gill and Freeman Reference Gill and Freeman2013). However, the process of eliciting probability distributions described in this literature usually is a time-consuming enterprise that requires careful effort even when it is used to learn about the beliefs of experts who may already be familiar with probabilities.
What makes the elicitation of beliefs so difficult is that average people are not used to expressing themselves in easily quantifiable ways. Many citizens are unlikely to be familiar with the concept of probability and not used to expressing their expectations in terms of distributions. Lengthy elicitation protocols also do not scale well to the number of respondents required for testing political science theories about citizens’ expectations and are unlikely to be part of nationally representative surveys. Thus, the central challenge is how to best translate what people think into probability distributions within the confines of standard survey methodology.
Formally, an elicitation process can involve up to four steps (Garthwaite et al. Reference Garthwaite, Kadane and O’Hagan2005). In the setup step, the problem is defined and respondents are recruited and trained in the key concepts and procedures. Elicitation is the key step where the respondent is asked to provide information about his or her subjective belief. In the fitting step, this elicited information is converted into a probability distribution. The final step assesses the adequacy of the elicited distribution and provides an opportunity for correction. The challenge we address in this letter is how to implement these steps in the context of regular online surveys, where time and scale concerns as well as limited researcher–respondent interaction render the use of full elicitation protocols impractical.
Traditional elicitation methods come in three basic forms (Spetzler and Stael von Holstein Reference Spetzler and Stael von Holstein1975). In each of these three forms, subjects are asked questions and the answers represent points on a cumulative distribution function. In so-called P-methods, subjects are provided with fixed values referring to the quantity of interest and asked to assign probabilities attached to these values (e.g., what is the probability that the value is below x?). In V-methods, subjects are instead provided with predefined probabilities and asked to assign values to them (e.g., at what value are half of the observations below or above that value?). PV-methods are more difficult and simultaneously integrate both approaches. For instance, respondents may be asked to draw a graph of a probability distribution. In this letter, we evaluate several ways to implement these methods with online survey questions.
Given humans’ difficulties with probabilities, eliciting beliefs as distributions is as much a psychological problem as it is a statistical one. Many cognitive human biases are well known: representativeness, availability, anchoring biases, the law of small numbers as well as hindsight biases (Tversky and Kahneman Reference Tversky and Kahneman1971, Reference Tversky and Kahneman1973, Reference Tversky and Kahneman1974; Kynn Reference Kynn2008). But it is important to distinguish those biases in beliefs from biases introduced by elicitation methods. Psychological research suggests that while people are generally capable of estimating proportions, modes, and medians, they are less proficient at assessing the means of highly skewed distributions (Peterson and Miller Reference Peterson and Miller1964) and often have serious misconceptions about variances (Garthwaite et al. Reference Garthwaite, Kadane and O’Hagan2005). People are reasonably good at quantifying their opinions as credible intervals but have the tendency to imply a greater degree of confidence than is justifiable (Wallsten and Budescu Reference Wallsten and Budescu1983; Cosmides and Tooby Reference Cosmides and Tooby1996).
3 Experimental Set-Up
In the following, we evaluate a set of elicitation question formats. For a proper evaluation of elicitation methods, we need an objective benchmark against which to judge the derived beliefs. To this end, we run a number of experiments where we instill objective distributions and assess which format yields beliefs that are most consistent with these objective benchmark distributions.
Instead of working with arbitrary numbers, we rely on an example of citizens’ beliefs about hypothetical election results. Note that this experimental evaluation is different from an actual elicitation process where we would not instill a prior but rather try to elicit a pre-existing belief. To illustrate the actual usage of the method to a political science audience, we provide an example of an actual elicitation process further below. In the following presentation of our experiments, we proceed along the four steps of the elicitation process described in the previous section: setup, elicitation, fitting, and adequacy check.Footnote 1
3.1 The Setup Step
We ran experiments with a total of about 3,600 participants. We relied on Amazon Mechanical Turk (MTurk), which is widely used for scientific purposes (Berinsky, Huber, and Lenz Reference Berinsky, Huber and Lenz2012; Mason and Suri Reference Mason and Suri2012; Thomas and Clifford Reference Thomas and Clifford2017). We recruited workers advertising a study on surveys, opinion polls, and charts. MTurk allowed us to carry out the experiments in a short time period and at a low cost. While MTurk samples may be special, they are comparable to other online samples. Mullinix et al. (Reference Mullinix, Leeper, Druckman and Freese2015) analyze treatment effects obtained from 20 experiments implemented on a population-based sample and MTurk. The results reveal considerable similarity between effects obtained from convenience and nationally representative population-based samples. Coppock (Reference Coppock2018) replicates 15 survey experiments and compares the estimates based on random samples to estimates based on an MTurk sample. In general, the two sets of estimates overlap. These findings may not be surprising because just like MTurk, many online survey panels actually consist of semi-professional survey takers who are experienced in completing online tasks and are perhaps younger and more educated (see, e.g., Berinsky et al. Reference Berinsky, Huber and Lenz2012, p. 358), in addition to being paid for their participation. Since we are specifically interested in eliciting beliefs in the context of online surveys, these particular respondent characteristics do not concern us much.
We presented respondents with 100 results from hypothetical local elections that we randomly drew from a prespecified distribution. By exposing respondents to these draws, we manipulated the objective belief distributionFootnote 2
along two factors: symmetric versus asymmetric and small versus large variance. We rely on a beta distribution in all four conditions but vary the shape parameters of the distribution. The symmetric small-variance distribution is
 $\mathcal {B}$
(60,60) and the respective asymmetric distribution is
 $\mathcal {B}$
(60,30). For the large-variance condition, we rely on
 $\mathcal {B}$
(30,30) for the symmetric and on
 $\mathcal {B}$
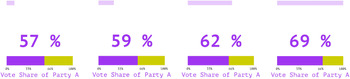
(30,15) for the asymmetric distribution. The hypothetical results of 100 election simulations are presented as a short GIF where each frame shows one election outcome and is displayed for about half a second. Four random draws are illustrated in Figure 1. This approach follows Goldstein and Rothschild (Reference Goldstein and Rothschild2014), who also rely on this form of visualization to present the distribution. The goal is to treat these distributions as the objective truth and to identify which question format elicits beliefs that are closest to the true distribution.
Four still frames from the GIF. Each still frame is shown for about half a second. The black bar at the top is a progress bar.

Each respondent is then also randomly assigned to an elicitation question format in a simple between-subjects design (one question format per respondent). There is balance across question types with respect to a number of socio-economic variables (see Section A3 in the online appendix). We also employ two questions that serve as attention checks, and each question is correctly answered by about 75% of the respondents. Here, we show results for all respondents that answered both questions correctly, which is about 60% of the original sample. The same tables based on all respondents are shown in the online appendix (see Section A5 in the online appendix). There is no substantive difference between the two.
3.2 The Elicitation Step: Comparing Five Question Formats
The literature proposes different question formats to elicit univariate distributions (e.g., O’Hagan et al. Reference O’Hagan2006, Chapter 5.2). Here, we compare five common question formats that elicit different elements of a distribution and pose varying levels of cognitive demand. Two main selection criteria guided our choice of formats: (a) general question type and (b) ease of implementation in the context of online surveys. Based on a review of the relevant literature, we found that different question formats refer to different aspects of the belief distribution. Some present fixed intervals and ask for probabilities, others directly elicit quantile values or rely on a mix of both (see the distinction of P-methods and V-methods mentioned above). While most elicitation methods are purely verbal, others make use of visualization. Thus, our goal was to include one method of each general type.
Equally important is the second goal: to evaluate only such methods that are easily implemented in online surveys because they follow a simple question format. In addition, we also take advantage of the fact that online surveys provide us with the ability to use simple visual tools. But we will not consider elicitation protocols that demand close researcher–respondent interaction (e.g., Morris, Oakley, and Crowe Reference Morris, Oakley and Crowe2014) or rely on incentivized elicitation methods that are often used in economic laboratory experiments (for an overview, see, e.g., Schlag, Tremewan, and Van der Weele Reference Schlag, Tremewan and Van der Weele2015).
Here, we only briefly discuss each format. We present precise question wording in the online appendix (Section A1).
Interval Question (Wide and Narrow). These questions ask about the probabilities of fixed intervals (with the two versions varying the width of the interval values). More specifically, respondents are first asked to indicate the most likely value and then to provide us with the probability that a vote outcome will be lower than 40% (45% in the narrow format) and the probability that it will be higher than 60% (55% in the narrow format).
Quantile Question. The second question format asks respondents to provide three quantile values: the median, the first quartile, and the third quartile. This question format also provides an adequacy check. It ends by showing people their three responses (
 $P_{25}$
,
 $P_{50}$
,
 $P_{75}$
) and asking them whether they think that a random draw is equally likely to fall into any of these intervals:
 $0 -P_{25}$
,
 $P_{25}-P_{50}$
,
 $P_{50}-P_{75}$
,
 $P_{75}- 1$
. Respondents can then correct themselves if they wish to do so. Thus, the fourth elicitation step is possible and respondents can assess the adequacy of their responses.
Manski Question. The third hybrid question format relies on work by Manski (Reference Manski2009) and asks for both, values and probabilities. Specifically, it first asks for three values along the distribution (the most likely value as well as the expected lower and upper bounds) and then asks respondents to provide probabilities for their elicited lower and upper bounds.
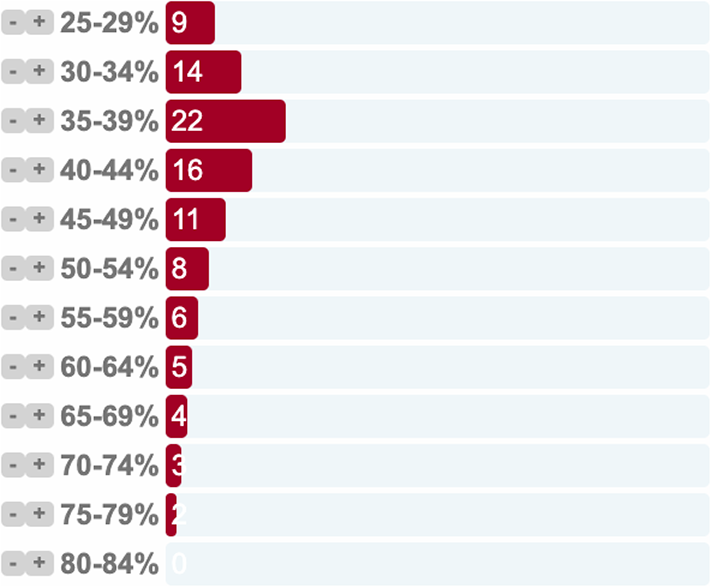
Bins and Balls. The last question is the latest addition to elicitation methods and takes advantage of the fact that a large number of surveys are being carried out online and, hence, allow for completely new question formats. Bins and Balls follows a proposal by Goldstein and Rothschild (Reference Goldstein and Rothschild2014) and is a visual tool for specifying a distribution where respondents have to place 100 balls into bins of a specific range (see Figure 2; see also Delavande and Rohwedder Reference Delavande and Rohwedder2008). Balls are placed in a bin by the respondent’s clicking on the
 $+$
and
 $-$
symbols. Since respondents are able to directly see the implied distribution, this is akin to an implicit adequacy check.
Screenshot of a Balls and Bins question. Illustration after hypothetical respondent has allocated all 100 balls.

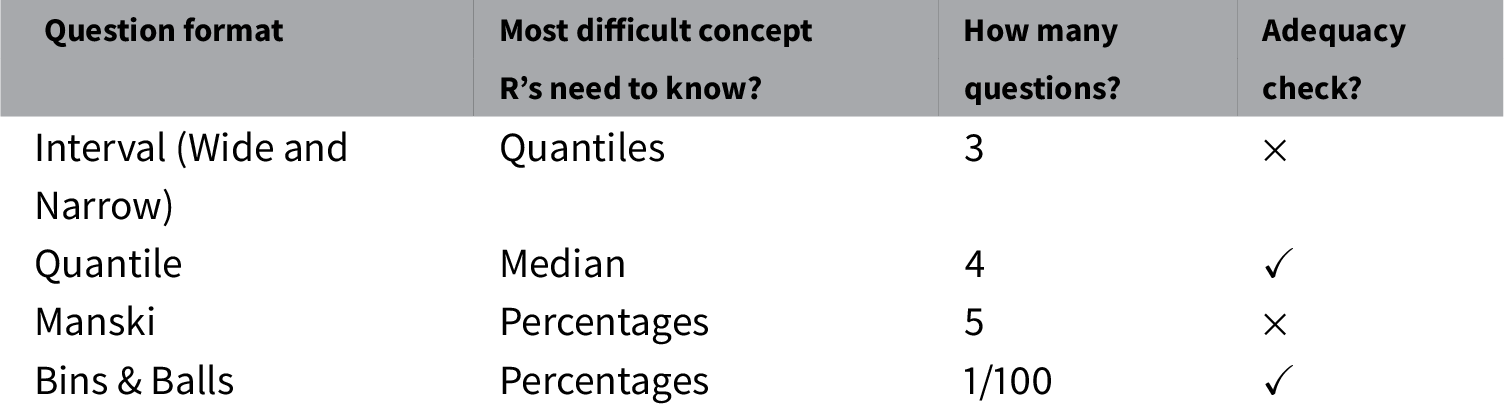
All five question formats differ in their complexity for respondents but also in how easily they can be implemented. Some of these questions lend themselves to adding an adequacy check at the end, others do not. Table 1 allows us to compare the different formats. The number of questions is ill-defined for the Bins and Balls format as it is one question but requires respondents to provide 100 inputs to distribute the virtual balls.
Question formats.

The Interval question and the Quantile question are particularly demanding as they require an understanding of quantiles. The Manski method is similar but can be expected to be less demanding since it translates the task into easier terms (means, maximums, and minimums) well. Finally, the Bins and Balls Question requires the least of respondents but its implementation is the most demanding for researchers. The question formats further differ on whether they allow for an adequacy check. In the Quantile question, for example, respondents can incorrectly place the upper quartile below the median. This can signal a wrong understanding of the question. In the next section, we investigate the accuracy of the elicited beliefs and discuss the experimental results.
3.3 The Fitting Step
To estimate a respondent’s belief, we assume a flexible parametric distribution for his or her beliefs and estimate the parameters of the distribution such that it closely mimics the observed indicators for the different question formats. Because the sampling space of our experiment is bound between 0 and 1, we employ a beta distribution as our parametric assumption. The beta distribution has two shape parameters:
 $\alpha $
and
 $\beta $
. We provide the derivation of the Interval question format as an example here. We present the derived likelihood functions for the other formats in the online appendix (see Section A2).
We observe three values for the Interval question. Respondents report the mean value of their beliefs and the probabilities of observing a value below and above a certain threshold. We denote the mean with
 ${y}_i$
and the two (
 $k \in (1,2))$
probabilities with
 $p_{i1}$
and
 $p_{i2}$
. The interval values depend on the question format and are denoted with
 $c = [c_1, c_2]$
, where in the wide version
 $c = [40\%, 60\%]$
and in the narrow version
 $c = [45\%, 55\%]$
. We assume that the values are measured with normal measurement error:Footnote 3
 $$ \begin{align} {y}_i & \sim \mathcal{N}(\mu_{y}, \sigma_y^2) \end{align} $$
 $$ \begin{align} {p}_{i1} & \sim \mathcal{N}(\mu_{p_1}, \sigma_p^2) \end{align} $$
 $$ \begin{align} {p}_{i2} & \sim \mathcal{N}(\mu_{p_2}, \sigma_p^2). \end{align} $$
The expectations
 $\mu _{y}$
are calculated from the assumed parametric belief distribution. Here, we use the same distribution as in the data-generating process—a beta distribution. The beta distribution is relatively flexible and well-suited for our example with vote shares constrained on the unit interval. The expectation for the mean from the beta is given by the two shape parameters
 $\alpha $
and
 $\beta $
:
 $$ \begin{align} \mu_{y} = \frac{\alpha}{\alpha + \beta}. \end{align} $$
The expected probabilities are given by the cumulative density function of the beta distribution, which we denote with
 $Q(\cdot , \alpha , \beta )$
.
 $$ \begin{align} \mu_{p_1} &= Q(c_1 , \alpha, \beta) \end{align} $$
 $$ \begin{align} \mu_{p_2} &= 1- Q(c_2 , \alpha, \beta). \end{align} $$
With this model, we can define the likelihood for the observed data. As we assume that all responses are identically and independently normal distributed, the likelihood is the product of three normal distributed measurements
 ${y}_i, {p}_{i1}$
, and
 ${p}_{i2}$
for each of the respondents.Footnote 4
To obtain maximum likelihood estimates of the parameters
 $\alpha , \beta , \sigma _p, \sigma _y$
, the log-likelihood function is maximized using R’s optim function. The estimates yield an estimate of the average beliefs for a specific condition. In the experiments, we can then identify the question format that will yield average belief estimates closest to the true values.
3.4 The Adequacy Check Step
Assessing the adequacy of the elicited distribution by giving respondents the chance to review and correct their belief distributions is difficult, because the fitting is done “outside” of the survey software and only after the answers have been collected. But for some formats, it is still possible to provide the opportunity for correction using question filters based either on respondents’ answers or on visual question formats. The Quantile question, for instance, presents respondents with the quartiles they provided and asks if election results are equally likely to fall within each of them.Footnote 5 The Bins and Balls format asks respondents to “draw” their distribution and thus provides immediate feedback.
4 Results
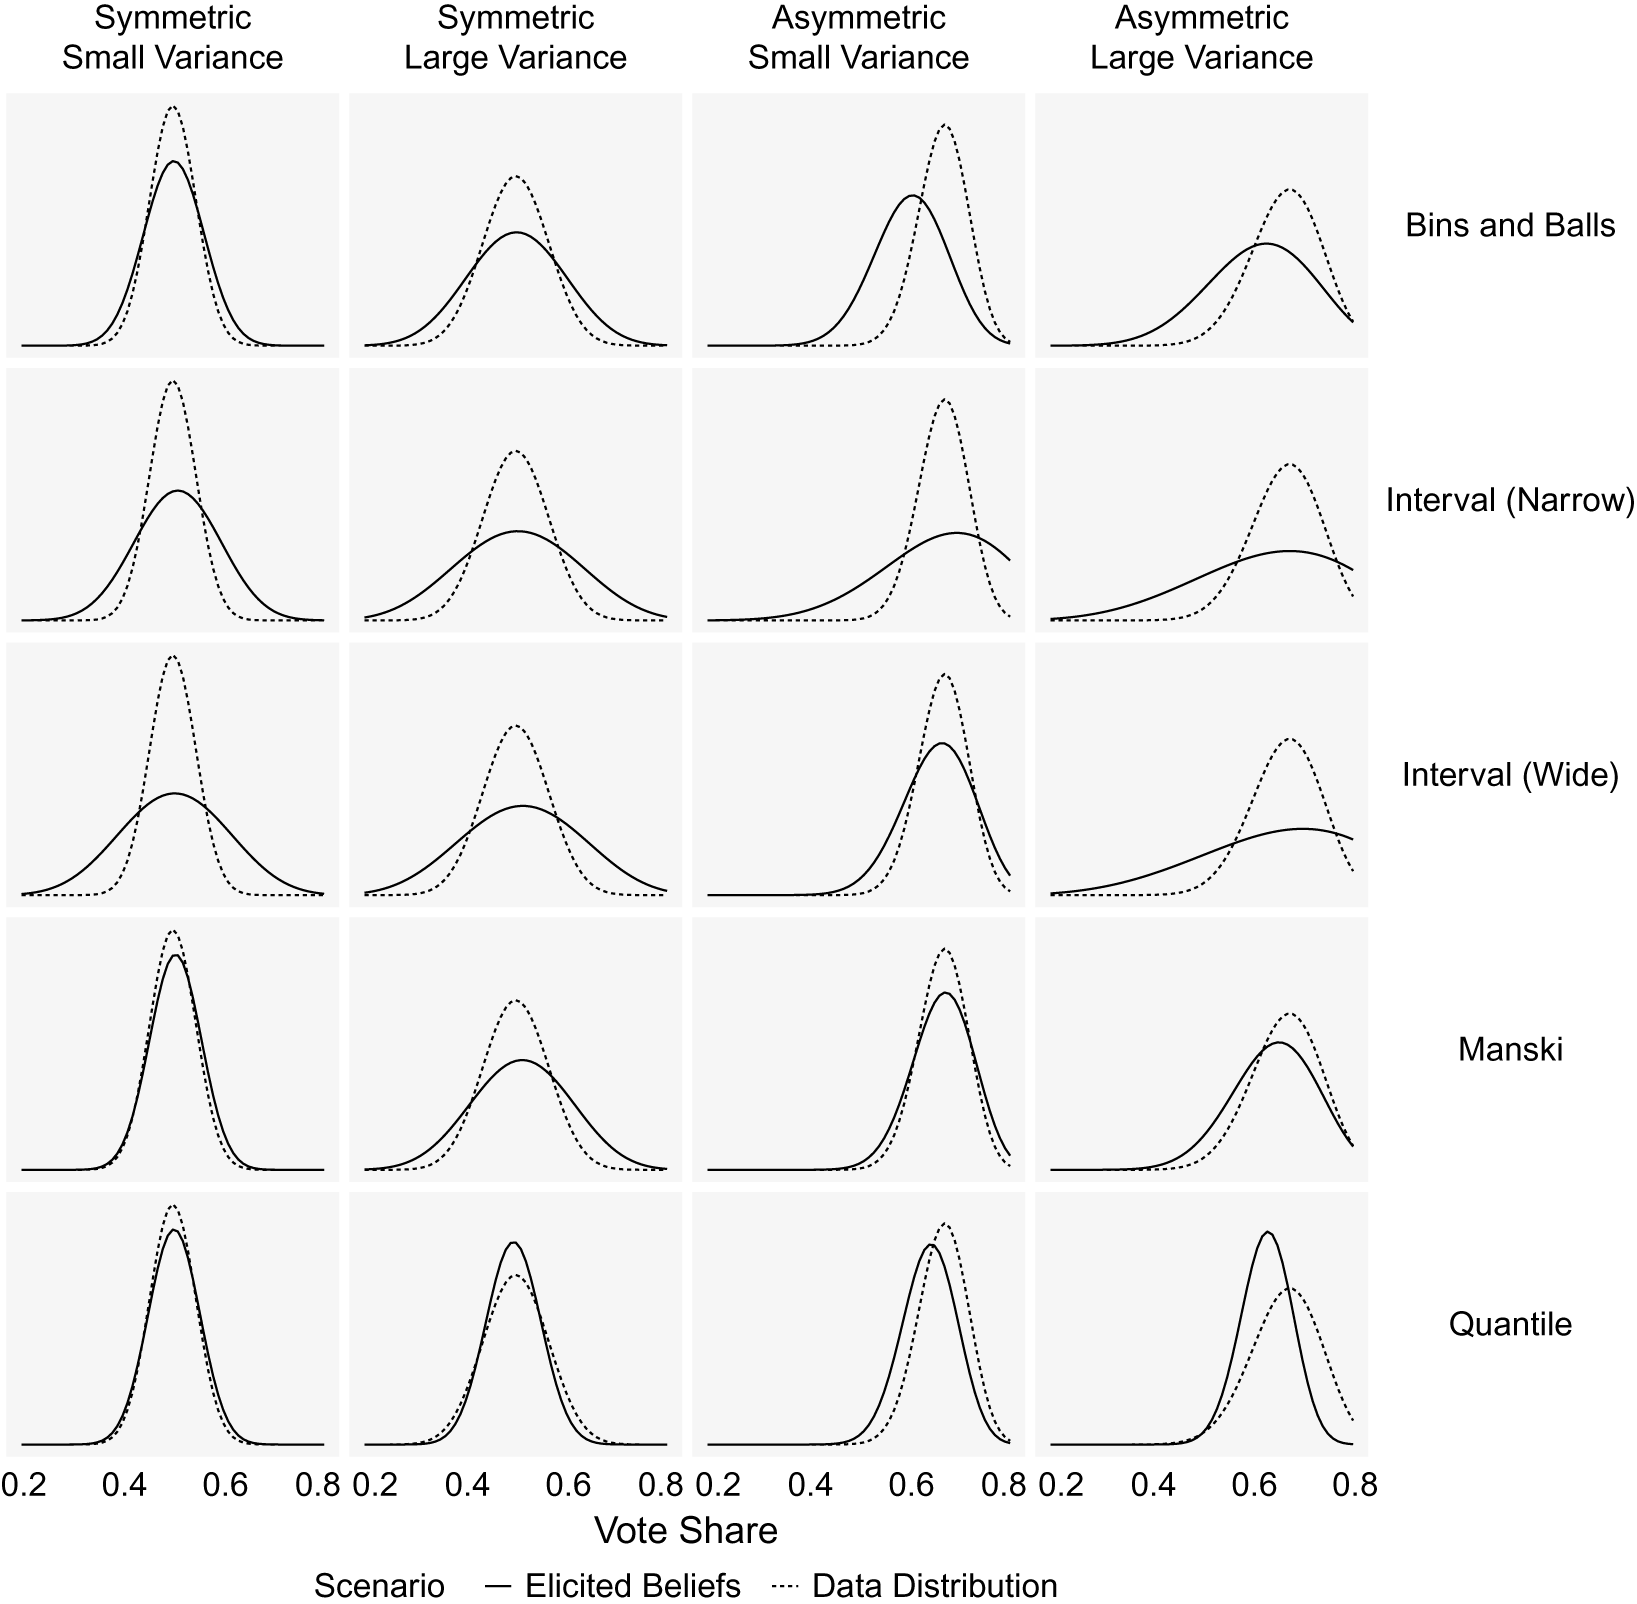
To evaluate the different elicitation methods, we now compare the elicited beliefs to the benchmark of true objective distributions. Each column in Figure 3 stands for a combination of conditions (small/large variance and symmetric/asymmetric distribution). While we look at both symmetric and asymmetric true distributions, the asymmetric scenarios are likely to be more relevant in practice. This is because the only symmetric beta distributions are those distributions where the two shape parameters are exactly equal to each other. The five rows contain the different elicitation methods. We focus on the average elicited belief across all respondents and present the same figure with each individual belief distribution in the online appendix (see Figure A3).Footnote 6
Comparison of question formats. The dotted line indicates the true distribution and the black solid line shows the average of the elicited distributions.

We find that most question formats are unbiased when the true distribution is symmetric, that is, they are able to provide the correct first moment. With asymmetric distributions, there is some bias towards
 $.5$
but its extent varies across question formats. It is especially evident for the Bins and Balls format. Looking at the second moment, we find that the two Interval questions tend to provide beliefs that are too wide in both, the symmetric and asymmetric scenarios. Thus, after simply eyeballing the plots, it seems that overall the Manski question and the Quantile question come closest to the true distributions.
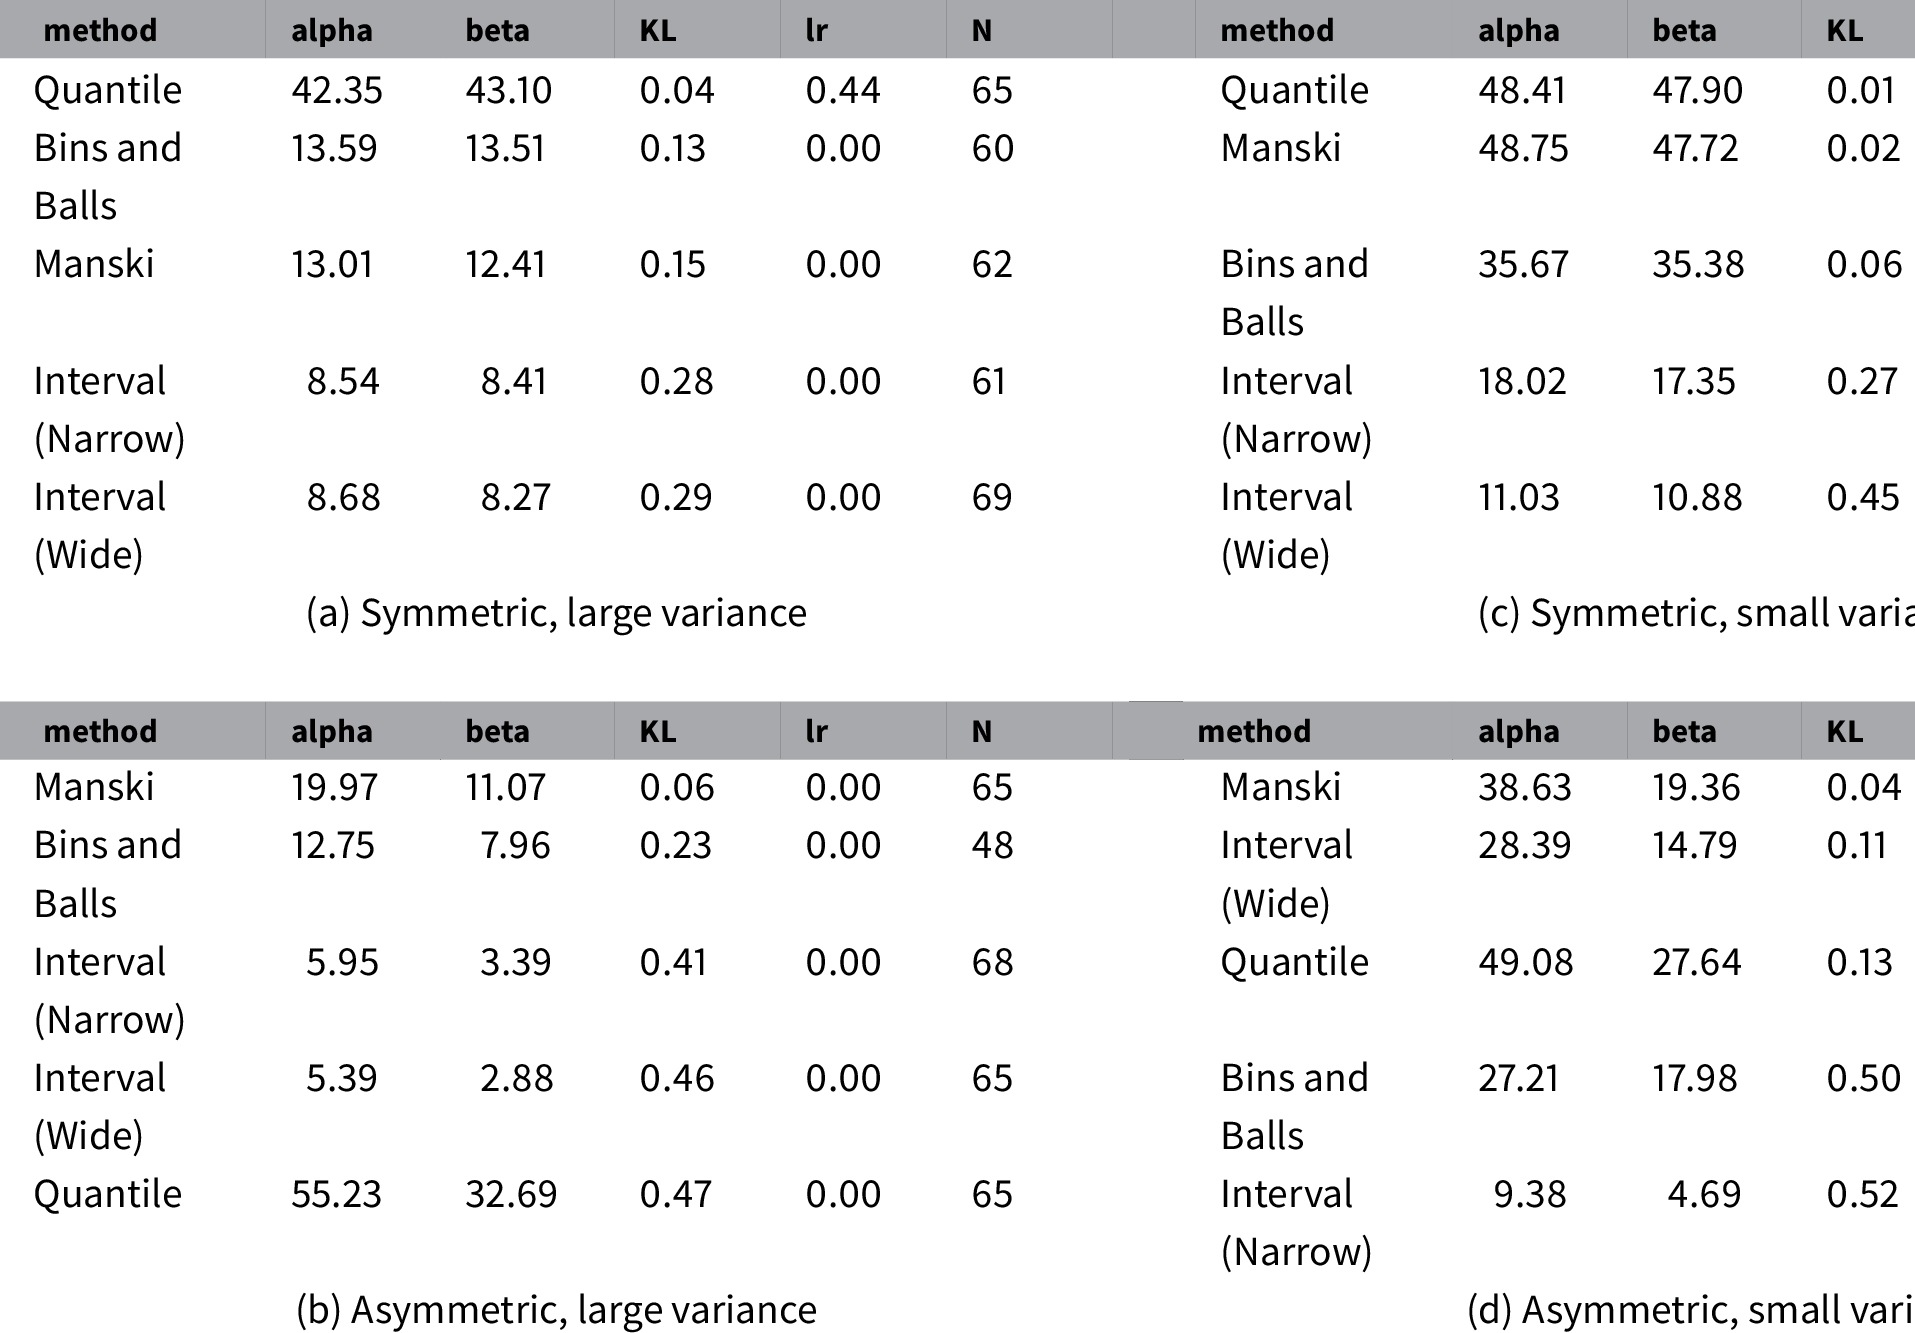
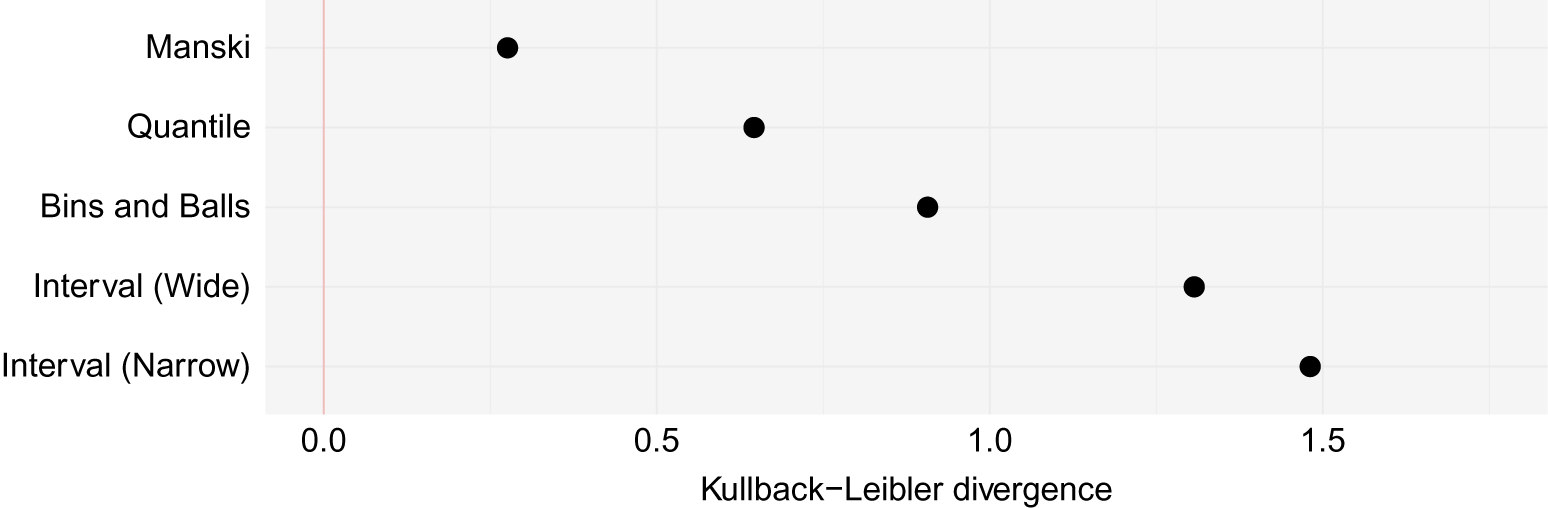
To evaluate the question formats more formally, we turn to the results in Table 2 where we illustrate for each combination of experimental factors: the implied parameters of the elicited priors, the Kullback–Leibler divergence, the number of observations, and the p-value of a likelihood-ratio test on whether the estimated parameters differ from the true values of the parameter. The smaller the KL divergence, the closer the elicited prior is to the true distribution. We also present a figure with the sum of the KL divergence over all four experimental conditions (see Figure 4). Here, we again only show the results when averaging across all respondents. The online appendix contains the results for individual respondents (see Figure 3).
Experimental comparison of five elicitation methods across four scenarios. Implied parameters of elicited priors, Kullback–Leibler divergence, p-value of a likelihood-ratio test and number of observations shown.

Summed Kullback–Leibler divergence. The Manski question performs best across the five experimental scenarios.

If we take the sum of all four experimental settings, the Manski question scores the smallest value for the Kullback–Leibler divergence,
 $KL=0.28$
. It is followed by the Quantile question (
 $KL=0.65 $
) and Bins and Balls (
 $KL=0.91$
). The two Interval questions perform worst (
 $KL=1.31$
for the wide and
 $KL=1.48$
for the narrow interval). As mentioned above, in practice asymmetric scenarios are more frequent and the Manski question format also beats all other alternatives for this case.
Based on these experiments we conclude that the Manski question format outperforms the other elicitation methods. In principle, it seems intuitive that eliciting more points along a distribution would also result in a better measurement of respondents’ beliefs.Footnote 7 However, we would be mistaken to equate the number of questions with an elicitation’s methods performance. The Quantile question, for instance, asks for three quantities and adds an adequacy check. Without this adequacy check (an option that we test, see Table A5 in the online appendix), it would ask just as many questions as the two Interval questions—yet the performance across these formats clearly differs. Without the adequacy check, the Quantile question outperforms the two Interval questions in the symmetric scenario with large variance (KL-distance of .07 vs. .28 and .29) but has more problems than the two Interval questions in the asymmetric scenario with large variance (KL-distance of .98 vs. .41 and .46). One possibility why the Quantile question fares better in the symmetric case than in the asymmetric case is that in the symmetric case respondents can rely on equal distance of the first and third quantile to the median as an informal adequacy check. This possibility does not exist when the belief is asymmetric.
In sum, the Manski format provides a fairly effective approach to prior elicitation that is straightforward to implement because it only requires five questions to measure respondents’ beliefs. In addition, the Manski question takes marginally less time (median completion time was 170 s) than the Quantile question (200 s) and Bins and Balls (199 s), but more time than the two Interval questions (149 and 157 s, respectively). These differences are not statistically significant (more detail is provided in Section A8 in the online appendix).
A valid question is whether our results are sensitive to the composition of the sample used. For example, it is unclear whether respondents on MTurk pay more or less attention than “normal” respondents. While some argue that MTurkers are less attentive and try to complete tasks as quickly as possible, others argue that workers are more attentive because they are paid for these tasks. Several studies have looked into the properties of MTurk samples and found them to perform equally well to other online samples (Mullinix et al. Reference Mullinix, Leeper, Druckman and Freese2015; Coppock Reference Coppock2018). We provide analyses that probe into the effects of respondents’ attention in the online appendix (Section A5). Comparing attentive respondents (i.e., those that passed the attention checksFootnote 8 ) to all respondents, we find that attentive respondents are slightly closer to the objective distributions than the complete sample. More importantly however, the relative performance of the five elicitation methods is not affected by respondents’ level of attentiveness. We find similar results for the distinction between sophisticated and unsophisticated respondents (as proxied by political interest, see Section A6 in the online appendix).
On a final note, we only find limited evidence for any systematic biases in respondents’ beliefs. In particular, we only observe over-confidence (i.e., respondents’ tendency to be more certain than the objective data would warrant and, therefore, assign variances that are too narrow) in the case of the Quantile question. In the symmetric scenario with large variance, for instance, the true standard deviation is
 $\sigma =.064$
, but the average elicited distribution yields a standard deviation of only
 $\sigma =.051$
.Footnote 9
For all other formats, respondents actually express beliefs that are less certain than the objective benchmark would demand (i.e., the elicited distributions are too wide).
Before concluding this letter, we provide an illustrating application where we use these different techniques to elicit people’s subjective beliefs about a future outcome.
5 Application: What Vote Share Will Trump Receive in November 2020?
In the applied setting of an actual elicitation process, researchers would of course not instill an objective distribution. Instead they would seek to elicit the beliefs that respondents already hold about a subject matter. To illustrate the relative performance of the five elicitation methods in a more realistic setting, this section provides an example where we ask respondents to indicate their beliefs about the upcoming presidential election. This closely mimics an actual elicitation exercise.
We report the results from an online survey carried out on MTurk with 500 participants. Each respondent was asked what their belief was of the popular vote share that Donald Trump will garner in November 2020. As with the main experiments presented above, we again only offer respondents one randomly assigned question format in a simple between-subjects design. For each question format, we estimate the underlying belief distribution of the full sample and then, because we expect clear partisan differences, separately for Democrats and Republicans.
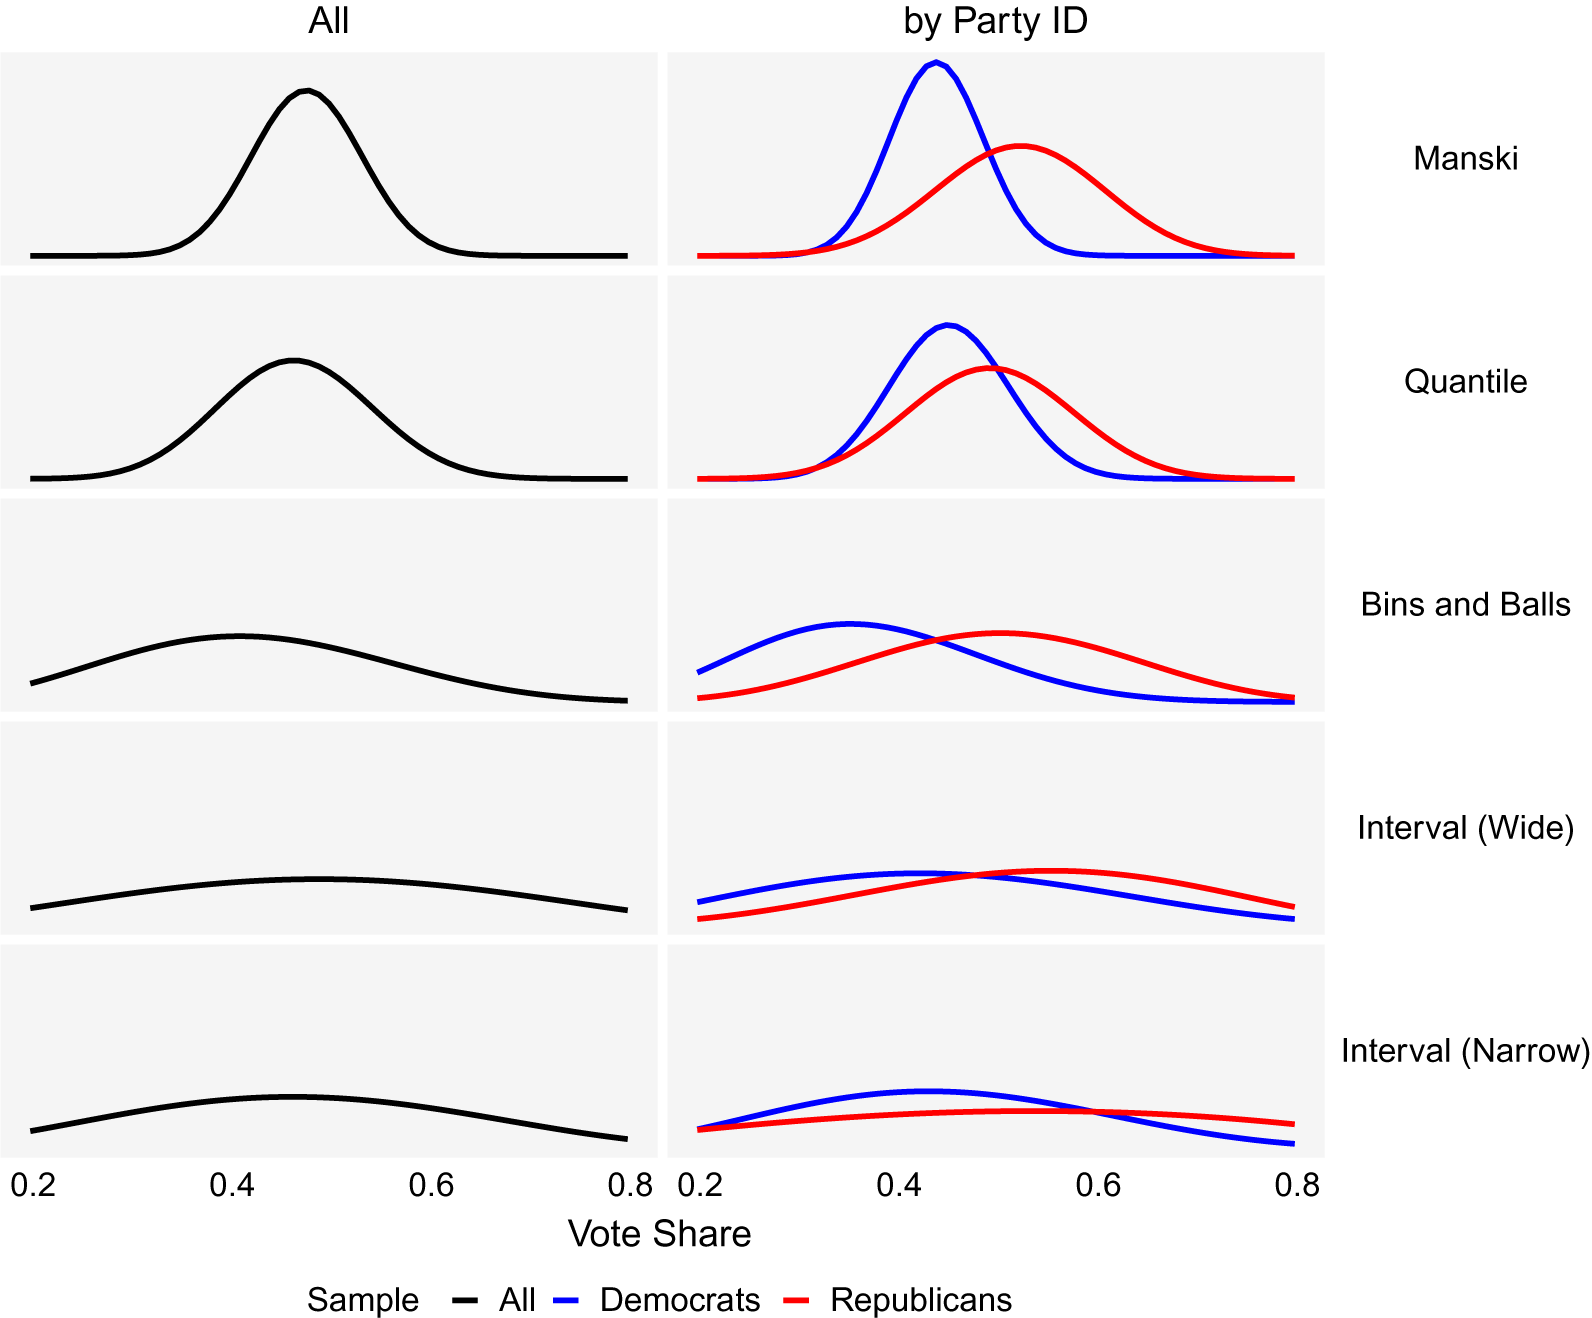
There are two main results that can be gleaned from Figure 5 (we provide more detail on the estimated beliefs in Table A10 in the online appendix). First, which question format is used for eliciting respondents’ beliefs clearly matters. The average expected 2020 popular vote share for Donald Trump differs from one format to the other. In addition, the elicitation methods differ vastly in the belief variances they produce (see Section A7 in the online appendix for more details). In the experiments, the Manski question format performed best in retrieving objective belief distributions. When eliciting pre-existing subjective beliefs we do not know the true distribution and hence cannot assess each method’s precision. What we can assess, is how clearly the signal is measured, that is, which formats provide plausible results with low variance. In the 2020 Trump election example, we find that the ordering in performance is similar to the ordering found in the experiments. Given what we know about vote shares in U.S. presidential elections, the variances provided by the two Interval questions and Bins and Balls are much too wide to be of any substantive use. The average beliefs elicited by the Interval question have a standard deviation of
 $\sigma =17.9$
% (wide) and
 $\sigma =16.3$
% (narrow) while the beliefs produced by Bins and Balls have standard deviation of
 $\sigma =13.1$
%. In line with the experimental results, both the Manski and Quantile question formats provide reasonable results
 $\sigma =5.4$
and
 $\sigma =7.5$
%, respectively), but the Manski question format again performs best.
Elicited beliefs over Trump’s popular vote share in November.

The second result is that there are clear partisan differences in the beliefs and expectations about the upcoming 2020 presidential election. We think this is in line with prior literature (Lebo and Cassino Reference Lebo and Cassino2007; Kuru, Pasek, and Traugott Reference Kuru, Pasek and Traugott2017; Madson and Hillygus Reference Madson and Hillygus2019). Relying on the preferred Manski question format, we find that Republicans have a more optimistic belief about Donald Trump’s expected popular vote share (52.3%) than Democrats (44.1%). At the same time, Republicans are less certain about the election outcome than Democrats. The standard deviation of Republicans’ belief is
 $\sigma =8.1$
% compared to only
 $\sigma =4.7$
% for Democrats.
6 Conclusion
This research note has empirically evaluated five different question formats for prior elicitation in the context of online surveys. For each format, we derived the estimators to recover the shape parameters describing respondents beliefs and ran experiments to compare the relative performance of these elicitation methods. We find that a set of questions originally proposed by Manski (Reference Manski2009) performs very well.
This is good news for applied researchers who seek to study citizens beliefs as distributions. While all five types of elicitation methods are fairly easy to implement, the Manski question is especially straightforward as it only consist of asking people for five numbers (most likely value, lower and upper bound and the probabilities associated with the two bounds). Since it is purely verbal, there is no need for programming—unlike other elicitation methods, such as the Bins and Balls method recently proposed by (Goldstein and Rothschild Reference Goldstein and Rothschild2014) which requires programming in Java script. In addition, the Manski format seems to perform in a similar fashion across different subgroups defined by political sophistication, which can be a relevant consideration. Finally, there is one caveat that needs mention: we assumed throughout that citizens’ beliefs follow a unimodal distribution. While this is a reasonable assumption in many circumstances, it is possible that one would want to elicit multimodal beliefs. In such situation, the Bins and Balls format would allow researchers to do so, but the estimation methods must be adapted accordingly.
Data Availability
Supplementary materials for this article are available on the Cambridge Core website. For Dataverse replication materials, see Leemann et al. (Reference Leemann, Traunmueller and Stoetzer2020).
Supplementary Material
For supplementary material accompanying this paper, please visit https://dx.doi.org/10.1017/pan.2020.42.
Acknowledgments
Many thanks to Daniel Bischof, Tim Hicks, Patrick Kraft, Andreas Murr, Simon Munzert, Ana Petrova, and David Rothschild for their valuable comments and help. We would also like to thank the editor for his guidance and help and the two anonymous referees for their comments. We thank Lucien Baumgartner for his impeccable research assistance. This research was partly funded by the Department of Political Science at the University of Zürich.