Implications
This work is the first evaluation of the effects of a quantitative trait locus (QTL) for increased muscularity on a wide range of carcass traits measured by subjective conformation and fat class scores and video image analysis (VIA) in crossbred lambs. The work is important in providing information on the potential of the subjective conformation and fat class scores and automatic VIA to estimate the QTL effect on carcass composition and to help provide the basis for the development of a value-based marketing system. The present work together with other ongoing work on the effects on carcass traits of the QTL affecting loin muscling, meat quality, lambing ease and lamb vigour will provide the information required for a comprehensive evaluation on the use of this QTL in selection programmes.
Introduction
In the UK, the identification of a quantitative trait locus (QTL) on OAR 18 by Walling et al. (Reference Walling, Visscher, Wilson, Mcteir, Simm and Bishop2004) in a Texel sheep population, which increases eye muscle depth by 4% to 8%, has provided an opportunity to increase the efficiency of selection programmes for increased loin muscling. This QTL was later confirmed by another study (Matika et al., Reference Matika, Pong-Wong, Woolliams, Low, Nieuwhof, Boon and Bishop2006) and will be referred to here as TM-QTL (short for Texel muscling-QTL). In a recent study using the same population of crossbred as in this study, Macfarlane et al. (Reference Macfarlane, Lambe, Bishop, Matika, Rius-Vilarrasa, Mclean, Haresign, Wolf and Bünger2008) reported an increase of +6.7% in the Musculus longissimus lumborum (MLL) depth, with +3.0% in the width and +5.1% in the area as measured by in vivo computer tomography (CT) in carriers of a single copy of the TM-QTL. The dissected weight of the MLL was found to be +7.1% greater in the TM-QTL carriers v. the non-carriers.
Some previous studies have found that increased muscularity due to certain mutations can be associated with detrimental effects on meat quality (MQ) (Shackelford et al., Reference Shackelford, Koohmaraie, Cundiff, Gregory, Rohrer and Savell1994; Koohmaraie et al., Reference Koohmaraie, Shackelford, Wheeler, Lonergan and Doumit1995; Field et al., Reference Field, McCormick, Brown, Hinds and Snowder1996). While MQ characteristics are very important for the lamb industry, they are very difficult and costly to measure. Currently, commercial lamb carcasses in the UK are evaluated subjectively by an expert grader using the Meat and Livestock Commission (MLC) carcass classification scheme for conformation and fat class (Anderson, Reference Anderson2003). To improve the accuracy, precision and consistency of the commercial evaluation of lamb carcasses, research is being undertaken to investigate the use of video image analysis (VIA) for the assessment of carcass value. Previous studies have shown that VIA can objectively predict lamb carcass composition (Horgan et al., Reference Horgan, Murphy and Simm1995; Stanford et al., Reference Stanford, Richmond, Jones, Robertson, Price and Gordon1998; Brady et al., Reference Brady, Belk, LeValley, Dalsted, Scanga, Tatum and Smith2003), with higher accuracy and precision than the subjective classification scheme (Rius-Vilarrasa et al., Reference Rius-Vilarrasa, Bünger, Matthews, Maltin, Hinz and Roehe2008). Besides, the use of VIA systems in combination with other carcass grading systems has also been investigated and the results reported higher safety of the estimations (Branscheid et al., Reference Branscheid, Horeth, Dobrowolski-Kulmbach, Baulain-Neustadt and Tholen2004) when VIA system was included in the evaluation. In a recent study, VIA scanning of live lambs has been shown to help in the prediction of MQ by the estimation of intra-muscular fat (IMF) (Lambe et al., Reference Lambe, Navajas, Schofield, Fisher, Simm, Roehe and Bünger2008). In addition Hopkins (Reference Hopkins1996) showed that VIA could also help to estimate muscularity (muscle shape) as suggested by Purchas et al. (Reference Purchas, Davies and Abdullah1991), based on a function of the weight of muscle and the length of the bone it surrounds. The use of VIA to provide the basis for a payment system based on meat yield, VIA on lamb carcasses may also offer the possibility to help in the estimation of MQ traits in a non-destructive and cost-efficient way. Therefore, producers willing to use the TM-QTL as a meat-yield-enhancing QTL could be economically rewarded, whilst any associated effects on MQ could also be monitored.
Therefore, the aims of this study were to evaluate the effect of the TM-QTL on carcass characteristics of crossbred lambs, as an example of a muscle-growth-enhancing QTL that is likely to be used by the sheep industry. The study will evaluate the effect of the TM-QTL on carcass traits (i.e. conformation, primal joint weights, dimensional measurements and carcass and leg compactness) estimated using both conformation and fat class scores and a VIA system. In addition, effects of calibrating VIA prediction equations using CT measurements will be evaluated. Finally, the ability of the VIA system to predict MQ traits will also be investigated.
Material and methods
Experimental animals
A total of 166 crossbred lambs, born in 2006 out of 2-year-old Mule (Bluefaced Leicester × Scottish Blackface) ewes mated to purebred Texel rams, known to be heterozygous for TM-QTL were included in this study. All lambs were grazed on pasture at the Scottish Agricultural College (SAC) sheep unit near Edinburgh. Live weight was recorded every 5 weeks until lambs reached around 20 weeks of age. The four Texel sires used in the experiment were previously identified as heterozygous for the TM-QTL from a population in which the QTL was known to be segregating (Walling et al., Reference Walling, Visscher, Wilson, Mcteir, Simm and Bishop2004; Matika et al., Reference Matika, Pong-Wong, Woolliams, Low, Nieuwhof, Boon and Bishop2006). All Mule dams were non-carriers of the TM-QTL. Macfarlane et al. (Reference Macfarlane, Lambe, Bishop, Matika, Rius-Vilarrasa, Mclean, Haresign, Wolf and Bünger2008) described in detail the classification procedure to determine whether lambs were heterozygous for the TM-QTL (carriers) or wildtype (non-carriers). Four microsatellite markers on chromosome 18 were used for genotyping the TM-QTL at Catapult Genetics, New Zealand. Out of the 166 lambs genotyped, 49 lambs were classified as non-carriers, 62 as carriers and 55 had an unknown TM-QTL status. Only three of the four sires used were found to be segregating for the QTL following the genotypic analysis of their progeny; therefore the lambs of uncertain TM-QTL status were either the progeny of the non-segregating sire or progeny of the other three sires in which it was not possible to assign unambiguously a genotype to them. These lambs were, therefore, excluded from any analyses involving direct comparisons between heterozygous carrier and non-carrier (wildtype) animals.
Computer tomography
Computer tomography measurements in the loin area were also available. Measurements of the loin muscle (M. longissimus lumborum) obtained by CT scanning and by dissection have shown significant effects of the TM-QTL on several traits, as reported by Macfarlane et al. (Reference Macfarlane, Lambe, Bishop, Matika, Rius-Vilarrasa, Mclean, Haresign, Wolf and Bünger2008). While the ‘standard’ VIA prediction equations developed by E + V Technology GmbH (http://www.eplusv.de/) did not yield any significant differences between carriers and non-carriers, an attempt was therefore undertaken to refine the VIA prediction equations using data from the CT traits and dissected weight of the M. longissimus lumborum (MLL-wt). The calibration of the VIA system against CT measurements in the loin area offers the possibility to detect new VIA predictor traits and to fine-tune predictors already in use by E + V Technology in their set of prediction equations to increase the accuracy and precision of the estimation of carcass primal meat yields. Subjective systems for the evaluation of carcass value, such as the MLC carcass classification scheme for conformation and fat class, have a rather small margin for improvement, first, because of its lower consistency (Rius-Vilarrasa et al., Reference Rius-Vilarrasa, Bünger, Matthews, Maltin, Hinz and Roehe2008), and also because of the difficulty to incorporate additional measurements into the evaluation of conformation and fat class at a line speed currently of 4 to 5 s per carcass, which is known as the fastest line speed in a lamb abattoir in the UK. Therefore, the present study has focused to further develop the automated VIA system by calibrating it against CT measurements.
Computer tomography scanning in vivo was used to obtain both two- and three-dimensional measurements, as described by Macfarlane et al. (Reference Macfarlane, Lambe, Bishop, Matika, Rius-Vilarrasa, Mclean, Haresign, Wolf and Bünger2008), for all 166 lambs at an average age of 144 days. Two-dimensional (2D) CT measurements were taken in the loin region from a cross-sectional image taken at the fifth lumbar vertebra described in detail by Jones et al. (Reference Jones, Lewis, Young and Wolf2002) and included the M. longissimus lumborum area (MLL-A), width (MLL-W) and depth (MLL-D). Three-dimensional (3D) CT measurements were also taken in the loin area, using contiguous images taken at 8 mm intervals along the body (Navajas et al., Reference Navajas, Glasbey, Mclean, Fisher, Charteries, Lambe, Bunger and Simm2006b), which are available using spiral CT scanning and can be used to allow a 3D approach (Navajas et al., Reference Navajas, Lambe, Mclean, Glasbey, Fisher, Charteris, Bunger and Simm2007). These 3D measurements included lumbar spine length (lumbar length), loin muscle volume (LRMV) and the calculated loin muscularity index (LRMI).
The CT measurements in the loin region described above were provided to E + V Technology to support investigations to further refine their prediction models for the estimation of primal meat yields from different carcass cuts, in particular in the loin area. These refined prediction equations for primal meat yield were then used in an attempt to enable VIA to distinguish between TM-QTL carriers and non-carriers for the primal weights. From these analyses, E + V Technology also obtained predicted values for the CT measurements for MLL-A, MLL-W, MLL-D, lumbar length, LRMV and LRMI using VIA information. In total, eight predictors, (a combination of lengths, areas, widths measured on the carcass by image analysis) were used by E + V Technology, together with live weight, to obtain VIA-based estimates of the CT traits. These estimates are also of scientific interest as they demonstrate the predictability of certain CT traits from VIA measurements. Therefore, it was possible to evaluate the effect of the TM-QTL on the CT loin measures based on VIA information and to compare these results with those reported by Macfarlane et al. (Reference Macfarlane, Lambe, Bishop, Matika, Rius-Vilarrasa, Mclean, Haresign, Wolf and Bünger2008) on the effect of the TM-QTL in the loin region measured directly by CT.
Slaughter, carcass classification, VIA and other carcass traits
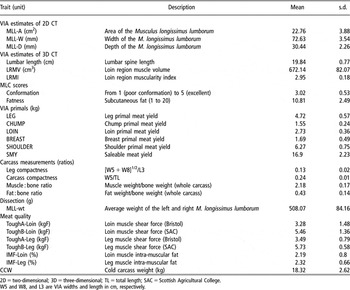
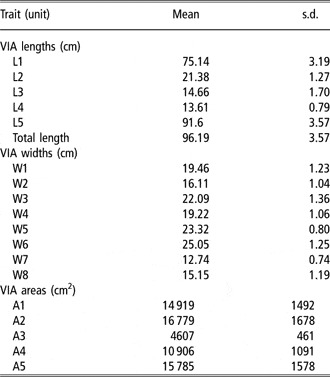
At approximately 20 weeks of age (141 to 159 days) lambs were slaughtered under commercial conditions, including a final high-voltage electrical stimulation of the carcass, at Welsh Country Foods (lamb abattoir in Gaerwen). Lambs were assessed according to the MLC’s Sheep Carcass Classification Scheme for conformation and fatness by the same MLC expert grader employee in the abattoir. Carcass conformation is assessed using the EUROP five-point scale (where ‘E’ is for excellent and ‘P’ is for poor conformation), and fatness, using a five-point scale from 1 (leaner) to 5 (fatter), with scores 3 and 4 sub-divided into ‘L’ (leaner) and ‘H’ (fatter). These subjective grades were then converted to numeric scales, with conformation coded as E = 5, U = 4, R = 3, O = 2, and P = 1 and fatness transformed to a corresponding estimated subcutaneous fat percentage (1 = 4, 2 = 8, 3L = 11, 3H = 13, 4L = 15, 4H = 17 and 5 = 20) (Kempster et al., Reference Kempster, Cook and Grantley-Smith1986). For VIA scanning, lambs were redirected from the main slaughter line to the VIA station (VSS2000; E + V Technology). The carcass assessment unit of VSS2000 consisted of two cameras, standardised lighting and the VSS2000 image processing and analysing software. The VIA station also included a metal structure and chain to move carcasses through at the same speed as the actual slaughter line (800 carcasses/h). The 166 lamb carcasses were presented to the VIA system for image capture in a standardised position with the legs spread apart (on a gambrel hook) and shoulders unbanded. VIA system measurements included dimensional characteristics of the carcass and colour variation at selected positions. The relative proportions of fat can be calculated from the pixel colour values extracted from the image. The percentage of different colour pixels allowed E + V Technology to calculate the level of carcass fatness. However to estimate weights of primal cuts E + V Technology used a series of carcass dimensional measurements which included lengths, widths and calculated areas (some are presented in Figure 1). The VIA meat yield estimates were obtained from the leg (LEG), chump (CHUMP), loin (LOIN), breast (BREAST) and shoulder (SHOULDER) primal cuts, which will be subsequently referred to as VIA primal cuts. The software which captured the image and automatically divided the carcass into different anatomical regions to predict weights of carcass primal cuts (LEG, CHUMP, LOIN, BREAST and SHOULDER) was calibrated and validated under UK abattoir conditions on a previous study (Rius-Vilarrasa et al., Reference Rius-Vilarrasa, Bünger, Matthews, Maltin, Hinz and Roehe2008). In the present study, carcass dimensional measurements and estimates of meat yield in these primal cuts were used to investigate for any significant differences due to the presence of the TM-QTL. Furthermore, the effect of the TM-QTL was tested on additional carcass measurements describing other aspects of carcass quality. These carcass measurements were calculated using combinations of VIA dimensional measurements and are referred to in this study as leg compactness, carcass compactness, muscle to bone ratio and fat to bone ratio (Table 1).
Dimensional measurement, lengths, widths and areas of back and side views of the carcasses obtained by VIA. aStraight line through the centre of gravity, borthogonal to the centre of gravity and cvertical in a 90° angle to the dividing line.

Carcass dissection
After VIA scanning, the 166 lamb carcasses were transported to SAC, Edinburgh, in a refrigerated lorry for further processing. The right side of the carcass was dissected into primal cuts (leg, chump, loin, breast and shoulder) to match supermarket specifications, with external (subcutaneous) fat trimmed to a maximum of 6 mm. To our knowledge, no literature references have been found regarding carcass side differences and, therefore, side effects were not considered in the present study for practical reasons. The dissected weights of primal cuts were used in this study to investigate the accuracy and precision of the VIA system in the estimation of primal cuts using (i) the standard and (ii) refined VIA prediction equations. The left leg, chump, breast, loin and shoulder joints were dissected into lean meat (muscle), fat (including subcutaneous fat and inter-muscular fat) and bone and were used to obtain CT estimates of carcass composition described in more detail elsewhere (Macfarlane et al., Reference Macfarlane, Lambe, Bishop, Matika, Rius-Vilarrasa, Mclean, Haresign, Wolf and Bünger2008).
The left and right M. longissimus lumborum muscle was removed and weighed separately during the butchery process. Since the dissected weight of the MLL was +7.1% heavier in TM-QTL carriers compared to non-carriers (Macfarlane et al., Reference Macfarlane, Lambe, Bishop, Matika, Rius-Vilarrasa, Mclean, Haresign, Wolf and Bünger2008), the MLL-wt was considered to provide information on the differences between carriers and non-carriers. Therefore, the MLL-wt data was provided to E + V Technology, who used VIA information to predict this trait.
Total saleable meat yield in the carcass (SMY) was calculated by summing the weights of boneless chump, chump trimmings (very lean), hind leg-shank-off, hind leg fillet, chops, breast, shoulder knuckleside and bladeside cuts of the right carcass side. More details of the dissection process have been given elsewhere (Macfarlane et al., Reference Macfarlane, Lambe, Bishop, Matika, Rius-Vilarrasa, Mclean, Haresign, Wolf and Bünger2008).
Meat quality
Meat quality analyses on leg (M. vastus lateralis) and loin (M. longissimus lumborum) muscles from all 166 lambs were available as part of the wider project to evaluate the effects of the TM-QTL on MQ characteristics. Between 7 and 12 days post-slaughter, two muscles, from the leg and loin, from both sides of each lamb carcass, were removed, vacuum-packed and then frozen. The two right-hand-side muscles were transported to the University of Bristol for MQ analyses and the two left-hand-side muscles were analysed at SAC Edinburgh. Measures of toughness (force (kgF) required to shear the sample) were recorded in both muscles in Bristol and Edinburgh using a similar method, but using slightly different compression equipment. Samples were cooked (in vacuum-pack bags) in water to an internal temperature of 78°C (at Bristol) and 75°C (at SAC) and then cooled and held at around 4°C. Ten sub-samples of 10 × 10 × 20 mm were cut from each muscle in the direction of muscle fibres. In Bristol, muscle samples were tested using a TA-XT2 texture analyser (Stable Micro System, Surrey, UK) fitted with Volodkevich-type jaws providing ‘Tough A’ measures. In Edinburgh, cooked samples were analysed using a MIRINZ tenderometer (AgResearch MIRINZ, Hamilton, New Zealand) to provide ‘Tough B’ measures. Measures of IMF were available from Bristol for the two muscles after using petroleum ether (boiling point = 40°C to 60°C) as the solvent in a Soxhlet extraction (British Standards Institution, 1970). Duplicate measures of IMF were made per animal for the loin to obtain an average. However, the leg muscle was small in many of the lambs, permitting only one IMF analysis per animal. VIA dimensional measurements were used in the prediction models to estimate MQ traits and accuracy and precision of these predictions were calculated.
Statistical analysis
From a total of 166 lamb carcasses, only lambs classified as carriers (n = 62) or non-carriers (n = 49) of the TM-QTL were used in the analyses. The accuracy (R 2) and precision (root mean square error (RMSE)) with which E + V Technology predicted the primal cuts and CT traits were investigated using general linear model procedure in SAS (SAS Institute Inc., Cary, NC, USA). Two PROC MIXED procedure models were defined as: model
(1)only for the primal cuts (LEG, CHUMP, LOIN, BREAST and SHOULDER) and CT traits (MLL-A, MLL-W, MLL-D, lumbar length, LRMV and LRMI); and model
(2)for all the traits in Tables 1 and 2.


where, Yijklm and Yijlm are the vectors of observations, for the traits presented in Tables 1 and 2, of the mth individual with fixed effects of ith sex, i varying from 1 to 2 (male or female); of jth TM-QTL status, j varying from 1 to 2 (carrier or non-carrier); random effect of kth sire, k varying from 1 to 3; of lth VIA-estimate (of primal cuts and CT traits) and cold carcass weight (CCW); and linear regression coefficient b 1 of VIA-estimates and CCW for mth individual with general mean μ and random residual effects of eijklm and eijlm. The sire effect and the age of the lambs at slaughter were also tested, but were found not to be significant for most of the traits in model
(2)and therefore were not included in the final model used for analysis. The rearing rank of the lamb (single or twin) was significant (P < 0.05) for only one trait (W3) and was therefore only included in the analysis for this trait. No significant interactions between fixed effects were found on any of the traits.
Description, means and standard deviations of computer tomography (CT), Meat and Livestock Commission (MLC) scores, video image analysis (VIA), dissection and meat quality traits

2D = two-dimensional; 3D = three-dimensional; TL = total length; SAC = Scottish Agricultural College.
W5 and W8, and L3 are VIA widths and length in cm, respectively.
Means and standard deviations of video image analysis (VIA), dimensional measurements of lengths, widths and areas

A stepwise regression analysis was used, with the SAS REG procedure, to identify which of the main VIA dimensional measurements explained most of the variation in MQ traits. VIA dimensional measurements found to be significant (P < 0.05) were then fitted in a regression model using the REG procedure as implemented in SAS. This procedure provides, in addition to the coefficient of determination, the adjusted coefficient of determination (Adj-R 2) accounting for the number of factors included in the model. The effect of sex, as a fixed effect, and CCW, as covariate, were also included in the prediction models for MQ traits. The accuracies of the prediction models used to estimate MQ traits were investigated using the corresponding Adj-R 2 and RMSE divided by standard deviation. The Adj-R 2 was used to compare accuracy between regression models with different numbers of independent factors and RMSE and RMSE/s.d. to obtain a measure of precision, the latter being independent of the units in which the trait was measured, thus comparable across traits.
Traits were reanalysed adjusting for variation in age at the time of slaughter instead of CCW. The differences in the response variable were minimal and therefore the results presented in this study are those corrected for CCW, or live weight in the case of CT traits.
Results and discussion
Prediction of computer tomography traits using a VIA system
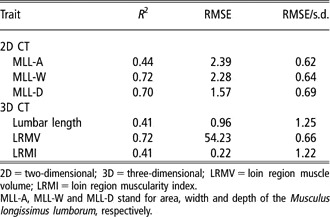
Moderate accuracies were found in the estimation of CT traits using the VIA system. Coefficients of determination (R 2) ranged from 0.41 to 0.72 for lumbar length, LRMI, MLL-W and LRMV, respectively (Table 3). The precision measured by RMSE/s.d. ranged from 0.62 to 1.25 for MLL-A and lumbar length, respectively. A value above unity for the RMSE/s.d. as is the case for the lumbar length (1.25) indicates that the prediction model is as good estimate as the naïve average of the trait. For the majority of the traits, these results indicate that the VIA system provides a moderately accurate prediction of these CT traits, however so far only this dataset was analysed and therefore in future a validation analysis is required to confirm the results found in the present study.
Coefficients of determination (R 2) and root mean square errors (RMSE) of the estimation of computer tomography (CT) measures using video image analysis carcass information

2D = two-dimensional; 3D = three-dimensional; LRMV = loin region muscle volume; LRMI = loin region muscularity index.
MLL-A, MLL-W and MLL-D stand for area, width and depth of the Musculus longissimus lumborum, respectively.
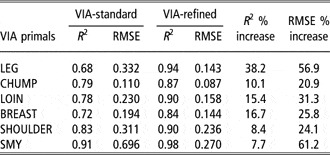
Moderate associations were found between VIA and CT measurements, which could be used to refine the VIA-based prediction models used in this study for the estimation of primal cuts and SMY (Table 4). The VIA standard prediction equations developed by E + V Technology and described in an earlier study (Rius-Vilarrasa et al., Reference Rius-Vilarrasa, Bünger, Matthews, Maltin, Hinz and Roehe2008) were used here to estimate the primal weights. Standard prediction models that included dimensional measurements of the carcass along with CCW had moderate to high accuracies (R 2 between 0.68 and 0.91) estimates for LEG, CHUMP, LOIN, BREAST SHOULDER and SMY (Table 4). However, the VIA-refined prediction equations increased the accuracy of the predictions by 8% to 38% and substantially increased the precision with which VIA predicted the primal cuts by between 21% and 61%, shown by a reduction in percentage of the RMSE between standard and refined VIA prediction models for all traits measured (Table 4). The VIA-refined prediction equations included carcass dimensional measurements that, in addition, also explained variation in the CT measurements, along with CCW. However the percentage of improvement in the VIA prediction models including CT traits would probably have been smaller, if the standard VIA prediction equations had been developed using the present dataset. Higher prediction accuracies, for the estimation of primal meat yields, than in the present study were found when the dataset of an earlier study was used to derive the VIA prediction equations (Rius-Vilarrasa et al., Reference Rius-Vilarrasa, Bünger, Matthews, Maltin, Hinz and Roehe2008); in that study a larger number of lamb carcasses (n = 443) were used to develop the VIA prediction models. Nonetheless, the use of CT information (MLL-A, MLL-W, MLL-D, lumbar length, LRMV and LRMI) in the VIA prediction models was expected to improve the prediction models, especially on the loin area. A recent study in Norway by Kongsro et al. (Reference Kongsro, Røe, Aastveit, Kvaal and Egelandsdal2008) reported a more precise and reliable evaluation of weight and proportions of muscle, fat and bone tissue on the carcass using CT scanning compared to the evaluation using manual dissection. Therefore, using CT measurements as a reference method to refine VIA prediction models could also benefit from improving the prediction of all primal joints in the carcass.
Coefficients of determination (R 2) and root mean square errors (RMSE) of the estimation of primal meat yields using both standard and refined video image analysis (VIA) prediction models

The calibration of VIA against CT could potentially provide additional measures of carcass value online in abattoirs. The fairly high accuracy with which E + V Technology predicted MLL-W and LRMV (R 2 = 0.72 for both measurements), using VIA and the refined prediction equations, suggests that this automatic technology could be used to estimate certain muscularity (muscle shape) and muscling (muscle size) traits in carcasses on the slaughter line that can currently only be measured non-destructively using CT, with relatively high cost and not online. The suggestion of Hopkins (Reference Hopkins1996) to use VIA to quantify muscularity (muscle shape) seems to be supported by the present study. The refinements to the VIA predictions that have been made here, using CT measurements to calibrate VIA predictions, could also provide the means to distinguish the increase in loin muscling and muscularity of TM-QTL carriers at a commercial level, as reported in a later section of the present paper.
TM-QTL effects on computer tomography traits estimated using a VIA system
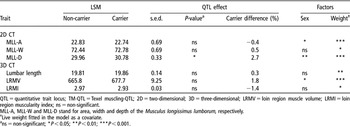
The VIA-based predictions of CT measures showed that heterozygous carriers of the TM-QTL had a significantly larger MLL-D (+2.7%, P < 0.05) compared to the non-carriers (Table 5). Macfarlane et al. (Reference Macfarlane, Lambe, Bishop, Matika, Rius-Vilarrasa, Mclean, Haresign, Wolf and Bünger2008), using the direct CT measure of MLL-D in live lambs in the same dataset, presented a higher difference (+6.7%, P < 0.01) between carriers and non-carriers of the TM-QTL. Direct CT measures of MLL-A, MLL-W and LRMV were also significantly associated with an increase of muscularity in the loin region of the TM-QTL carriers in the previous study (Macfarlane et al., Reference Macfarlane, Lambe, Bishop, Matika, Rius-Vilarrasa, Mclean, Haresign, Wolf and Bünger2008). However, here VIA-based predictions of these traits were not found to be significantly different between carriers and non-carriers of the TM-QTL.
Least square means (LSM) and standard error of difference for TM-QTL carrier and non-carriers for computer tomography (CT) measurements

QTL = quantitative trait locus; TM-QTL = Texel muscling-QTL; 2D = two-dimensional; 3D = three-dimensional; LRMV = loin region muscle volume; LRMI = loin region muscularity index; ns = non-significant.
MLL-A, MLL-W and MLL-D stand for area, width and depth of the Musculus longissimus lumborum, respectively.
†Live weight fitted in the model as a covariate.
ans = non-significant; *P < 0.05; **P < 0.01; ***P < 0.001.
The detection of increased MLL muscularity and muscling in crossbred lambs carrying the TM-QTL by the VIA carcass evaluation system, is of fundamental importance to facilitate a payment system that will provide an economical incentive to increase muscling or muscularity through the use of the TM-QTL. The results in Table 5 suggest that the effect of the TM-QTL, expressed mainly as an increase in meat yield in the loin area as detected by dissection and CT (Macfarlane et al., Reference Macfarlane, Lambe, Bishop, Matika, Rius-Vilarrasa, Mclean, Haresign, Wolf and Bünger2008), could be partially quantified using the VIA estimates of CT measures in the loin region. Further experiments could allow a validation of these prediction models to estimate CT measurements using a VIA system. A validation analysis would test the robustness of the prediction models and, therefore, the reliability of these estimates for their use in the evaluation of carcass quality.
TM-QTL effects on carcass classification scores and VIA characteristics
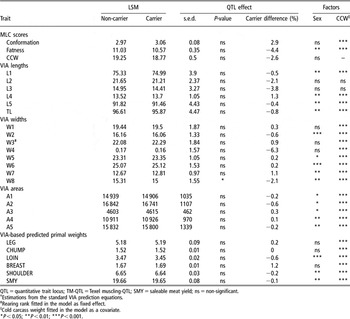
In terms of carcass classification scores, TM-QTL carrier animals had slightly better conformation and lower fat classes than non-carriers, although the effects were not significant (Table 6; P > 0.05). These results indicate that this recent scoring system would not allow any reward for the producers using the muscle-growth-enhancing effect of the TM-QTL in heterozygous crossbred lambs. In addition to standard and refined predictions of the primal weights, E + V Technology also provided some simple carcass measures (lengths, widths and areas) as illustrated in Figure 1. The effect of the TM-QTL on all of these traits was relatively small (−6.3 to +1.3%) and mostly not significant, with the exception of one VIA measurement (W8) measured on the side of the carcass in the leg region, where carriers showed a shorter width (P < 0.05; −2.1%) compared to the non-carriers. Similar results were reported by Johnson et al. (Reference Johnson, McEwan, Dodds, Purchas and Blair2005), where another QTL affecting muscle growth (currently known to be an allele of the myostatin gene), did not show any effect on length and width as direct linear measurements taken on the carcass after slaughter. In contrast, Marcq et al. (Reference Marcq, Larzul, Marot, Bouix, Eychenne, Laville, Bibe, Leroy and Georges2002) reported evidence that a QTL associated with muscular hypertrophy (probably the same as that studied by Johnson et al. (Reference Johnson, McEwan, Dodds, Purchas and Blair2005)) also resulted in an increase in carcass width. This finding was later confirmed in a study by Laville et al. (Reference Laville, Bouix, Sayd, Bibe, Elsen, Larzul, Eychenne, Marcq and Georges2004), where lambs homozygous for that QTL showed an increase in the width of the pelvis and shoulder.
Least square means (LSM) and standard error of difference for TM-QTL carrier and non-carriers for Meat and Livestock Commission (MLC) subjective scores of conformation and fat class and cold carcass weight, video image analysis (VIA) dimensional measurements (length, width and area) and VIA primal cutsFootnote †

QTL = quantitative trait locus; TM-QTL = Texel muscling-QTL; SMY = saleable meat yield; ns = non-significant.
† Estimations from the standard VIA prediction equations.
‡ Rearing rank fitted in the model as fixed effect.
§ Cold carcass weight fitted in the model as a covariate.
* P < 0.05; **P < 0.01; ***P < 0.001.
The effect of the TM-QTL on primal cuts, estimated using both standard and refined VIA prediction equations, was found to be non-significant for most of the traits (Table 6; only predictions based on the standard VIA predictions are shown). Using the refined VIA prediction equations the BREAST primal cut showed a lower primal weight (−3.8%, P < 0.01; results not shown in tables) associated with the effect of the TM-QTL. This result is in the same direction as the one reported by Macfarlane et al. (Reference Macfarlane, Lambe, Bishop, Matika, Rius-Vilarrasa, Mclean, Haresign, Wolf and Bünger2008) where carriers of the TM-QTL showed smaller breast primal weights (−2.4%, P > 0.05); however the difference was not significant in this earlier study.
The results reported in the present study suggest that external examination (carcass classification scores), on which the current evaluation of carcass quality and the VIA system both rely, is limited in its ability to detect differences in muscling and muscularity of the MLL due to the effect of the TM-QTL in crossbred lamb heterozygous for the QTL. This situation could be different in homozygous carriers, as the mode of inheritance of this QTL is not known yet. This limited ability is probably due to the fact that the TM-QTL effects are restricted to the loin area and are of relatively low magnitude (Macfarlane et al., Reference Macfarlane, Lambe, Bishop, Matika, Rius-Vilarrasa, Mclean, Haresign, Wolf and Bünger2008). The weight of the MLL directly measured by dissection was +7% higher in carriers compared to non-carriers of the TM-QTL (Macfarlane et al., Reference Macfarlane, Lambe, Bishop, Matika, Rius-Vilarrasa, Mclean, Haresign, Wolf and Bünger2008). However, the current study using VIA could not detect this difference and farmers would not be rewarded for the use of this QTL in heterozygous crossbred lambs in any VIA-based payment system. Therefore the question arises: how large does the direct QTL effect on the dissected MLL-wt needs to be, so that VIA can detect significant differences in the LOIN primal cut, predicted by VIA? To answer this question one has to ask first what difference between carriers and non-carriers in the LOIN weight (based on VIA predictions) would be significant. A post-hoc power calculation (Rasch et al., Reference Rasch, Herrendörfer, Bock and Busch1978) was used to find the magnitude of the TM-QTL effect required to be detected by the VIA system using the sample sizes available in the study, its standard deviation (0.36) and a probability of the error of first kind (5%) and second kind (20%). Using this approach it has been found that the required size of the TM-QTL effect on the LOIN weight (based on VIA predictions) is 0.18 kg. The estimated mean for non-carriers of this trait was 3.47 kg. As a result carriers would need to have a VIA predicted LOIN weight of 3.65 kg, which is an increase of +5%. This value can be easily transformed into a MLL-wt value using a simple linear regression between both traits. The level of confidence (R 2) in this prediction equation was 65%. Given the slope (b = 116) and the intercept (a = 108.4) of the prediction equation (MLL-wt = a + b × VIA-loin) the required direct effects in the MLL-wt to allow VIA to detect the difference in the VIA-predicted LOIN weight is 40 g (+7.6%). This value is just slightly higher than the difference between carriers and non-carriers found in an earlier study (34 g; Macfarlane et al., Reference Macfarlane, Lambe, Bishop, Matika, Rius-Vilarrasa, Mclean, Haresign, Wolf and Bünger2008), and may be seen in homozygous carriers of this QTL or in other genetic backgrounds/breeds.
TM-QTL effect on other carcass quality measurements
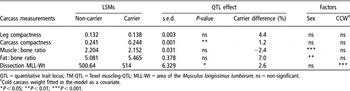
The TM-QTL did not significantly affect the VIA dimensional measurements (Table 6). However lambs carrying a single copy of the TM-QTL showed a significantly higher carcass compactness of 1.2% compared to the non-carriers (Table 7). The same trait calculated using dimensional carcass measurements was also found to be associated with the effect of another muscular hypertrophy QTL, as reported by Laville et al. (Reference Laville, Bouix, Sayd, Bibe, Elsen, Larzul, Eychenne, Marcq and Georges2004).
Least square means (LSM), standard error of difference and TM-QTL effect for leg and carcass compactness and muscle and fat to bone ratios

QTL = quantitative trait locus; TM-QTL = Texel muscling-QTL; MLL-Wt = area of the Musculus longissimus lumborum; ns = non-significant.
†Cold carcass weight fitted in the model as a covariate.
*P < 0.05; **P < 0.01; ***P < 0.001.
Other carcass measurements, such as leg compactness, muscle to bone ratio and fat to bone ratio were not found to be significantly different between carriers and non-carriers of the TM-QTL (Table 7). Holloway et al. (Reference Holloway, Purchas, Power and Thompson1994) reported a strong correlation between muscularity and muscle to bone ratio. Carriers of the TM-QTL had greater MLL volume, depth, width and area using CT measurements (Macfarlane et al., Reference Macfarlane, Lambe, Bishop, Matika, Rius-Vilarrasa, Mclean, Haresign, Wolf and Bünger2008). However, muscle to bone ratio measured using VIA did not show a significant increase. The corresponding total bone weight in the carcass was heavier using CT for the carriers compared to the non-carriers (Macfarlane et al., Reference Macfarlane, Lambe, Bishop, Matika, Rius-Vilarrasa, Mclean, Haresign, Wolf and Bünger2008), and consequently similar muscle to bone ratios were found for both carrier and non-carriers of the TM-QTL. Inconsistencies in the relationship between muscularity and muscle to bone ratio, where bones were shown to be proportionally longer or heavier, have been reported in earlier studies (Purchas et al., Reference Purchas, Morris and Grant1992; Hopkins and Roberts, Reference Hopkins and Roberts1995).
Carcass compactness has been reported to have correlated with subjective conformation score, perimeter of the leg and width of the leg, and strongly correlated with cold carcass weight (Diaz et al., Reference Diaz, Caneque, Lauzurica, Velasco, Ruiz de Huidobro and Perez2004; Albertí et al., Reference Albertí, Ripoll, Goyache, Lahoz, Olleta, Panea and Sañudo2005; Indurain et al., Reference Indurain, Goñi, Horcada, Insausti, Hernández and Beriain2008). The appearance of ‘blockiness’ of the whole carcass has been shown to have a positive influence on conformation score (Indurain et al., Reference Indurain, Goñi, Horcada, Insausti, Hernández and Beriain2008). The use of this index as a measure of carcass value could be possible with the introduction of VIA systems in UK lamb abattoirs. However, further research is needed to investigate the associations between increased carcass compactness and carcass value, meat quality and animal welfare traits.
Prediction of meat quality traits using a VIA system
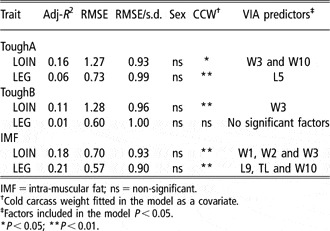
Variances of tenderness, as measured using the MIRINZ tenderometer (ToughB) and Volodkevitch-type tenderometer (ToughA), was poorly explained by models using VIA measurements (1% to 6%) in the leg for the two methods respectively (Table 8). Higher proportion of variance was explained in the model for IMF in the loin (18%) or leg (21%). These low associations between VIA and MQ traits were in the range of expected values since MQ characteristics are very difficult to measure at a carcass level.
Adjusted coefficient of determination (Adj-R 2), root mean squared error (RMSE) for prediction of meat quality traits using video image analysis (VIA) information

IMF = intra-muscular fat; ns = non-significant.
†Cold carcass weight fitted in the model as a covariate.
‡Factors included in the model P < 0.05.
*P < 0.05; **P < 0.01.
Methods for the evaluation of MQ characteristics are being increasingly investigated with the aim of improving the effectiveness of the lamb industry at producing a consistent, high quality product. CT scanning, which is currently being used in sheep breeding programs for the evaluation of carcass quality, could also provide the means to select on MQ traits. In two different studies (Karamichou et al., Reference Karamichou, Richardson, Nute, Mclean and Bishop2006; Navajas et al., Reference Navajas, Lambe, Bunger, Glasbey, Fisher, Wood and Simm2006a), live CT measurements have been reported to predict MQ traits with moderate accuracy, most likely due to the associations between IMF and CT-measured muscle density. Karamichou et al. (Reference Karamichou, Richardson, Nute, Mclean and Bishop2006) reported significant phenotypic and genetic correlations between CT and meat eating quality traits, and Navajas et al. (Reference Navajas, Lambe, Bunger, Glasbey, Fisher, Wood and Simm2006a) also found strong associations between CT muscle density and IMF. While CT scanning could help in the selection for MQ traits in breeding stock, direct measurements of these traits in slaughter lambs are still of prime interest, as processing operations (i.e. electrical stimulation) might influence the final quality of the product. A recent study by Lambe et al. (Reference Lambe, Navajas, Schofield, Fisher, Simm, Roehe and Bünger2008) reported an increase in the accuracy of prediction of IMF in the loin using a combination of VIA in live lambs together with CT measures. However, similar to the results presented here, Lambe et al. (Reference Lambe, Navajas, Schofield, Fisher, Simm, Roehe and Bünger2008) found that little variation in tenderness (shear force) was explained by live-VIA traits. Using a combination of post-mortem carcass measurements, Lambe et al. (Reference Lambe, Navajas, Bünger, Fisher, Roehe and Simm2009) reported accurate predictions of lamb carcass composition, as well as moderate predictions of IMF, whilst shear force could only be predicted with low to moderate accuracy. Using dual energy X-ray absorptiometry (DEXA), Kröger et al. (Reference Kröger, Bartle, West, Purchas and Devine2006) reported a moderate accuracy in the estimation of tenderness of steaks (R 2 = 0.69). Near infrared reflectance spectroscopy has also been used with some success to predict MQ traits in lamb meat samples (Andrés et al., Reference Andrés, Murray, Navajas, Fisher, Lambe and Bünger2007) and has potential to be used in a non-invasive manner, and so might be more suitable for future online use in an abattoir.
The present study showed that VIA measurements are poor predictors of these two MQ traits, tenderness and IMF. However, additional information and/or technologies could augment the VIA system in the estimation of MQ characteristics. Additional benefits might be possible from improving the VIA system further through calibration against CT measures associated with MQ traits, which still remains to be investigated. To date, genetic selection for MQ characteristics has shown slow progress. This is mainly due to the lack of economic incentives at a commercial level and a lack of suitable online methods for measuring MQ. However, the increasing research into objective technologies to estimate some MQ traits could provide the means to reward the producer for these traits and therefore increase their motivation to improve product quality. In addition, the upcoming information on molecular genetic predictors of MQ traits could also soon be applied in sheep breeding programmes by marker-assisted selective breeding (Gao et al., Reference Gao, Zhang, Hu and Li2007), helping increase the genetic progress made on these traits.
Conclusion
This study has investigated the effects of the TM-QTL on various carcass characteristics of heterozygous crossbred lambs measured by subjective carcass classification and a VIA system. The potential of the VIA system in the estimation of CT muscularity measurements of the loin region and MQ was also evaluated. It has been demonstrated earlier (Macfarlane et al., Reference Macfarlane, Lambe, Bishop, Matika, Rius-Vilarrasa, Mclean, Haresign, Wolf and Bünger2008) that one copy of the TM-QTL has biologically and statistically significant effects on the MLL muscle. However, in practice, the current industry carcass evaluation system for carcass conformation and fat class would not be able to identify an effect of this relatively small magnitude, and so would not reward for the total increase in MLL muscularity gained through the use of the TM-QTL in breeding programmes. The VIA system was shown to have moderate potential in the prediction of loin muscle traits measured by CT, especially for loin muscle volume. This suggests that VIA estimates of CT traits could have the potential to detect differences in loin muscle traits between carcasses from carriers and non-carriers of the TM-QTL in the abattoir. Additionally, other carcass quality measures calculated using VIA information, such as carcass compactness, could provide the means to reward producers for the use of a QTL-enhancing product quality, if the associations between carcass compactness and carcass value are positive.
The fine mapping of QTL affecting growth and carcass composition would allow more precise genotyping, and therefore, provide more reliable identification of TM-QTL carriers and non-carriers and increase the statistical power of the analyses to evaluate the effects of this QTL.
In summary, subjective evaluation of carcass conformation has only limited potential to identify increased muscling due to the effect of one copy of the TM-QTL. VIA was shown to have increased capabilities in the estimation of MLL muscling through calibration against CT measures. Additionally, carcass compactness calculated using VIA information has been shown to be associated with the effect of the TM-QTL. Further analyses will help to validate the associations between VIA and CT carcass traits and provide more information of the value of the TM-QTL for the UK sheep industry.
Acknowledgements
The authors are grateful to sponsors and the partners of this LINK project (LK0670; Sustainable Livestock Production programme), English Beef and Lamb Executive (EBLEX), Hybu Cig Cymru (HCC), Quality Meat Scotland (QMS), the Livestock and Meat Commission for Northern Ireland (LMCNI), Scottish Association of Meat Wholesalers, Catapult Genetics Pfizer, Innovis Genetics Ltd, BBSRC (BB/E018963/1), Defra and also to MLC, Genesis Faraday and the Worshipful Company of Woolmen for financial support to ERV. We also thank the companies E + V Technology GmbH and Welsh Country Food, as well as the University of Bristol for their technical support and collaboration in the project. The assistance provided by the staff of SAC for their collaboration and technical support of the project is gratefully acknowledged.