I. INTRODUCTION
Crystallinity, e.g., lattice strain, is important in tailoring the functional properties of nanowires (NWs) and can be controlled by modifying surface stresses.Reference Tang and Ouyang1 Thus, exploration in the field of surface stress engineering can advance the development of NW-based devices; in the advanced thin-film transistor, compressive or tensile stresses have been used to enhance electron or hole mobilities, respectively.Reference Duan, Sabiryanov, Liu and Mei2, Reference Kang, Choi, Hussain, Wang, Suh, Floresca, Kim, Kim, Lee and Jammy3 Because the surface layers are relaxed and sometimes reconstructed with the spill-out of surface electrons and changes in surface chemical bondings,Reference Needs4–Reference Pauling6 the size-dependent properties of nanoscale materials are seriously influenced by the surfaces and are more effectively affected with the surface-to-volume ratio increasing.
So far, through experiments and theoretical analyses, it has been demonstrated that lattice deformations in nanoparticles and NWs are induced by surface stresses and can result in phase transformation.Reference Diao, Gall and Dunn7, Reference Park8 Surface stresses are caused by imperfections of the coordination number at the surfaces. The bond-order-length-strength model, which is based on such imperfections, has successfully described the size-dependent properties of nanoscale materials, such as lattice contraction, cohesive energy, and strengthening.Reference Sun9 Lattice contractions in various metal nanoparticles and NWs were experimentally observedReference Liang, Li and Jiang10–Reference Lamber, Wetjen and Jaeger16 and theoretically predicted,Reference Jiang, Liang and Zhao17 whereas the lattice dilatations were generated by the excess free volume at grain boundaries for nanocrystalline materials with high grain boundary-to-volume ratios.Reference Birringer, Hoffmann and Zimmer18, Reference Banerjee, Sperling, Thompson, Fraser, Bose and Ayyub19
Recently, we reported that single crystalline β-Sn NWs were spontaneously elongated along the [100]-longitudinal direction.Reference Shin, Yu, Song and Park20 This differs from the general behavior of lattice contraction in nanoparticles, such as Sn, Bi, Cu, Ni, and Pd elements.Reference Liang, Li and Jiang10, Reference Yu, Liu, Zhang and Hu14–Reference Lamber, Wetjen and Jaeger16 More recently, it was found that lattice dilatation was ascribed to the anisotropic surface stress and growth stress.Reference Kim, Song and Lee21, Reference Shin, Yu, Song and Kim22 Therefore, we were motivated to investigate the effects of microstructures on the lattice parameter of Sn NWs with various NW radii. Currently, there are several template-based deposition methods of Sn nanomaterials.Reference Djenizian, Hanzu, Premchand, Vacandio and Knauth23, Reference Tian, Wang, Kurtz, Liu, Chen, Mayer and Mallouk24 In this study, we show that the microstructures of Sn NWs can be controlled using the electrodeposition conditions and heat treatment. Interestingly, the lattice parameter of Sn NWs can be tailored by varying the NW microstructure and also the NW radius in the nanometer scale.
II. EXPERIMENTAL PROCEDURE
Anodic aluminum oxide (AAO) templates (∼6 μm thick) were prepared on an aluminum substrate (99.99%, Johnson Matthey Co., Ward Hill, MA) by a two-step anodization process in electrolytes of sulfuric acid (1.5 M) at the anodic potentials (E a) of 15 and 23 V and oxalic acid (0.3 M) at E a of 40 V. The as-prepared templates had pore radii of r p = 7.0 ± 0.5 and 8.0 ± 0.9 nm for sulfuric acid, and r p = 13.0 ± 2.2 nm for oxalic acid, respectively. Here, they are called sulfuric AAO and oxalic AAO templates, respectively. Using a pore widening process at 303 K, AAO templates with final radii of r p = 7.0 ± 0.5, 8.0 ± 0.9, 9.0 ± 1.2, 12.0 ± 1.9, 13.0 ± 2.2, 18.0 ± 2.0, 25.0 ± 1.7, and 35.0 ± 1.5 nm were obtained by varying the pore-widening time. More detailed descriptions of these processes can be found in previous works.Reference Shin, Yu, Song and Park20, Reference Shin, Yu and Song25 Sn NWs were electrochemically deposited into the templates in an aqueous electrolyte (18.8 g/L SnSO4 and 25 g/L H3BO3, pH 1.8) using a homemade two-electrode system composed of a dual DC power supply (Agilent E3620A, Agilent Technologies, Santa Clara, CA) and a function generator (Agilent 33220A), replicating the pores of the AAO templates at room temperature. To deposit Sn NWs with diverse microstructures, the cathodic potential (E c) of a sine wave form with a frequency of 100 Hz and a counter potential of 0 V was set to be −10 and −6 V, respectively. The length of Sn NWs was controlled within a range of 2–3 μm with a deposition rate of 2 μm/min. The single crystalline Sn NWs were heated up to 573 K under a vacuum and were cooled down to obtain the bamboo structures. Field emission scanning electron microscopy (FE-SEM, Hitachi S-4800, Hitachi High-Technologies, Tokyo, Japan) observation was used to measure the lengths and radii of the NWs. The NW lengths were controlled within a range of 2–3 μm. The longitudinally deformed lattice parameters (a NW) in the a-axis direction of the NWs, which were vertically grown on the substrates, were determined from the average values among the three measurements of (400) plane diffraction angles from the Bragg condition for the tetragonal crystal structure using x-ray diffractometry (Cu-Kα radiation, θ–2θ scan, Bruker D8).Reference Shin, Yu, Song and Park20, Reference Shin, Yu, Song and Kim22 The lattice deformation was calculated to be ε = [a NW−a b]/a b for the bulk lattice parameter (a b) of Sn (JCPDS #04-0673). To calibrate the measured diffraction angles of the Sn (400) plane, the (400) plane diffraction peak (2θ B = 69.132°) of Si powder (NIST SRM 640c) was simultaneously measured as an internal standard, as shown in the inset of Fig. 1. The Bragg diffraction angles were determined by fitting the experimental data via the pseudo-Voigt function. High-resolution transmission electron microscopy (HRTEM, JEM-2100F[HR]) was used to analyze the crystalline structures with the aid of electron diffraction, the fast Fourier transform (FFT), and HRTEM images.
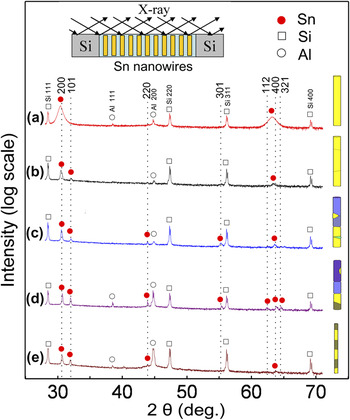
X-ray diffraction (XRD) patterns of (a) single crystalline Sn nanowires (NWs) of r NW = 18 nm that were deposited into oxalic anodic aluminum oxide (AAO) templates under a cathodic potential of E c = −10 V, (b) single crystalline Sn NWs of r NW = 20 nm that were deposited into sulfuric AAO templates under a cathodic potential of E c = −6 V, (c) granular Sn NWs with r NW = 25 nm that were deposited into oxalic AAO templates under a cathodic potential of E c = −6 V, (d) randomly orienting bamboo Sn NWs with r NW = 25 nm, and (e) preferentially orienting bamboo Sn NWs with r NW = 9 nm after heat treating single crystalline Sn NWs. The upper inset shows a schematic where the x-ray beam was incident on the NWs and Si powders. The right insets show schematic of the microstructure-controlled NWs corresponding to the XRD patterns, respectively. The yellow color indicates a grain with the [200]-longitudinal direction and the other colors indicate grains with other orientations. The dashed lines denote each Bragg diffraction angle (2θ) of bulk β-Sn crystal.

III. RESULTS AND DISCUSSION
Figure 1 shows typical x-ray diffraction (XRD) patterns of Sn NWs with single crystalline [Figs. 1(a) and 1(b)], granular [Fig. 1(c)], and bamboo structures [Figs. 1(d) and 1(e)]. Schematic of the microstructures is shown on the right sides of the XRD patterns. For the Sn NWs of r NW = 18 nm deposited into oxalic AAO templates under a cathodic potential (E c = −10 V), only the (200) and (400) peaks of Sn NWs are found, as shown in Fig. 1(a). This indicates that the NWs have a single crystalline structure grown along the [100]-longitudinal direction. The Si peaks are included as an internal reference to calibrate the Bragg diffraction angles.
Figure 1(b) shows the XRD pattern of Sn NWs with r NW = 20 nm that are deposited under E c = −6 V into sulfuric AAO templates. The strong XRD peak of the (200) plane and weak peak of the (101) plane indicate that the NWs have a strong preferred orientation in the [100]-direction. Next, TEM analysis shows that the NWs are composed of several grains with small angle tilt boundaries, as shown in the schematic on the right side of Fig. 1(b).
In Fig. 1(c), when the Sn NWs with r NW = 25 nm are deposited under E c = −6 V into oxalic AAO templates, weak XRD peaks of the (101), (220), and (301) planes as well as strong peaks of the (200) and (400) planes are found, indicating a weak polycrystalline character, i.e., weak randomness of grain orientation. This means that the NWs are composed of both randomly orienting grains and longitudinally [100]-orienting grains, unlike the single crystalline NWs shown in Fig. 1(a). Subsequent TEM analyses show that the NWs include the granular structure locally through wire thickness, as shown in the schematic on the right side of Fig. 1(c). Hereafter, the NW structure is termed a granular structure.
After thick single crystalline Sn NWs (r NW = 25 nm) are heated up to 573 K, they show various XRD peaks of the (200), (101), (220), (301), (112), (400), and (321) planes, in sequence, as shown in Fig. 1(d). This indicates that they have a randomly orienting polycrystalline structure. In subsequent TEM analyses, the NWs are shown to be composed of bamboo-like grains that are randomly oriented, as shown on the right side of Fig. 1(d). Hereafter, this is termed a randomly orienting bamboo structure.
After the heat treatment of thin single crystalline Sn NWs (r NW = 9 nm), only the several diffraction peaks of the (200), (101), (220), and (400) planes appear, as shown in Fig. 1(e). This indicates a weaker polycrystalline character of the bamboo structure than that of a randomly orienting bamboo structure, as shown in Fig. 1(d). Hereafter, these are termed as preferentially orienting bamboo NWs, as schematically drawn on the right side of Fig. 1(e). Comparing Fig. 1(d) with Fig. 1(e), it is clear that the thin preferentially orienting bamboo NWs have less polycrystalline character than the thick randomly orienting bamboo NWs.
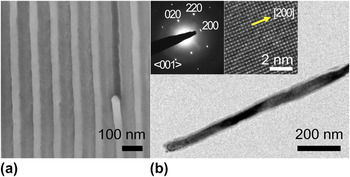
As shown in Fig. 2(a), Sn NWs grew replicating the AAO template and their diameters could be controlled by changing the pore diameters of the templates. Figure 2(b) shows a typical bright-field TEM image of a single crystalline Sn NW. In the inset of Fig. 2(b), the selected area electron diffraction pattern and HRTEM image, which are obtained for the whole NW length, indicate that the Sn NW (r NW = 18 nm) has a single crystalline structure with the [100]-longitudinal direction. This is consistent with the previous report that the [100]-oriented growth is favorable in view of energy minimizationReference Kim, Song and Lee21 and Sn NWs are electrochemically grown to have a single crystalline structure in the [100]-longitudinal direction.Reference Tian, Wang, Kurtz, Liu, Chen, Mayer and Mallouk24
Typical (a) Field emission-scanning electron microscopy and (b) Transmission electron microscopy (TEM) images of single crystalline Sn NWs with r NW = 18 nm. In (a), the lighter and darker images denote the Sn NWs and AAO template, respectively. The selected area electron diffraction pattern and high-resolution TEM (HRTEM) image are shown in the insets of Fig. 2(b).

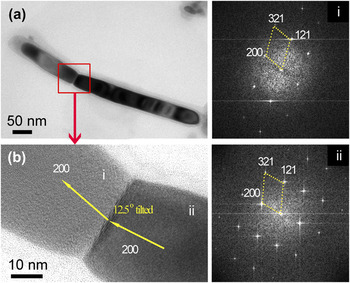
Figure 3(a) shows the typical bright-field TEM image of the Sn NW (r NW = 20 nm) deposited under E c = −6 V into sulfuric AAO templates. The NW is composed of two long grains with lengths of about 180 and 380 nm, respectively. The NW was probably broken during the preparation of the TEM sample. An HRTEM image of the grain boundary region is shown in Fig. 3(b). Figures 3(i) and 3(ii) show the FFT images corresponding to the two grains denoted as i and ii in the HRTEM image, respectively. Note that the grains have the [100]-longitudinal direction, as indexed in the FFT images, and the [100]-directions of the two grains are tilted away from each other by an angle of 12.5°, as shown by the arrows in Fig. 3(b). Considering the XRD and TEM results of Figs. 1(b) and 3(b), it is presumed that the NWs are composed of long grains with low-angle tilt boundaries.
(a) Bright-field TEM image and (b) HRTEM image of single crystalline Sn NWs (r NW = 20 nm) with a low-angle tilt boundary. The fast Fourier transform (FFT) images corresponding to the grains denoted as i and ii in the HRTEM image are shown on the right, respectively.

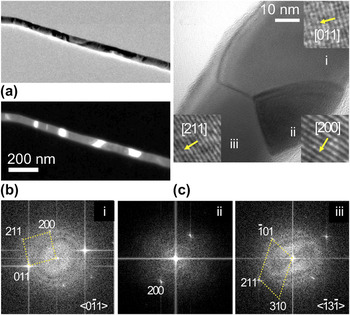
Figures 4(a) and 4(b) show the bright-field and dark-field TEM images, respectively, for the granular structure of Sn NW (r NW = 25 nm). The NW is composed of different grains along the wire length. Figure 4(c) is the typical HRTEM image of a granular structure composed of three grains denoted as i, ii, and iii, of which the crystal orientations are indexed to be [011], [200], and [211], as shown in the FFT images of Figs. 4(i)–4(iii), respectively. The granular structure with a random crystal orientation is locally formed through the thickness, as shown in Fig. 4(c). This agrees with the XRD result of a weak polycrystalline character, as shown in Fig. 1(c), and it should be noted that the granular NWs have, for the most part, a strong [100]-preferred orientation of NW in the longitudinal direction, in consideration of the XRD result.
(a) Bright-field TEM, (b) dark-field TEM, and (c) HRTEM images of granular Sn NWs with r NW = 25 nm. The FFT images corresponding to each grain denoted as i, ii, and iii in the HRTEM image are shown in the lower insets, respectively.

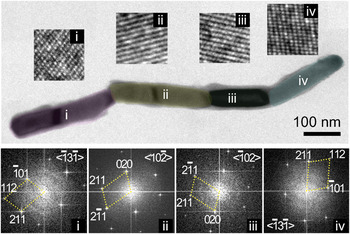
Figure 5 shows typical HRTEM images of the thick randomly orienting bamboo Sn NW (r NW = 25 nm). It is noted that the NW is transformed to have a bamboo-like structure composed of bamboo grains (denoted as i, ii, iii, and iv) with the different crystal orientations of [112], [211], [211], and [112] in the longitudinal direction, as shown in the insets of Figs. 5(i)–5(iv), respectively. Here, the ii and iii grains have a twin boundary with a twin angle of 26°, as shown in the FFT images of Figs. 5(ii) and 5(iii). The average longitudinal length (h) of the bamboo grains is about 232 ± 64 nm, which is in a good agreement with the theoretical prediction (225 nm) of h ∼9r NW.Reference Shin, Yu and Song25 The formation of bamboo-like structure is associated with the fragmentation of long Sn NWs into short nanorods under a confinement of the template.Reference Shin, Yu and Song25 These bamboo-like structures may be an intermediate stage prior to the complete fragmentation of the NWs into short nanorods. Further studies are needed to clarify the mechanism of bamboo-like structure formation.
Typical HRTEM images of randomly orienting bamboo Sn NWs with r NW = 25 nm. The magnified lattice images and FFT images corresponding to each bamboo grain denoted as i, ii, iii, and iv are shown in the upper and lower insets, respectively.

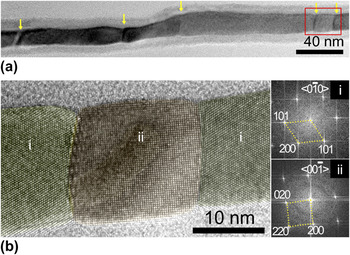
For thin Sn NWs (r NW = 9 nm), heat treatment leads to the formation of a preferentially orienting bamboo structure, as shown in Fig. 6. The average longitudinal length (h) of the bamboo grains is measured to be about 79 ± 48 nm, which is comparable to the theoretical prediction (81 nm) of h ∼9r NW.Reference Shin, Yu and Song25Figure 6(b) shows the HRTEM image of the marked square area in Fig. 6(a). The FFT images corresponding to the bamboo grains denoted as i and ii show that the preferentially oriented bamboo NW is alternately composed of grains with longitudinal orientations of [101] and [200], respectively. These thin polycrystalline NWs still have some longitudinally [100]-preferred orientation according to the XRD result that the thin wires [Fig. 1(e)] have more texture than the thick ones [Fig. 1(d)].
(a) Bright-field TEM image of preferentially orienting bamboo Sn NWs with r NW = 9 nm at lower magnification. The boundaries between bamboo grains are denoted by yellow arrows. (b) Magnified HRTEM image of the squared marking area (in red) in (a). The right insets in (b) show the FFT images corresponding to the grains denoted as i and ii, respectively.

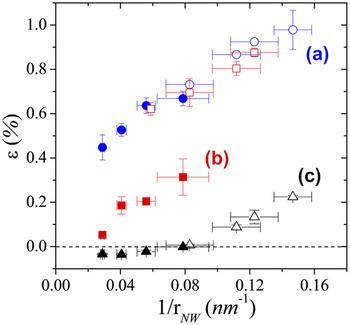
Figure 7 shows the variations of a-axis lattice strain (a NW) in the longitudinal direction for various microstructures and radii of Sn NWs. For the single crystal structure shown in Fig. 7(a), the lattice strains (ε) increase with the reciprocal radius (1/r NW) and reach 1.0% at 1/r NW = 0.15 nm−1. This means that the a-axis lattice parameter of the NW increases above that of bulk Sn with a decreasing wire radius. Figure 7(b) shows that the size-dependent lattice strains in the range of 1/r < 0.08 nm−1 are about 40% smaller than those shown in Fig. 7(a), as indicated by XRD and TEM results. This suggests that the size-dependent lattice strains of granular Sn NWs are smaller than those of single crystalline Sn NWs. When the Sn NW has a randomly orienting bamboo structure, the lattice strains (solid triangles) are negative in the range of 1/r NW < 0.1 nm−1. This means that the longitudinal lattice parameters of the NWs are less than the bulk lattice parameter, and the longitudinal lattice parameters (open triangles) increase again for the thinner preferentially orienting bamboo structure (1/r NW > 0.1 nm−1). The lattice contractions in the randomly orienting bamboo structure is related to the strong polycrystalline character of the randomly orienting grains, as shown in the XRD and TEM results of Figs. 1(d) and 5, whereas the re-emergence of the lattice expansions in the range of 1/r NW > 0.1 nm is related to the less randomness of the preferentially orienting grains, as compared in the XRD and TEM results.
Variations of longitudinal lattice strain (ε) in the [100] direction with the NW radii and NW microstructures: (a) single crystalline, (b) granular, and (c) bamboo structures. Solid and open circles: single crystal NWs deposited at E c = −10 V; open squares: single crystal NWs with low-angle tilt boundaries deposited at E c = −6 V; solid squares: granular NWs deposited at E c = −6 V; and triangles: Sn NWs after heat treating at 573 K. Solid and open symbols denote the NWs deposited into oxalic and sulfuric AAO templates, respectively.

In Fig. 7(a), the two lattice strains (open circles and solid circles) of the NWs deposited into sulfuric AAO and oxalic AAO templates at E c = −10 V, respectively, are in good agreement with each other around 1/r NW = 0.08 nm−1, indicating that the template types had no effects on the lattice strain behavior. Additionally, the heat treatment also seems not to influence the lattice strain behaviors of the NWs within the two kinds templates because the lattice strains (open triangles and solid triangles) closely coincide with each other around 1/r NW = 0.08 nm−1, as shown in Fig. 7(c). However, despite the same reduction potential of E c = −6 V, the size-dependent lattice behavior (open squares) of the NWs deposited into sulfuric AAO templates deviated from that (solid squares) of the NWs deposited into oxalic AAO templates with the wire radius decreasing because the former ones have single crystal structure or low-angle boundaries (Fig. 3), whereas the latter ones have granular structure (Fig. 4). This indicates that the template types can affect the microstructure of Sn NWs for the reduction potential of E c = −6 V, although the reason is not clear at the moment. It is presumed that the nucleation and growth mechanism are affected by the surface chemistry of the AAO templates, as discussed in the literature.Reference Luo, Yang, Liang and Zhi26
It is noted that the lattice strains (open squares) of the NWs deposited into the sulfuric AAO templates under E c = −6 V coincide with those (solid circles and open circles) of the NWs deposited into oxalic AAO and sulfuric AAO templates under E c = −10 V in the range of 1/r NW = 0.06–0.12 nm−1. This, therefore, means that the lattice deformation of Sn NWs is determined by the microstructure as well as the radius, even though the reduction potentials and template types influence the lattice strain behavior under consideration, as shown in Figs. 7(a) and 7(b).
The lattice deformations of nanoparticles and NWs are known to be induced by surface stresses that are dependent on crystal orientation.Reference Needs4, Reference Lamber, Wetjen and Jaeger16, Reference Pushpa, Waghmare and Narasimhan27–Reference Feibelman30 Recently, it was reported that the surface stresses of single crystal Sn with a tetragonal structure are strongly anisotropic and lead to the elongation of NWs in the [100]-longitudinal direction.Reference Kim, Song and Lee21 More recently, it was found that the lattice stains of single crystalline Sn NWs are composed of surface stress-induced strain and growth strain.Reference Shin, Yu, Song and Kim22 Therefore, when the NWs are composed of randomly orienting grains, the anisotropy of surface stress on the NW surface effectively decreases and the elongation is reduced. For granular Sn NWs, which locally have several granular regions with random crystal orientations, the effective surface stresses on surfaces tend to be less anisotropic and the [100]-longitudinal lattice elongation decreases. Although it is difficult to know to what extent the anisotropy of surface stress is reduced, it is evident that the more randomly each grain is oriented, the weaker the anisotropy of the effective surface stresses become. Thus, when the grains are entirely randomly oriented, lattice contraction can occur in the longitudinal direction. Indeed, in Fig. 7(c), the longitudinal lattice contraction occurs, due to the randomly oriented bamboo structure, in the range of 1/r NW ≤ 0.06 nm−1 because the anisotropy of effective surface stresses is significantly reduced to the level of a polycrystalline structure. This agrees with the previous results on polycrystalline Sn nanoparticles that the a- and c-axis lattices contract more with the shrinkage of their radii in the similar radius range of 4.5–17 nm.Reference Yu, Liu, Zhang and Hu14
Currently, it is known that the interface stress of grain boundaries in nanocrystalline materials is significant due to the excess free volume at the boundaries, e.g., interface stress of 1.2 N/m for the high-angle grain boundaries in Pd,Reference Birringer, Hoffmann and Zimmer18 and the grain boundaries can lead to the lattice expansion of the nanocrystalline materials, e.g., about 5% expansion for Nb thin films with a grain size of 5 nm, due to the stress field related to the vacancies at the boundaries.Reference Banerjee, Sperling, Thompson, Fraser, Bose and Ayyub19 Thus, it can be argued that the lattice expansions of polycrystalline bamboo NWs shown in Figs. 7(b) and 7(c) might be related to the grain boundaries rather than the anisotropic surface stresses. It should be noted that the NW surfaces neighboring the grain boundaries have convex-outward surface boundaries, as shown in the HRTEM images of Figs. 3–6. This indicates that the interface stresses at the grain boundaries of Sn NWs, which are significant and comparable to the surface stresses, lead to lattice contraction. In the case of polycrystalline bamboo Sn NWs, the interface stresses at the bamboo grain boundaries contribute more to lattice contraction with the grain size decreasing because the interface-to-volume ratio increases. In contrast, as the surface-to-volume ratio is much larger than the interface-to-volume ratio, the lattice deformation behavior of the NWs is mainly governed by the surface stresses. For example, when a cylindrical NW with a length of 1 μm and radius of 9 nm has nine grain boundaries of bamboo structure, i.e., bamboo length of about 100 nm, the interface-to-volume ratio of about 0.01 nm−1 is much smaller than the surface-to-volume ratio of about 0.22 nm−1. In this case, the lattice expansion would occur due to the dominant anisotropic surface stresses.
When the reciprocal radius increases in the range of 1/r NW > 0.08 nm−1, as shown in Fig. 7(c), the longitudinal lattice expansion appears again at a rate of 3.7%/(nm−1) because the randomness of grain orientation in a preferentially orienting bamboo structure is weaker than that of the randomly oriented bamboo structure, as comparably seen in Figs. 1(d) and 1(e). The weaker the randomness is with the size shrinkage of NWs, the stronger the anisotropy of the effective surface stress is induced and then the more longitudinal lattice dilatations (open triangles) are caused, as shown in Fig. 7(c).
IV. CONCLUSIONS
The microstructures of Sn NWs were controlled to be single-crystal structure, granular structure, and bamboo structure. All the microstructure-controlled Sn NWs show the size-dependent lattice deformation in the range of r NW = 7–35 nm. The size-dependent lattice dilatation and contraction in the longitudinal direction of the microstructure-controlled Sn NWs originate from the interplay of the wire radius in the nanometer scale and the microstructure-dependent effective surface stresses. For the single crystal, granular, and preferentially orienting bamboo structures of the NWs, the longitudinal lattice parameter increases with a decrease in the wire radius, while the randomly orienting bamboo structure shows the lattice contraction for r NW > 13 nm and lattice dilatation for r NW < 13 nm. The microstructure-dependent lattice behavior is ascribed to the fact that the effective anisotropy of surface stresses on the NW surfaces is gradually reduced by the increasing orientation randomness of grains on the NW surfaces for the single crystal, granular, and bamboo structures in sequence. The lattice behaviors of microstructure-controlled Sn NWs are effective in the nanometer scale due to the high surface-to-volume ratio. This study can be used for strain engineering of functional NWs used in NW-based devices via controlling the wire radii and the effective surface stresses.
ACKNOWLEDGMENTS
This research was supported by Basic Science Research Program through the National Research Foundation of Korea (NRF) funded by the Ministry of Education, Science and Technology (MEST) (2010-0000862) and partly by Future-based Technology Development Program (Nano Fields) through the NRF funded by the MEST (Grant No. 20100029332).