



1. Introduction
Since their discovery, globular clusters (GCs) have been regarded as the simplest dynamic systems with a spherically symmetric structure and uniform chemical composition. The age of globular clusters is comparable to that of the Universe, and their formation history is inextricably linked to the formation of galaxies. Over the past decades, photometric and spectroscopic studies have revealed the presence of multiple stellar populations (MSP), primarily characterized by internal variations in light-element abundances (e.g., Bastian and Lardo Reference Bastian and Lardo2018; Gratton et al. Reference Gratton, Bragaglia, Carretta, D’Orazi, Lucatello and Sollima2019, and references therein). Despite the great efforts of many theoretical and observational groups, the formation of MSPs in globular clusters is still a mystery. Observations, both spectroscopic and photometric, provide the following information:
-
• In massive clusters, some stars have different abundances of light elements: C, O, sometimes Mg are depleted, and Y, N, Na, sometimes Al are enhanced. Abundances are correlated or anti-correlated. This indicates a high-temperature CNO cycle;
-
• There is a very small Fe spread allowed (0.1 dex);
-
• There is practically no time spread between populations. At most about a hundred Myr;
-
• Enriched population (2P) is centrally concentrated, but there are some exceptions;
-
• MSPs are clearly detected in massive, larger than a few
 $10^4 M_{\odot}$
, and old (older than about 2 Gyr) clusters, and are observed not only in the Milky Way (MW);
-
• Fraction of 2P increases with cluster mass, may increase with cluster age.

From a theoretical point of view, the above observational facts indicate that:
-
• The light-element abundance variations in MSPs most likely originate from hot hydrogen burning (
$\approx 70$
MK), but not from helium burning; -
• Formation of MSP is connected with dense cluster environment - abundance trends essentially are not visible in the field population;
-
• Gas pollution occurs practically at the time of cluster formation - very small observed age spread;
-
• It seems that there are no special conditions needed in clusters, except cluster mass, to form MSP.

Several scenarios have been proposed to explain the emergence and continued evolution of MSPs. These models can be divided into two groups. The first group, in which the formation of an 2P is shifted in time relative to the pristine population (1P) and requires the re-accretion of the pristine gas by the GC and its mixing with matter ejected by Asymptotic Giant Branch (AGB) stars, belongs to the AGB scenario. The second group belongs to models in which 2P is formed at virtually the same time as 1P and does not require the re-accretion of gas by the GC. Matter ejected from massive stars and binary systems mixes with residual primordial gas. These scenarios include: interacting massive binaries, fast-rotating massive stars, early disk accretion, very massive stars, nucleosynthesis in accretion disks around stellar-mass black holes, and the recently renewed single-binary composite scenario. As pointed out in the review paper by Bastian and Lardo (Reference Bastian and Lardo2018), no scenario can explain a significant number of observational facts. In this work, we focus on the AGB scenario, as it is the framework for the simulations performed with the MOCCA code.
In the AGB scenario, once the residual gas from the formation of the 1P is expelled, the cluster remains near the original gas cloud. After some time, this gas is re-accreted onto the cluster, where it accumulates in the cluster center and mixes with material ejected from AGB star envelopes. This mixture is crucial for producing the observed light-element correlations and anti-correlations. Following a time delay, the 2P forms from the polluted gas accumulated in the cluster center.
In the next section, we present results from MOCCA simulations designed to test how environmental effects, gas re-accretion onto GCs, and the time delay of 2P formation influence the evolution of stellar populations. Detailed descriptions of the code and initial conditions are provided in Giersz et al. (Reference Giersz, Askar, Hypki, Hong, Wiktorowicz and Hellström2025a). A total of about 200 simulations were performed, with most models starting as tidally filling (TF).
2. Results
In this section, we analyze the impact of gas re-accretion, cluster migration, and some of the individual MSP and global cluster parameters on the evolution of the cluster mass, half-mass radius (
 $\mathrm{R}_\mathrm{h}$
), and ratio between the number of 2P stars to the total number of stars (
 $\mathrm{N}_2/\mathrm{N}_\mathrm{tot}$
).
2.1 Gas re-accretion
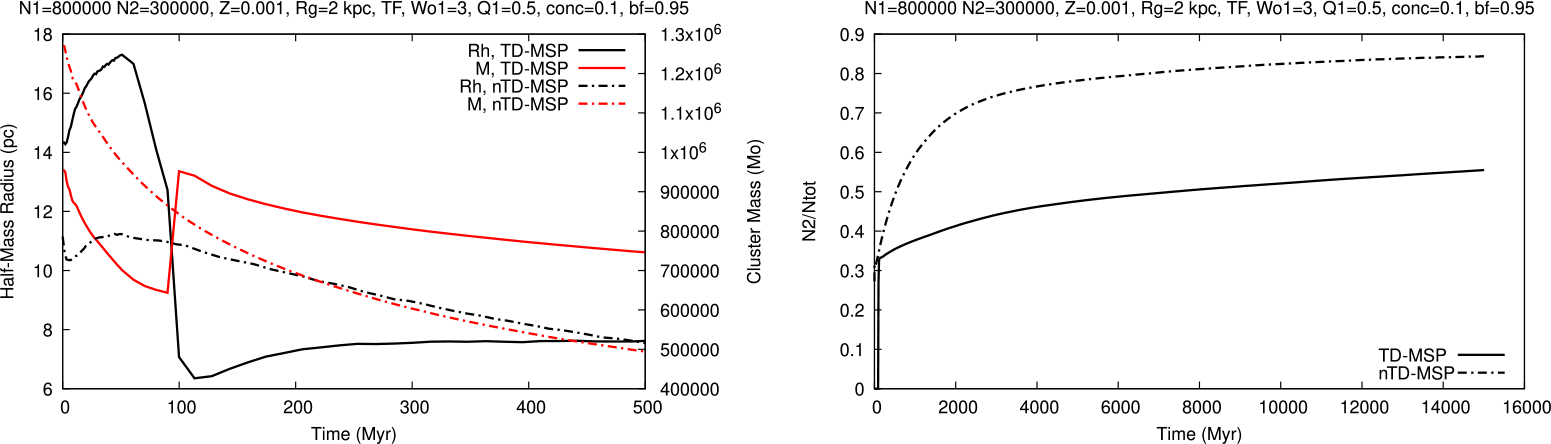
In the AGB scenario, re-accretion of gas on the cluster is required. We know that the ejection of gas from the cluster leads to a decrease in the cluster mass, cluster expansion, and half-mass radius growth. Thus, mass accretion should lead to an increase in the cluster’s mass, its central concentration, and a decrease in the
 $\mathrm{R}_\mathrm{h}$
. The left panel of Figure 1 shows this behavior for the model with time delay formation of 2P stars (TD-MSP). In contrast, in the model where 2P stars form simultaneously with 1P (nTD-MSP), the evolution is driven only by stellar-evolution mass loss and star escapes caused by the tidal field. After gas re-accretion, the cluster collapses, transitioning from TF to under-filling (nTF). This transition leads to a significant slowdown in the growth of the
 $\mathrm{N}_2/\mathrm{N}_\mathrm{tot}$
ratio, as shown in the right panel of Figure 1.
Left panel: Evolution of
 $\mathrm{R}_\mathrm{h}$
for nTD-MSP model, and for TD-MSP model, and evolution of the total cluster mass for nTD-MSP model, and TD-MSP model. Right panel: Evolution of the ratio
 $\mathrm{N}_2/\mathrm{N}_\mathrm{tot}$
for the nTD-MSP model, and TD-MSP model. The global cluster parameters are listed at the top of each panel:
 $\mathrm{N}_{1}$
- number of 1P objects,
 $\mathrm{N}_{2}$
- number of 2P objects, Z - metallicity,
 $\mathrm{R}_\mathrm{g}$
- galactocentric distance (size of the circular orbit), TF - tidally filling 1P,
 $\mathrm{W}_\mathrm{o1}$
- King parameter for 1P, conc - concentration parameter (
 $\mathrm{conc}_\mathrm{pop}=R_{h2}/R_{h1}$
), bf - binary fraction,
 $\mathrm{Q}_\mathrm{1}$
- virial ratio for 1P.

Figure 1 Long description
Panel A: The left graph is a line graph showing the evolution of the half-mass radius (R_h) and total cluster mass (M) over time for two models: nTD-MSP and TD-MSP. The x-axis represents time in millions of years (Myr), while the y-axis on the left shows the half-mass radius in parsecs (pc) and the y-axis on the right shows the cluster mass in solar masses (Mo). The black lines represent the TD-MSP model, and the red lines represent the nTD-MSP model. Panel B: The right graph is a line graph showing the evolution of the ratio N2/Ntot over time for the nTD-MSP and TD-MSP models. The x-axis represents time in millions of years (Myr), and the y-axis shows the ratio N2/Ntot. The black line represents the TD-MSP model, and the dashed black line represents the nTD-MSP model.
2.2 Cluster migration
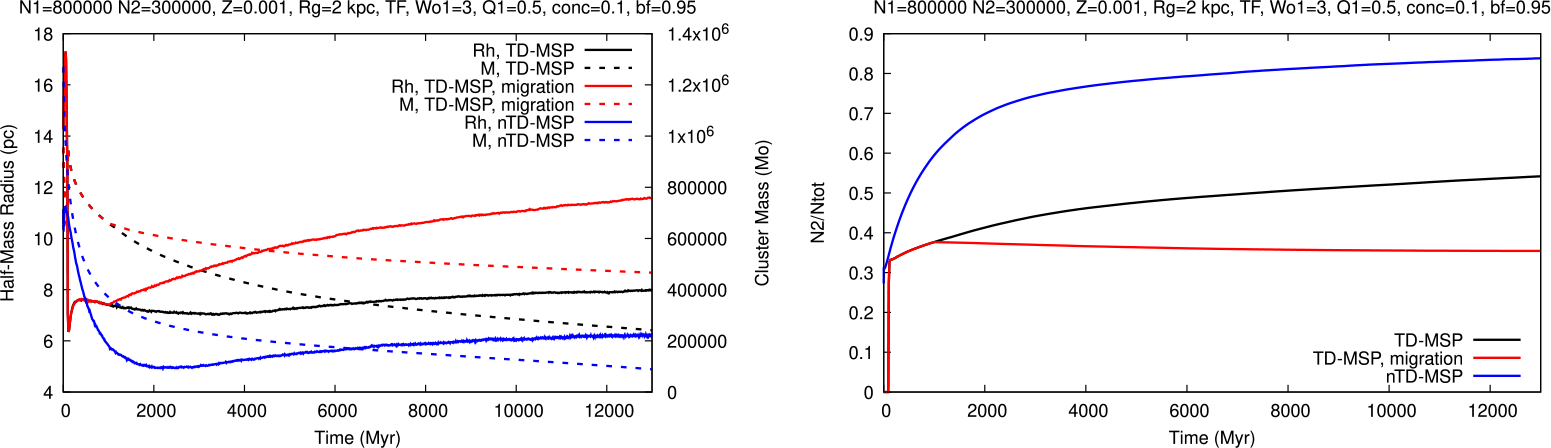
It is known from many papers, e.g. Meng and Gnedin (Reference Meng and Gnedin2022) that as a result of strong changes in the tidal field of the forming galaxy, GCs can migrate further away from the center. Migration to greater distances means that clusters go from TF to nTF very quickly. This leads to a slower loss of cluster mass, an increase in half-mass radius, and virtually a halt in
 $\mathrm{N}_2/\mathrm{N}_\mathrm{tot}$
growth. Indeed, these predictions are confirmed in Figure 2. The left panel shows a significant increase in
 $\mathrm{R}_\mathrm{h}$
and a slower decrease in cluster mass with increasing
 $\mathrm{R}_\mathrm{g}$
. In the right panel, the ratio
 $\mathrm{N}_2/\mathrm{N}_\mathrm{tot}$
is practically constant after increasing the galactocentric distance. The migration of GCs introduces an additional parameter that influences cluster mass,
 $\mathrm{R}_\mathrm{h}$
, and the
 $\mathrm{N}_2/\mathrm{N}_\mathrm{tot}$
ratio.
Left panel: Evolution of
 $\mathrm{R}_\mathrm{h}$
for nTD-MSP model, TD-MSP model, and TD-MSP model with migration, and evolution of the total cluster mass for nTD-MSP model, TD-MSP model, and TD-MSP model with migration. Right panel: Evolution of the ratio
 $\mathrm{N}_2/\mathrm{N}_\mathrm{tot}$
for nTD-MSP model, TD-MSP model, and TD-MSP with migration model. The global cluster parameters are listed at the top of each panel and are the same as for Figure 1.

2.3 1P virial ratio
To achieve a stronger increase in the
 $\mathrm{N}_2/\mathrm{N}_\mathrm{tot}$
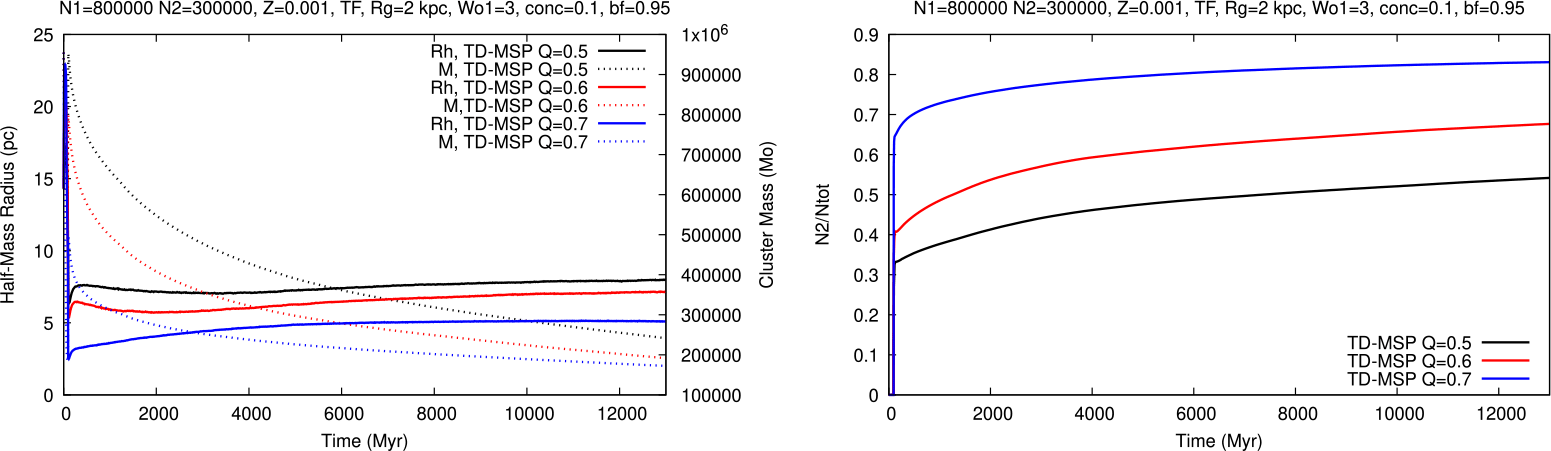
ratio after GC migration and to reproduce the observed values, an additional physical process is required. It is known that the removal of the residual gas after the formation of the 1P is associated with a strong expansion of the cluster and its departure from virial equilibrium (e.g., Banerjee and Kroupa Reference Banerjee and Kroupa2013; Banerjee and Kroupa Reference Banerjee and Kroupa2018). We can therefore assume that the initial model for 1P has
 $\mathrm{Q}_1 \gt 0.5$
. Increasing
 $\mathrm{Q}_{1}$
will lead to a decrease in the mass of the cluster and
 $\mathrm{R}_\mathrm{h}$
and an increase in
 $\mathrm{N}_2/\mathrm{N}_\mathrm{tot}$
, as is clearly seen in the Figure 3. The value of
 $\mathrm{Q}_{1}$
will depend on 1P star formation efficiency (SFE). The smaller SFE, the larger
 $\mathrm{Q}_{1}$
. According to recent works, the amount of cluster expansion due to the residual gas removal is very uncertain and depends on many factors connected with the SFE, cluster structure, environment, and efficiency of the feedback processes (e.g., Farias et al. Reference Farias, Fellhauer, Smith, Domínguez and Dabringhausen2018; Geen et al. Reference Geen, Watson, Rosdahl, Bieri, Klessen and Hennebelle2018; Zamora-Avilés et al. Reference Zamora-Avilés, Ballesteros-Paredes, Hernández, Román-Zúñiga, Lora and Kounkel2019; Krause et al. 2020; Polak et al. Reference Polak, Mac Low, Klessen, Wei Teh, Cournoyer-Cloutier, Andersson, Appel, Tran, Lewis, Wilhelm, Portegies Zwart, Glover, Rieder, Wang and McMillan2024). Therefore, the assumption that initially 1P is out of virial equilibrium and has
 $\mathrm{Q}_1 \gt 0.5$
is plausible.
Left panel: Evolution of
 $\mathrm{R}_\mathrm{h}$
and the cluster total mass for TD-MSP models with different
 $\mathrm{Q}_\mathrm{1}$
. Right panel: Evolution of the ratio
 $\mathrm{N}_2/\mathrm{N}_\mathrm{tot}$
for TD-MSP models with different
 $\mathrm{Q}_\mathrm{1}$
. The global cluster parameters are listed at the top of each panel and are the same as for Figure 1.

2.4 King parameter,
$\mathrm{W}_\mathrm{o1}$

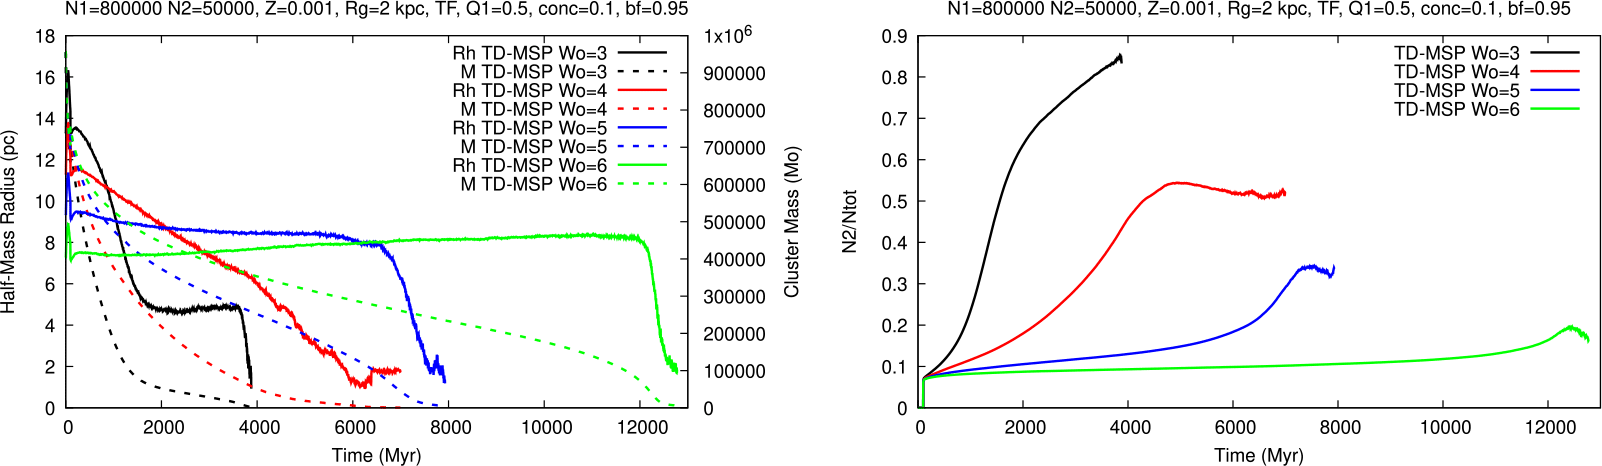
The King parameter for 1P is crucial for the long-term evolution of the cluster and the
 $\mathrm{N}_2/\mathrm{N}_\mathrm{tot}$
ratio. As can be seen from Figure 4 for
 $\mathrm{W}_\mathrm{o1}$
larger than about 5, the
 $\mathrm{N}_{2}/\mathrm{N}_\mathrm{tot}$
ratio does not reach the observed values, and the models become similar to the single population models. The larger
 $\mathrm{W_{o1}},$
the larger GC evolution time scale, and the slower increase of
 $\mathrm{N}_2/\mathrm{N}_\mathrm{tot}$
. This was already pointed out by Vesperini et al. (Reference Vesperini, Hong, Giersz and Hypki2021) and Hypki et al. (Reference Hypki, Giersz, Hong, Leveque, Askar, Belloni and Otulakowska-Hypka2022); Hypki et al. (Reference Hypki, Vesperini, Giersz, Hong, Askar, Otulakowska-Hypka, Hellstrom and Wiktorowicz2025). A very interesting relationship can be observed in the right panel in Figure 4. For models with a small number of 2P stars relative to 1P stars, in the initial phase of cluster evolution, the
 $\mathrm{N}_2/\mathrm{N}_\mathrm{tot}$
ratio practically does not change, but after about 1-2 Gyr it increases rapidly and reaches the values observed for MW GCs. This feature of evolution may help to explain the correlation between the GC mass and the
 $\mathrm{N}_2/\mathrm{N}_\mathrm{tot}$
ratio.
Left panel: Evolution of
 $\mathrm{R}_\mathrm{h}$
and the cluster total mass for TD-MSP models with a different King parameter,
 $\mathrm{W}_\mathrm{o1}$
. Right panel: Evolution of the ratio
 $\mathrm{N}_2/\mathrm{N}_\mathrm{tot}$
for TD-MSP models with a different King parameter,
 $\mathrm{W}_\mathrm{o1}$
. The global cluster parameters are listed at the top of each panel and are the same as for Figure 1.

Figure 4 Long description
Panel A: A line graph shows the evolution of the half-mass radius and cluster total mass over time for TD-MSP models with different King parameters. The x-axis represents time in millions of years (Myr), and the y-axis on the left represents the half-mass radius in parsecs (pc), while the y-axis on the right represents the cluster mass in solar masses (M☉). Multiple lines in different colors and styles indicate different King parameters. Panel B: Another line graph shows the evolution of the ratio of the number of 2P stars to the total number of stars over time for the same models. The x-axis represents time in millions of years (Myr), and the y-axis represents the ratio N2/Ntot. Different colored lines represent different King parameters.
2.5 Galactocentric distance
Another important parameter describing the evolution of MSP is
 $\mathrm{R}_\mathrm{g}$
of the GC. As we can expect for the TF cluster, a larger distance of the GC from the galaxy center results in a larger tidal radius
 $\mathrm{R}_\mathrm{t}$
and
 $\mathrm{R}_\mathrm{h}$
and, consequently, a slower evolution of the cluster. This leads to the dependence, the larger
 $\mathrm{R}_\mathrm{g}$
the larger
 $\mathrm{R}_\mathrm{h}$
and the smaller
 $\mathrm{N}_2/\mathrm{N}_\mathrm{tot}$
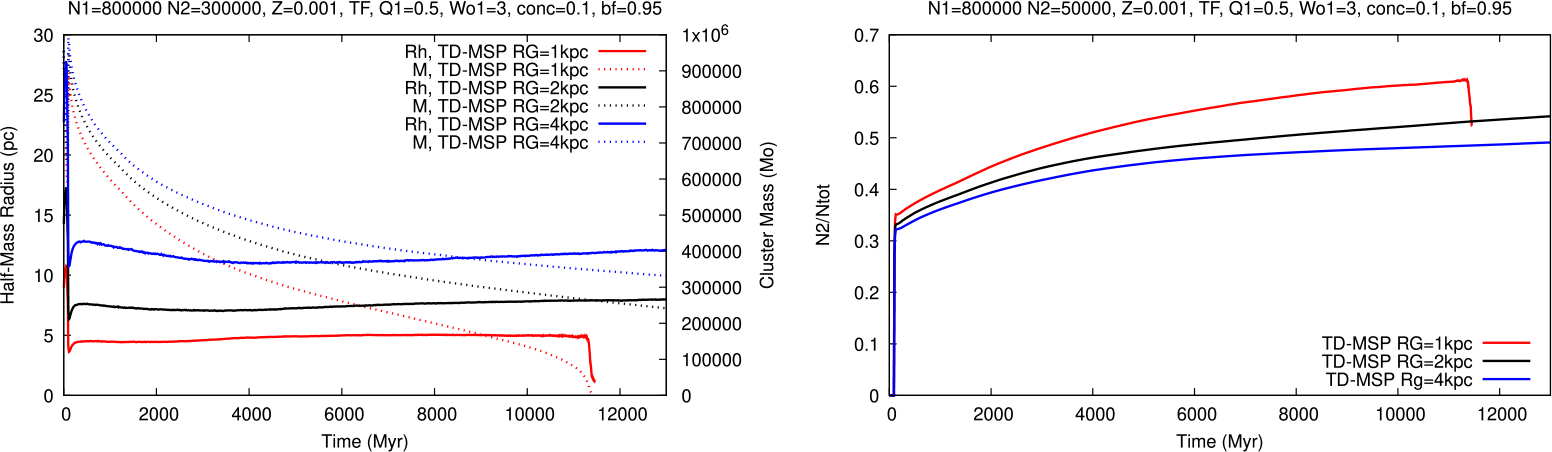
. Indeed, we can observe this type of evolution of global cluster parameters in Figure 5. The cluster with the smallest
 $\mathrm{R}_\mathrm{g}$
is characterized by the smallest
 $\mathrm{R}_\mathrm{h}$
, mass and evolution time, and the largest
 $\mathrm{N}_2/\mathrm{N}_\mathrm{tot}$
ratio. It is important to draw attention to the fact that dependence on
 $\mathrm{R}_\mathrm{g}$
is important from the point of view of MWGC observational parameters. The correlation between
 $\mathrm{R}_\mathrm{g}$
and
 $\mathrm{N}_2/\mathrm{N}_\mathrm{tot}$
is not observed for MWGCs, and it arises from the specific initial conditions adopted in our models. This trend is expected to be strongly blurred - or even erased - during the subsequent evolution of clusters due to environmental effects associated with galaxy assembly.
Left panel: Evolution of
 $\mathrm{R}_\mathrm{h}$
and the cluster total mass for TD-MSP models with different galactocentric distance (
 $\mathrm{R}_\mathrm{g}$
). Right panel: Evolution of the ratio
 $\mathrm{N}_2/\mathrm{N}_\mathrm{tot}$
for TD-MSP models different
 ${R_g}$
. The global cluster parameters are listed at the top of each panel and are the same as for Figure 1.

2.6 Summary of the MOCCA simulations
After a brief presentation of the results obtained with the MOCCA code for models with MSP with delayed 2P formation, it is time to summarize the results and put them in a broader perspective.
The masses of MWGCs are contained in the range of roughly 10^4 to
 $\mathrm{10^6} M_{\odot}$
, the
 $\mathrm{R}_\mathrm{h}$
in the range of about 1 to 10 pc (larger radii on average have ex-situ GCs), and the
 $\mathrm{N}_2/\mathrm{N}_\mathrm{tot}$
ratio in the range of about 0.3 to 0.9. An exceptionally strong constraint on models of MSP formation in GCs is the correlation between the mass of the cluster and the
 $\mathrm{N}_2/\mathrm{N}_\mathrm{tot}$
ratio. The MOCCA simulations provide the following suggestions that may help understand the observational parameters of GCs with MSP in the framework of the AGB scenario:
-
• GCs just after the ejection of the residual gas should be TF or only slightly nTF. This means that they should preferentially form close to the galactic center. Too large
$\mathrm{R}_\mathrm{g}$
means much larger
$\mathrm{R}_\mathrm{t}$
, and it is difficult in this case to form a cluster that is TF; -
• Only models in which the GC is TF or only slightly nTF reproduce
$\mathrm{N}_2/\mathrm{N}_\mathrm{tot}$
ratios within the range observed for Milky Way GCs, provided that initially this ratio was not as large as observed; -
• For newly formed GCs of the same mass, increasing
$\mathrm{R}_\mathrm{g}$
leads to larger
$\mathrm{R}_\mathrm{h}$
and a lower
$\mathrm{N}_2/\mathrm{N}_\mathrm{tot}$
; -
• Models with smaller
$\mathrm{W}_\mathrm{o1}$
guarantee larger values of the
$\mathrm{N}_2/\mathrm{N}_\mathrm{tot}$
ratio. The larger the
$\mathrm{W}_\mathrm{o1}$
the greater the mass and
$\mathrm{R}_\mathrm{h}$
, but too small
$\mathrm{W}_\mathrm{o1}$
will lead to too fast cluster dissolution; -
• The greater the cluster’s departure from virial equilibrium, the greater the
$\mathrm{N}_2/\mathrm{N}_\mathrm{tot}$
ratio. The larger the
$\mathrm{Q}_\mathrm{1}$
the smaller the mass and
$\mathrm{R}_\mathrm{h}$
; -
• Migration of the cluster to larger
$\mathrm{R}_\mathrm{g}$
leads to an increase in present-day cluster mass and
$\mathrm{R}_\mathrm{h}$
. The
$\mathrm{N}_2/\mathrm{N}_\mathrm{tot}$
ratio remains virtually constant after migration.


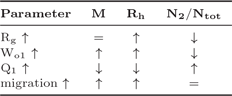
The reaction of the observational parameters to the changes in the global and environmental parameters discussed in the above points is summarized in Table 1.
Response of the observational global cluster parameters to changes in the models of the most important parameters describing the cluster environment and MSPs. The global cluster parameters are: cluster mass,
 $R_h$
, and
 $N_2/N_{tot}$
. The parameters describing the cluster model and MSPs are:
 $\mathrm{R}_\mathrm{g}$
,
 $\mathrm{W}_\mathrm{o1}$
,
 $\mathrm{Q}_\mathrm{1}$
and migration.
 $\uparrow$
means increase,
 $\downarrow$
means decrease, and = means unchanged.

Table 1 Long description
The table has four rows and three columns. The column headers are Parameter, M, R h, and N 2 slash N tot. The row labels are R g, W o 1, Q 1, and migration. The values in the table are as follows: Row 1: R g, equals sign, up arrow, down arrow. Row 2: W o 1, up arrow, up arrow, down arrow. Row 3: Q 1, up arrow, up arrow, down arrow. Row 4: migration, up arrow, up arrow, equals sign. The table summarizes how different parameters change in response to changes in global and environmental parameters.
When talking about modeling MWGC, the main focus should be on in-situ GCs, because ex-situ GCs were formed in other environments. GCs are formed in the very early stages of the galaxy’s evolution, when the galaxy is a very hostile environment, with a highly changing tidal field and multiple close and strong interactions with nearby dwarf galaxies. The mass of the galaxy is rapidly being built up during this period. The work of Meng and Gnedin (Reference Meng and Gnedin2022) suggests that the period of rapid changes in the tidal field of a galaxy ends after about 1 Gyr. After this time, GCs virtually stop migrating outside. As many numerical simulations (e.g., Banerjee and Kroupa Reference Banerjee and Kroupa2013; Leveque et al. Reference Leveque, Giersz, Banerjee, Vesperini, Hong and Portegies Zwart2022) have shown, gas ejection after the formation of 1P is associated with strong cluster expansion and excess of kinetic energy relative to potential energy (
 $\mathrm{Q}_1 \gt 0.5$
). Such a cluster will be characterized by a relatively low density contrast (rather small
 $\mathrm{W}_\mathrm{o1}$
, significantly less than 5 or 6), and for small galactocentric distances, it should be TF. The cluster expansion due to gas expulsion is mainly related to SFE and not to the position of the cluster in the galaxy. Thus, clusters that form closer to the center have smaller
 $\mathrm{R}_\mathrm{t}$
than those that arise further away, and can also more easily become TF or even TF overfilling, even if the SFE may be high as suggested by recent works by Calura et al. (Reference Calura, D’Ercole, Vesperini, Vanzella and Sollima2019); Polak et al. (Reference Polak, Mac Low, Klessen, Wei Teh, Cournoyer-Cloutier, Andersson, Appel, Tran, Lewis, Wilhelm, Portegies Zwart, Glover, Rieder, Wang and McMillan2024).
The joint action of cluster migration and initial models with
 $\mathrm{Q}_1 \gt 0.5$
seems to work in the desired direction -
 $\mathrm{R}_\mathrm{h}$
of a few pc and significant values of
 $\mathrm{N}_2/\mathrm{N}_\mathrm{tot}$
, provided that the cluster is formed relatively close to the galactic center and it is initially relatively massive, at least about
 $\mathrm{10}^6 \mathrm{M}_{\odot}$
.
The initial model parameters for the MOCCA simulations were chosen to explore the impact of specific assumptions related to MSP formation and evolution rather than to reproduce the full diversity of the MWGC population the agreement between the simulation results and observations is generally satisfactory, particularly in terms of the
 $\mathrm{N}_2/\mathrm{N}_\mathrm{tot}$
values. However, we acknowledge that the simulated clusters exhibit an anticorrelation between
 $\mathrm{N}_2/\mathrm{N}_\mathrm{tot}$
and present-day cluster mass, whereas observational data suggest a positive correlation. This discrepancy will be further discussed in the next Section, where a speculative scenario for MSP formation will be presented.
3. Speculative AGB scenario for MSP formation
Based on the results of the MOCCA simulations and the available literature on GC formation processes in zoom-in cosmological and purely hydrodynamical simulations, we introduce a speculative extension of the AGB scenario to provide a sketch of possible GC evolution in the strongly and rapidly changing environment of a Galaxy in the process of formation. To reproduce the mass-
 $\mathrm{N}_2/\mathrm{N}_\mathrm{tot}$
correlation, let’s assume that the availability of gas from which GCs can form decreases with distance from the galactic center. Thus, clusters forming farther from the center will have, on average, a lower mass of 1P and, more importantly, probably a significantly lower mass of gas that can again be re-accreted into the cluster and form 2P. The small value of
 $\mathrm{N}_{2}$
relative to
 $\mathrm{N}_{1}$
causes the increase in the
 $\mathrm{N}_2/\mathrm{N}_\mathrm{tot}$
ratio to be slow initially and only increase significantly after a period of 1 - 2 Gyr. Thus, if the cluster migrates during this time, its observed value of the
 $\mathrm{N}_{2}/\mathrm{N}_\mathrm{tot}$
ratio will be relatively low. For massive clusters formed from very massive gas clouds, the availability of gas is very high, which will lead to the formation of clusters that initially have a relatively large
 $\mathrm{N}_2/\mathrm{N}_\mathrm{tot}$
ratio. For such clusters, the increase in this ratio to large values occurs quickly and then stabilizes. This means that their migration can stop the
 $\mathrm{N}_2/\mathrm{N}_\mathrm{tot}$
ratio at relatively large values. Dynamical friction also seems to be an important player in this process. We know that its effectiveness depends on the mass of the cluster and the distance from the center of the galaxy. Therefore, very massive clusters formed too close to the center or located after migration in not very eccentric orbits will sink and merge in the galactic nucleus. Those that have larger eccentricities have a larger probability of surviving. Less massive clusters are likely to be born or to migrate to larger distances, and therefore, dynamical friction will not be effective for them. Therefore, the mutual interaction of dynamical friction, migration, and availability of gas from which GC can be formed may lead to the generation of the currently observed correlation between the mass of GCs and their
 $\mathrm{N}_2/\mathrm{N}_\mathrm{tot}$
ratio.
This is a rather speculative and perhaps a bit naive scenario requiring several physical processes to operate in the right time order and in the right environment of a young, assembling galaxy. Maybe this is the answer to the question of why, for young and massive star clusters that we are now observing, we do not see the observational signatures of MSPs. Simply, the current galactic environment is not suitable for the physical processes that enable the creation of MSP.
The scenario presented above should not be taken as the only explanation for the observed properties of MSPs in MWGCs. In our view, it is the leading scenario and accounts for the most important features of MSPs. However, other scenarios discussed in the literature may also contribute, operating alongside the AGB scenario and further blurring the photometric and spectroscopic distinctions between 1P and 2P stars. Indeed, it would be surprising if these additional mechanisms did not play some role in shaping what we observe in MWGCs.
Finally, we note that according to Ishchenko et al. (Reference Ishchenko, Berczik, Panamarev, Kuvatova, Kalambay, Gluchshenko, Veles, Sobolenko, Sobodar and Omarov2024), the orbits of MWGCs can undergo significant evolution over a Hubble time due to variations in the Galactic tidal field, resulting in either inward or outward migration.
4. Discussion
A good theory is always able to explain new observational facts. Let us then check whether the proposed speculative extension of the AGB scenario is able to explain the observations that have caused much trouble for all the MSP formation scenarios found in the literature.
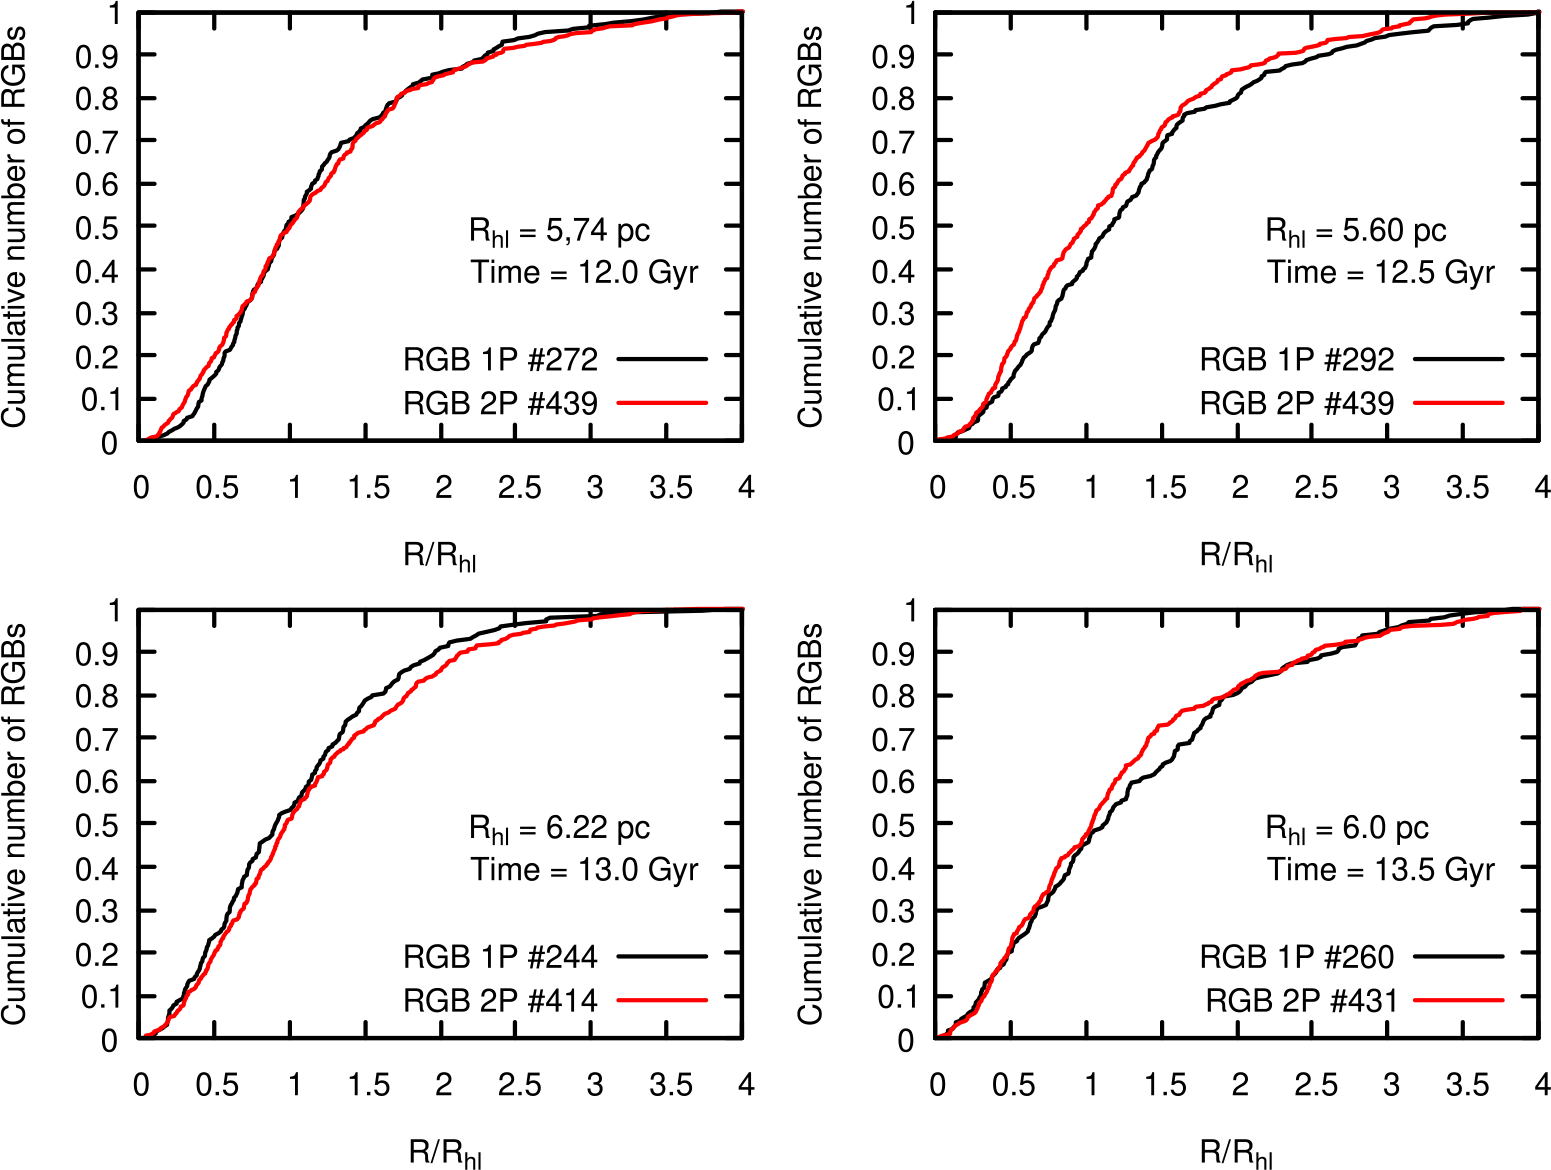
Leitinger et al. (Reference Leitinger, Baumgardt, Cabrera-Ziri, Hilker and Pancino2023) and later Cadelano et al. (Reference Cadelano, Dalessandro and Vesperini2024) published papers in which they showed that for some clusters (namely, NGC 3201 and NGC 6101) the A+ parameter indicates that 1P is more concentrated than 2P. Virtually none of the proposed scenarios can explain these observations. Inspired by Leitinger’s results, we analyzed the MOCCA simulation results and found many examples where 1P is more concentrated than 2P. All these models are characterized by a not very large cluster mass at present and contain a BH subsystem. The clusters observed by Leitinger et al. (Reference Leitinger, Baumgardt, Cabrera-Ziri, Hilker and Pancino2023) are clusters captured by the MW during merger events with dwarf galaxies. This means that these clusters, despite their small mass, have large tidal radii, and they are dynamically old - they are located at a large distance from the galactic center. To make the MOCCA models similar to the observed NGC 3201 and NGC 6101 clusters, we assume that the GC forms in a dwarf galaxy close to its center, to be later captured by the MW to a distant orbit (Giersz et al. Reference Giersz, Askar, Hypki, Hong, Wiktorowicz and Hellström2025b, for details see). In this way, the tidal radius and the radius containing half the luminosity are close to the observed values. One such MOCCA model is presented in Figure 6.
Cumulative number distributions of RGB stars for 1P and 2P as a function of distance scaled by half-light radius (
 $R_{hl}$
) for selected projected (2D) snapshots from 12 Gyr to 13.5 Gyr. 1P is more centrally concentrated than 2P only in the snapshot at 13 Gyr. The number distributions of both populations change significantly over time, and the overconcentration of 1P is a transient feature. The
 $R_{hl}$
values, snapshot times, and the number of RGB stars are provided in the insets of each panel.

Figure 6 Long description
The image contains four line graphs, each showing the cumulative number of RGB stars as a function of distance scaled by half-light radius (R/R_hl). Each graph compares two populations of RGB stars: 1P (black line) and 2P (red line). Panel A: The graph shows data for R_hl = 5.74 pc at 12.0 Gyr, with RGB 1P #272 and RGB 2P #439. Panel B: The graph shows data for R_hl = 5.60 pc at 12.5 Gyr, with RGB 1P #292 and RGB 2P #439. Panel C: The graph shows data for R_hl = 6.22 pc at 13.0 Gyr, with RGB 1P #244 and RGB 2P #414. Panel D: The graph shows data for R_hl = 6.0 pc at 13.5 Gyr, with RGB 1P #260 and RGB 2P #431. Each graph includes annotations for R_hl values, snapshot times, and the number of RGB stars.
In the Figure 6 we see that overconcentration, calculated as in observations for red giant branch (RGB) stars, is a transient feature. It appears and disappears. It is important to stress that the overconcentration is only visible for RGB stars, for other types of stars, in particular main-sequence (MS) stars, it is not visible. Both populations of MS stars are completely mixed with each other. To better understand why only for RGB stars overconcentration is observed and transient, we analyzed the interactions of RGB stars during the evolution of the cluster - the details and results of the analysis can be found in Giersz et al. (Reference Giersz, Askar, Hypki, Hong, Wiktorowicz and Hellström2025b). In short, the BH subsystem formed by 1P stars governs the cluster’s evolution. Since 2P stars are more centrally concentrated, their RGB progenitor stars interact more strongly than those of 1P. As a result, they are more efficiently displaced from the cluster center or even escape, ultimately leading to an overconcentration of 1P RGB stars at the present day. A key requirement is that the number of RGB stars in the system is relatively small. Then, small-N statistics together with dynamical interactions can lead to 1P overconcentration. For larger N, the effect of stronger 2P RGB interaction is blurred. When observations are limited to RGB stars, small-number statistics and dynamical interactions can distort their spatial distribution, leading to biased conclusions about the overall distribution of MSPs.
5. Conclusions
Based on about 200 MOCCA simulations, we analyzed the influence of the most important parameters describing the MSP and GCs on the evolution of the cluster and its observational properties after 12 Gyr of evolution. The aim of the study was to determine such parameter ranges so that the cluster model after 12 Gyr of evolution best matches the ranges of observational parameters of the MWGCs; in particular, the cluster mass,
 $\mathrm{R}_\mathrm{h}$
, and the
 $\mathrm{N}_2/\mathrm{N}_{tot}$
ratio. Based on the simulation analysis and the results of cosmological zoom-in simulations, a speculative refinement of the AGB scenario for the formation and evolution of GCs with MSP was presented to obtain an observational correlation between cluster mass and the
 $\mathrm{N}_2/\mathrm{N}_\mathrm{tot}$
ratio. To achieve this, one must combine the influence of the strongly changing MW environment in which the cluster evolves with its internal evolution and the effects related to the ejection of the residual gas after 1P formation. All those physical processes have to operate in the right time order and in the right environment of the galaxy that is just forming and assembling. In order to confirm this speculative refinement, more sophisticated modeling of the evolving tidal field in which the GCs form and evolve is required.
It is very important to emphasize that models of GCs with MSPs based on the AGB scenario require completely different initial properties than models of clusters with a single population. Instead of GCs being highly concentrated and lying deep inside the Roche lobe, models that fill the Roche lobe are required. This carries strong constraints on where in the galaxy GCs are formed.
Our study suggests that the spatial distribution and, potentially, the kinematic properties of MSP may depend on the type of stars observed. This effect is particularly relevant for GCs with present-day masses of a few
 $\mathrm{10}^5\mathrm{M}_{\odot}$
, which have retained only 10-20% of their initial mass. Despite the significant mass loss, such clusters may appear dynamically young due to BHS heating and migration to larger Galactocentric distances. When observations are limited to RGB stars, small-number statistics and dynamical interactions can distort their spatial distribution, leading to biased conclusions about the overall distribution of MSPs. The overconcentration of 1P RGB stars relative to 2P RGB stars appears to be a transient effect. Confirming the findings of Leitinger et al. (Reference Leitinger, Baumgardt, Cabrera-Ziri, Hilker and Pancino2023) and Cadelano et al. (Reference Cadelano, Dalessandro and Vesperini2024), that in some MW GCs, 1P RGB stars are more centrally concentrated than 2P RGB stars, requires observations of MS stars to see if the same trend is seen for them. Our MOCCA simulations show no 1P overconcentration relative to 2P among MS stars. Verifying this observationally would be a crucial step toward understanding MSP properties and supporting the AGB scenario.
MG, AH, GW, and LH were supported by the Polish National Science Center (NCN) through the grant 2021/41/B/ST9/01191. AA acknowledges support for this paper from project No. 2021/43/P/ST9/03167 co-funded by the Polish National Science Center (NCN) and the European Union Framework Programme for Research and Innovation Horizon 2020 under the Marie Skłodowska-Curie grant agreement No. 945339. AH acknowledges support by the IDUB grant 140/04/POB4/0006 at Adam Mickiewicz University in Poznan, Poland. The figures presented in the article come from Giersz et al. (Reference Giersz, Askar, Hypki, Hong, Wiktorowicz and Hellström2025a); Giersz et al. (Reference Giersz, Askar, Hypki, Hong, Wiktorowicz and Hellström2025b) published in the journal Astronomy & Astrophysics under the CC-BY license.
 Rh
 N2/Ntot
 N1
 N2
 Rg
 Wo1
 concpop=Rh2/Rh1
 Q1
 Rh
 N2/Ntot
 Rh
 Q1
 N2/Ntot
 Q1
 Rh
 Wo1
 N2/Ntot
 Wo1
 Rh
 Rg
 N2/Ntot
 Rg
 Rh
 N2/Ntot
 Rg
 Wo1
 Q1
 ↑
 ↓
 Rhl
 Rhl


