Implications
In this study, the chemical compositions of the empty body of different domestic species were compared, and the results indicated that there were common allometric relationships between two components (protein and water weights) and fat-free empty BW across farm animal species. This type of information could be useful for the development of a general model of reliably predicting chemical composition and energy content of gain in farm animal species. Furthermore, remarkable interspecies differences between farm animals and laboratory animals were found, which may provide evidence of the consequences of the long-term evolution of food-producing animals bred by human-directed selection.
Introduction
Accurate determination of the empty body chemical composition of an animal is of considerable importance, as it can be used to predict and assess energy and nutrient requirements of the animal (Agricultural Research Council (ARC), 1980; Commonwealth Scientific and Industrial Research Organization (CSIRO), 1990; National Research Council (NRC), 2000). It has generally been recognized that, during the growing period, the fat and water contents of the empty body vary inversely with each other, the protein content of fat-free matter changes little, and the changes in protein and fat concentrations reflect energy retention or loss (Murray, Reference Murray1922; Moulton, Reference Moulton1923; Reid et al., Reference Reid, Bensadoun, Bull, Burton, Gleason, Han, Joo, Johnson, McManus, Paldines, Stoud, Tyrrell, Van Niekerk and Wellington1968).
Taylor (Reference Taylor1985) provided a general compositional concept that holds true across species. Several generalizations of biological significance across species have arisen from studies of the chemical body composition. Moulton (Reference Moulton1923) suggested that there is a point when the composition of protein, water and ash in the fat-free matter becomes more or less stationary, and Murray (Reference Murray1922) showed that the protein content of fat-free dry matter was practically constant. Taylor (Reference Taylor1985) compared changes in carcass composition among cattle, pigs and sheep using mature weight and the degree of maturity. Emmans and Oldham (Reference Emmans and Oldham1988) assumed that the ratio of ash to protein and water to protein are essentially constant at a mature state across meat-animal species. However, there have been few reports on comparisons of changes in the chemical composition of the empty body between farm animals and other domestic animals. Farm animal species have been selected as providers of food since their domestication, whereas laboratory animals were not generally for the purpose.
The objectives of this study were (1) to examine the effects of species on the accretion rates of chemical components relative to empty BW, fat-free empty BW and protein weight; (2) to investigate the chemical composition of the empty body and the energy content of the empty BW gain at the same fat content level; and (3) to compare changes in the chemical composition of the empty body between farm and laboratory animals.
Material and methods
Animal Care and Use Committee approval was not obtained for this study because the data were obtained from previously published sources, as described below.
Data collection
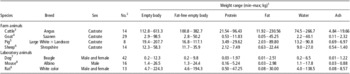
The empty body chemical composition of an animal changes during growth (Hammond, Reference Hammond1932). Data on the chemical composition of seven domestic species (cattle, goats, pigs, sheep, dogs, mice and rats) at different stages of growth, most of which have been reported in the literature, were used for analysis (Table 1). Data were obtained from seven studies (Haecker, Reference Haecker1920; Chanutin, Reference Chanutin1931; Bailey et al., Reference Bailey, Kitts and Wood1960; Burton and Reid, Reference Burton and Reid1969; Sheng and Huggins, Reference Sheng and Huggins1971; Whittemore et al., Reference Whittemore, Tullis and Emmans1988; Ogink, Reference Ogink1993). The protocols for each are fully described in the sources. Farm animals (cattle, goats, pigs and sheep) were all castrated males, whereas laboratory animals (dogs, mice and rats) comprised males and/or females. The data from six species except rats were the individual value for each animal, whereas the data from rats were means. The preliminary analysis showed that the sex difference were smaller than interspecies difference. All animals were fed ad libitum. All data consisted of empty BW (EBW, kg), fat-free EBW (FFW, kg), protein weight (PRO, kg), chemical fat weight (FAT, kg), water weight (WAT, kg) and ash weight (ASH, kg) in animals slaughtered serially. All chemical components were determined using the direct chemical analysis. Because the sum of protein, fat, water and ash contents of the empty body was not equal to the observed EBW, the components were proportionally scaled to match the observed EBW (Tedeschi et al., Reference Tedeschi, Boin, Fox, Leme, Alleoni and Lanna2002). The records with discrepancy of <5% between observed EBW and the sum of the four components were used for analysis. Table 1 contains the number of animals by species and breed with ranges of weight for chemical components of the empty body.
The number of animals by breed and sex, with weight range

1Weight ranges for mice and rats were used g instead of kg.
2Number of observations. The data from six species except rats were the individual value for each animal, whereas the data from rats were means.
3From Haecker (Reference Haecker1920).
4From Ogink (Reference Ogink1993).
5From Whittemore et al. (Reference Whittemore, Tullis and Emmans1988).
6From Burton and Reid (Reference Burton and Reid1969).
7From Sheng and Huggins (Reference Sheng and Huggins1971). Dogs comprised 22 males and 20 females.
8From Bailey et al. (Reference Bailey, Kitts and Wood1960).
9From Chanutin (Reference Chanutin1931). The data for rats were given as the means of males and females.
Statistical analyses
In this study, the accretion rates of chemical components relative to EBW, FFW and PRO were first investigated. Bivariate allometry relating the weight of each chemical component to EBW, FFW and PRO can be analyzed by allometric equation:
 $$Y\,{\rm{ = }}\,a{{X}^b} $$
transformed to the logarithm function, log10Y = log10a + b log10X. In the allometric equation, the b value represents the ratio of the relative growth rate of Y and X. According to the equation, when b > 1, the component (Y) is early maturing, when b < 1, Y is later maturing, and when b = 1, there is isometry, maturing Y and X at the same rate. Seebeck (Reference Seebeck1968) demonstrated that the allometric function is the most appropriate model for describing part-to-whole relationships. For the purpose of assessing the effect of species, the following statistical model was used in this study (St-Pierre, Reference St-Pierre2001):
 $${{Y}_{ij}}{\rm{ = }}{{B}_{\rm{0}}}{\rm{ + }}{{S}_i}{\rm{ + }}{{B}_{\rm{1}}}\,{{X}_{ij}}{\rm{ + }}{{B}_i}{}{{X}_{ij}}{\rm{ + }}{{e}_{ij}}$$
where Yij is logarithm (base 10) of the weight of each chemical component of the empty body; Xij is logarithm (base 10) of EBW, FFW or PRO; B 0 is the overall intercept across species; Si is the effect of the ith species; B 1 is the overall regression coefficient across species; Bi is the effect of species i; and eij is the residual error. Intercepts and regression coefficients were calculated from data that included observations only for farm animals and from data with all animal species. Statistical analyses were performed based on fixed effects model analysis by St-Pierre (Reference St-Pierre2001) using PROC GLM of SAS (SAS Institute Inc., Cary, NC, USA). The significance of the comparisons for intercepts (Si) and regression coefficients (Bi) between species and between farm and laboratory animal species was assessed using the CONTRAST statement of SAS.
The changes in the water content of the empty body and energy content of EBW gain (RE/EBWG, MJ/kg) were compared across species. The same statistical model (where Yij is the water content of the empty body or RE/EBWG; Xij is the fat content of the empty body) and the same procedure were used to test the relationships for the fat content of the empty body across species.
Energy content is calculated from the amount of protein and fat deposits in this study. The protein and fat content in EBW gain (ΔP and ΔF, respectively) are estimated by taking the derivatives of the allometric equations as follows: ΔP = a × b × EBWb − 1 = b × PRO × EBW−1, ΔF = c × d × EBWd − 1 = d × FAT × EBW−1. When heats of combustion of 23.8 and 39.6 kJ/g are assumed for protein and fat, respectively (Kyriazakis and Emmans, Reference Kyriazakis and Emmans1992), energy content of EBW gain (RE/EBWG, MJ/kg) and the fraction of empty body energy gain retained as fat (REF/RE) can be obtained as RE/EBWG = 23.8 × ΔP + 39.6 × ΔF and REF/RE = 39.6 × ΔF × (RE/EBWG)−1.
The fat content of the empty body was used as a common indicator for interspecies comparisons in the present study. In general, however, the degree of maturity (u = BW/A), calculated as the proportion of BW to mature BW (A), has been adopted as a genetic scaling parameter (Taylor, Reference Taylor1985); Taylor (Reference Taylor1985) assumed the constant fat content of the empty body at maturity. If one accepts the assumption that the fat content at a given fraction of mature weight is fixed, this means that the fat contents of the empty body may be a measure of the degree of maturity. As the mature weight of both goats (Ogink, Reference Ogink1993) and pigs (Whittemore et al., Reference Whittemore, Tullis and Emmans1988), derived from growth curve analysis, were available in these studies (109.6 kg for goats and 225 kg for pigs), the relationship between the degree of maturity and fat content of the empty body for the two species was initially investigated in the present study. The result is provided in the supplementary material online (Supplementary Figure S1).
Results
Allometric growth of chemical components relative to empty BW
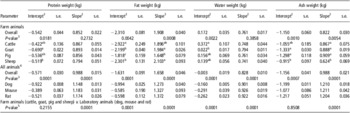
The allometric growth coefficients for empty body components (PRO, FAT, WAT and ASH) relative to EBW are shown in Table 2. The values of the intercept for all empty body components were different (P < 0.05) among species. Allometric growth coefficients (values of the slope) for PRO and WAT were not different (P > 0.2) among farm animals, whereas those for FAT and ASH weights did differ (P < 0.01). This result indicated that there was no interspecies difference in terms of growth pattern for protein and water within farm animals. In contrast, fat was deposited at a slower rate in pigs than in goats and sheep (P < 0.05). Ash was deposited at a slower rate in sheep than in other farm animals (P < 0.05). Among farm animals, sheep had a lower allometric growth coefficient for PRO than others, although no interspecies difference was observed (P > 0.2).
Allometric growth coefficients for each empty body component weight relative to the empty BWFootnote 1

a,b,c Values bearing different superscripts for farm animals are different (P < 0.05).
1 Equation has the form log10Y = log10a + b × log10EBW, where Y is the component weight (kg) and EBW is the empty BW (kg).
2 Intercept is the log10a value and slope is the b value in the equation.
3 P-value indicating whether or not intercepts and slopes are affected by species, as evaluated by the present model, including the effect of species.
4 The intercept and slope values for farm animal species are not shown because those values are identical to the estimates given by the equations for farm animals only.
5 P-value indicating whether or not intercepts and slopes are affected by group (farm animals and laboratory animals), as evaluated by the present model, including the effect of group.
On the other hand, in the analysis using all animals, the allometric growth coefficients for all empty body components were different (P < 0.01) among species. Laboratory animals (dogs, mice and rats) had greater allometric growth coefficients for PRO, WAT and ASH (P < 0.01), whereas they had lower allometric growth coefficients for FAT than did the farm animals (P < 0.01).
Allometric growth of chemical components relative to fat-free empty BW
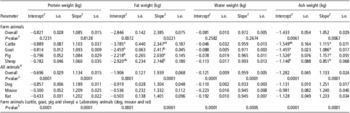
The allometric growth coefficients for empty body components relative to FFW are shown in Table 3. The values of the intercepts for PRO and WAT were not different (P > 0.2) among farm animals but were different when all animals were compared (P < 0.01). The values of the intercepts for FAT and ASH were different (P < 0.01) among species.
Allometric growth coefficients for each empty body component weight relative to the fat-free empty BWFootnote 1

a,b,c Values bearing different superscripts for farm animals are different (P < 0.05).
1 Equation has the form log10Y = log10a + b × log10FFW, where Y is the component weight (kg) and FFW is the fat-free empty BW (kg).
2 Intercept is the log10a value and slope is the b value in the equation.
3 P-value indicating whether or not intercepts and slopes are affected by species, as evaluated by the present model, including the effect of species.
4 The intercept and slope values for farm animal species are not shown because those values are identical to the estimates given by the equations for farm animals only.
5 P-value indicating whether or not intercepts and slopes are affected by group (farm animals and laboratory animals), as evaluated by the present model, including the effect of group.
Similar to the relationships between the empty body components and EBW, the allometric growth coefficients for PRO and WAT relative to FFW were not different (P > 0.2), whereas those for FAT and ASH weights were different (P < 0.05) among farm animals. FAT was deposited at a slower rate in pigs than in goats and sheep (P < 0.05) and ASH was deposited at a slower rate in sheep than in other farm animals (P < 0.05). In the all-animal comparison, the allometric growth coefficients for all empty body components were different (P < 0.01) among species. Laboratory animals had a lower allometric growth coefficient for FAT than did the farm animals (P < 0.01). Although the allometric growth coefficients for PRO, WAT, and ASH became more homogeneous when the accretion rates of the empty body components were expressed relative to the growth of FFW as a substitute for EBW, laboratory animals had greater allometric growth coefficients for PRO and ASH (P < 0.01) and lower allometric growth coefficients for WAT (P < 0.01) than did the farm animals.
The relationships between log10 PRO and log10 FFW and between log10 WAT and log10 FFW are presented in the supplementary material online (Supplementary Figure S2). As there were highly positive relationships among the four farm animals evaluated, the following allometric equations across farm animal species could be obtained: PRO = 0.151 × FFW1.085, and WAT = 0.830 × FFW0.972. By contrast, these equations did not fit the data for laboratory animal species.
Allometric growth of chemical components relative to protein weight
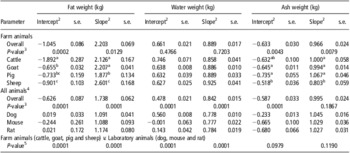
The allometric growth coefficients for FAT, WAT and ASH relative to PRO are shown in Table 4. The values of the intercept for WAT were not different (P > 0.4) among farm animals, but they were different among all animals (P < 0.01). The values of the intercept for FAT and ASH were different (P < 0.01) among species.
Allometric growth coefficients for fat, water and ash weight relative to protein weightFootnote 1

a,b,c Values bearing different superscripts for farm animals are different (P < 0.05).
1 Equation has the form log10Y = log10a + b × log10PRO, where Y is fat, water and ash weight (kg) and PRO is protein weight (kg).
2 Intercept is the log10a value and slope is the b value in the equation.
3 P-value indicating whether or not intercepts and slopes are affected by species, as evaluated by the present model, including the effect of species.
4 The intercept and slope values for farm animal species are not shown because those values are identical to the estimates given by the equations for farm animals only.
5 P-value indicating whether or not intercepts and slopes are affected by group (farm animals and laboratory animals), as evaluated by the present model, including the effect of group.
Among farm animals the allometric growth coefficients for FAT and ASH were different (P < 0.01), whereas there was no difference in the case of WAT (P > 0.7). When laboratory animals were included in the analysis, the allometric growth coefficients for FAT and WAT became different (P < 0.01), but the allometric growth coefficients for ASH did not show a difference (P > 0.1) among species. Laboratory animals had lower allometric growth coefficients for FAT and WAT than did the farm animals (P < 0.01). The allometric growth coefficients for ASH of cattle (1.000), goats (0.994), pigs (1.067), dogs (1.045), mice (1.029) and rats (1.027) were not different from a value of 1 (P > 0.1), whereas allometric growth coefficient for sheep (0.803) was <1 (P < 0.01).
The relationship between log10 WAT and log10 PRO is presented in the supplementary material online (Supplementary Figure S3). There was a highly positive relationship and the following allometric equation across farm animal species was obtained: WAT = 4.581 × PRO0.889. By contrast, this equation did not fit the data for laboratory animals; relatively more protein and less water for mice and rats were shown. This was likely due to the lower values of the intercept for mice and rats (Table 4).
Relationship between water and fat contents of the empty body
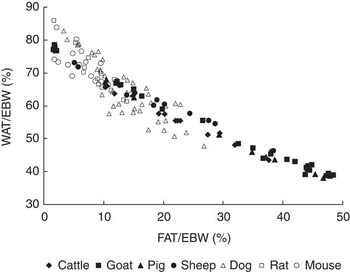
The relationship between WAT/EBW (%) and FAT/EBW (%) is presented in Figure 1. Among farm animals, the rate of change in water content per unit change in fat content was greater in sheep (−0.77) than in pigs (−0.81), cattle (−0.82) and goats (−0.85), although no interspecies difference was observed (P > 0.05). Laboratory animals had lower rates of change in water content per unit change in fat content than did the farm animals (P < 0.01).
Relationship between water content of the empty body (WAT/EBW, %) to fat content of the empty body (FAT/EBW, %) for cattle, goats, pigs, sheep, dogs, mice and rats.

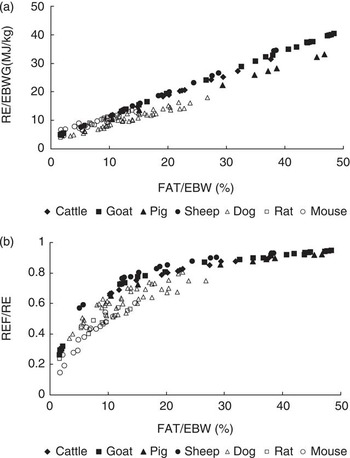
Energy content of empty BW gain
Figure 2 presents the relationship between (A) the total energy content of EBW gain (RE/EBWG, MJ/kg) and FAT/EBW (%), and (B) the fraction of empty body energy gain retained as fat (REF/RE) and FAT/EBW (%). Here, the energy content of EBW gain was found to increase linearly with the increase in the fat content of the empty body. During growth, pigs showed less energy content of EBW gain than cattle, goats and sheep. By contrast, the fraction of empty body energy gain retained as fat increased in a curvilinear manner with the increase in the fat content of the empty body. Moreover, variation among farm animals was reduced when the comparison was made using the same empty body fat content value across species. Laboratory animals had relatively lower values than farm animals.
Relationships between (a) total energy content of empty body gain (RE/EBWG, MJ/kg) and fat content of the empty body (FAT/EBW, %) and (b) the fraction of empty body energy gain retained as fat (REF/RE) and fat content of the empty body for cattle, goats, pigs, sheep, dogs, mice and rats.

Discussion
Allometric growth of chemical components
Berg and Butterfield (Reference Berg and Butterfield1976) have suggested that since the major variable component in the body is fat, the body can be divided into two types of component, namely, fat and fat-free components. For this reason, the accretion rates of the various chemical components relative to the empty body and to the fat-free empty body were analyzed separately in the present study.
With respect to the allometric growth coefficient for fat relative to the empty body, Fortin et al. (Reference Fortin, Simpfendorfer, Reid, Ayala, Anrique and Kertz1980) estimated a value of 1.84 in Angus steers, ARC (1980) estimated a value of 2.02 in Merino castrates and Schinckel et al. (Reference Schinckel, Mahan, Wiseman and Einstein2008) estimated a value range in barrows of 1.56 to 1.76. These estimates were similar to those of the present study. Eisen (Reference Eisen1987) estimated an allometric growth coefficient of 1.29 for the fat in male mice, and Prothero (Reference Prothero1995) estimated a value of 1.21 in small mammals from the data set collected by Pitts and Bullard (Reference Pitts and Bullard1968), which were similar to the estimates for laboratory animals in the present study.
In this study, the largest difference observed between farm and laboratory animals in terms of empty body composition was the rapid accretion of fat relative to the fat-free empty body in farm animals compared with laboratory animals. Pitts and Bullard (Reference Pitts and Bullard1968), who noted that the percentage body fat can be estimated from fat-free mass for 47 species of wild animals, reported that laboratory animals were much fatter than wild mammals. These results indicate that the selective processes of animal husbandry may produce changes in the accretion of fat.
Emmans (Reference Emmans1988) showed that the fat weight is often found to be an allometric function of protein weight for a given kind of animal in non-limiting nutritional conditions. The values of the two parameters in allometric function varied markedly between farm and laboratory animals, indicating that the accretion rates of fat weight relative to protein weight differ between species.
In this study, the allometric growth coefficients for protein and water relative to the empty body were not significantly different among farm animal species. The overall slope of protein relative to the empty body for farm animals (0.85) was similar to the values reported by ARC (1980) (0.89 for cattle and 0.90 for sheep, respectively). The overall slope of water relative to the empty body for farm animals (0.76) was similar to the values reported by Fortin et al. (Reference Fortin, Simpfendorfer, Reid, Ayala, Anrique and Kertz1980) in Angus steers of 0.74 and that reported by Schinckel et al. (Reference Schinckel, Mahan, Wiseman and Einstein2008) in low-lean gain barrows of 0.81.
As the most variable component of body is fat, the composition of the fat-free empty body may be relatively constant. With respect to the allometric growth coefficients relative to the fat-free empty body, Fortin et al. (Reference Fortin, Simpfendorfer, Reid, Ayala, Anrique and Kertz1980) estimated for Holstein steers values of 1.09 and 0.95 for protein and water, respectively; protein and water accretion rates were similar to those of the present study. Robelin and Geay (Reference Robelin and Geay1978) estimated allometric growth coefficients for protein and water of 1.06 and 0.98, respectively, in a number of literature sources describing studies that had included various breeds. Tess et al. (Reference Tess, Dickerson, Nienaber and Ferrell1986) estimate for barrows ranged from 1.10 to 1.13 for protein and ranged from 0.95 to 0.97 for water in relation to FFW. These allometric growth coefficients for cattle and pigs show a similar trend in terms of changes in protein and water deposition in the fat-free empty body. Furthermore, the results of the present study indicate that these relationships can hold true for goats and sheep as well.
The relationships between the two components (protein and water) and fat-free empty BW across farm animal species indicate that protein and water weights can be estimated from the equations that hold for farm animal species, that is, PRO = 0.151 × FFW1.085 and WAT = 0.830 × FFW0.972. The advantage of these equations is their practical application in estimating body composition with a significant reduction of time and cost for laboratory analysis. If these equations hold true across species, the determination of fat content enables us to estimate protein and water, and possibly ash. Moreover, it would be possible to use experimental results on body composition from one farm animal species to estimate the composition of other farm animal species.
Williams (Reference Williams2005) developed a biological model to predict the composition of fat-free matter gains in cattle. In this model, daily gains in fat-free matter are calculated by dividing daily protein accretion by the fraction of protein in fat-free matter, and EBW gain is obtained as the sum of fat and fat-free matter. The value used for the fraction of protein in fat-free matter plays a crucial role in these calculations, and in most cases, a constant value is assumed (Williams, Reference Williams2005). The relationships of protein and water with fat-free empty body derived in the present study may be used to develop a general model for simulating interspecies growth and chemical body composition for farm animals.
There seems to be a reasonable expectation of allometric relationships of water weight with protein weight. Lewis and Emmans (Reference Lewis and Emmans2007) reported that, in Suffork lambs, the water weight would be an allometric function of protein weight. De Lange et al. (Reference De Lange, Morel and Birkett2003) concluded that the accretion rate of water weight relative to protein weight is remarkably constant across pig breeds at about 0.855. In this study, the overall slope of water relative to protein for farm animals was 0.889, implying that the relationship can be true beyond farm animal species.
Although allometric growth was assumed in this study, there are several studies where fitting of allometric function to body component has been questioned. However, Schinckel et al. (Reference Schinckel, Mahan, Wiseman and Einstein2008) argued that allometric functions have several advantages including simple linear solutions after the log to log transformation, straightforward biological interpretation and the simple stable derivatives. The good fitting of allometric functions for body components in this study (Supplementary Figures S2 and S3) revealed that the allometric coefficients can be meaningfully interpreted and offer a basis for comparison between species in this study.
Relationship between water and fat contents of the empty body
With increasing fat content of the empty body, the decrease in water content was almost inversely proportional. Based on the linear relationship between water and fat contents of the empty body, the rate of change in water content per unit change in fat content was greater in sheep (−0.77) than in pigs (−0.81), cattle (−0.82) or goats (−0.85). Similar results were observed by Reid et al. (Reference Reid, Bensadoun, Bull, Burton, Gleason, Han, Joo, Johnson, McManus, Paldines, Stoud, Tyrrell, Van Niekerk and Wellington1968), who noted that the rate of change in fat content per unit change in water content was greater in sheep (−0.77) than in pigs (−0.90) or cattle (−0.89).
Ratio of ash to protein weight
In this study, the accretion rates of ash weight relative to the protein weight of cattle (1.000), goats (0.994), pigs (1.067), dogs (1.045), mice (1.029) and rats (1.027) were not significantly different from a value of 1. These results indicate that the ratio of ash weight to protein weight could be assumed to remain constant during growth for these domestic animals, which was in agreement with many studies (Reid et al., Reference Reid, Bensadoun, Bull, Burton, Gleason, Han, Joo, Johnson, McManus, Paldines, Stoud, Tyrrell, Van Niekerk and Wellington1968; NRC, 2000; De Lange et al., Reference De Lange, Morel and Birkett2003). The NRC (2000) reported for cattle proportions of 80.2% of protein and 19.8% of ash in the fat-free dry matter. Reid et al. (Reference Reid, Bensadoun, Bull, Burton, Gleason, Han, Joo, Johnson, McManus, Paldines, Stoud, Tyrrell, Van Niekerk and Wellington1968) also reported proportions of 83.4% of protein and 17.0% of ash for pigs, 81.1% of protein and 18.9% of ash for sheep. Although the accretion rate of ash weight relative to the protein weight of sheep (0.803) was significantly different from 1, ASH/PRO values were relatively similar during growth. Farm animals, mice and rats had relatively similar ASH/PRO values (range: 0.14 to 0.26), but dogs had higher ASH/PRO values than farm animals (range: 0.32 to 0.83) during growth. Clawson et al. (Reference Clawson, Garlich, Coffey and Pond1991) showed ASH/PRO values of rats, pigs, chickens and sheep, which range from 0.15 to 0.30. As available information on the chemical composition of dogs is limited or incomplete, further research will be required for dogs.
Energy content of empty BW gain
In animals, nearly all energy is retained as protein and fat. In general, the proportion of fat, and thereby the energy content of weight gain, increases as an animal approaches maturity. Webster (Reference Webster1985) reported that the energy content of weight gain in meat animals selected for early fattening may reach 30 MJ/kg in the later stages of growth, whereas those of wild animals would be at most ∼12 MJ/kg. The range of the energy content of EBW gain in farm animals in the present study was in agreement with the findings reported by Webster (Reference Webster1985).
In the CSIRO (1990), the degree of maturity was used in a single set of equations to predict the fat and protein contents, and hence the energy in gain for growing animals in all breeds of sheep and cattle. In this study, there was a difference between two farm animal species groups (cattle, goats, and sheep v. pigs) when they were compared at the same empty body fat content. This was due to the lower values of the allometric growth coefficient for fat relative to the empty body for pigs compared with ruminants.
Koong (Reference Koong1977) proposed an alternative method that estimates partitioning of energy intake to protein and fat in growing animals. According to Koong's method, the effect of energy intake level on the fraction of metabolizable energy available for growth (used for fat synthesis) was described using a Michaelis–Menten type of equation (Koong, Reference Koong1977). Hirooka et al. (Reference Hirooka, Groen and Hillers1998) assumed that the partition of retained energy for protein and fat synthesis is equal in all cattle breeds and sexes when comparisons are made among animals at the same degree of maturity and the proportion of energy used for fat deposit can be represented using a Michaelis–Menten type of equation for the degree of maturity. This assumption permitted the development of a general cattle production model for estimating empty body composition beyond breeds in cattle (Hirooka et al., Reference Hirooka, Groen and Hillers1998). In the present study, the variation among farm animals was relatively small when comparisons were made among animals with the same empty body fat content, implying that the relationship can hold true for other animals, and not just farm animal species. This relationship might be helpful for developing an energy-based production model, which can be applied to farm animals.
Farm animals v. laboratory animals
Domestication of most farm animals occurred during the Neolithic period (5000 and 10 000 years ago) and understanding the history and the evolutional process have been of interest to biologists as well as animal scientists since Darwin. In the present study, the largest difference observed between farm and laboratory animals in terms of empty body composition was the rapid accretion of fat in farm animals compared with laboratory animals. Many feral species do not readily attain a level of 20% body fat (Taylor, Reference Taylor1985). This may indicate that animals used in agriculture exhibit dramatic effects of human-directed evolution, that is, selection for rapid growth starting before the 20th century. When people were short of food, fat from animals was a highly valuable energy source, and therefore genetically fatty animals might be highly prized. In most cases, farm animals as providers of food selected for rapid growth tended to have more fat.
For more than three decades, consumers in developed countries have been concerned with undesirable health effects caused by the excess consumption of saturated fat have reduced their consumption of red meats. As a result, modern farm animals have been selected to be leaner. Schinckel et al. (Reference Schinckel, Mahan, Wiseman and Einstein2008) reported that high lean-gain pigs had lower allometric growth coefficients for lipid mass relative to BW, and greater allometric growth coefficients for protein mass relative to BW compared with low lean-gain pigs. For laboratory animals, however, Eisen (Reference Eisen1989) reported in his review that on selection of mice and rats for experiments body fat and protein percentages were not modified significantly by selection for lean weight traits, whereas selection for fat percentage caused negative response in body protein percentage.
It was suggested from the present study that, as far as farm animals are concerned, the chemical composition of the fat-free BW of various species may be similar and the most variable component in the body is fat. The information may provide the opportunity to develop a general model to predict empty body composition across farm animal species. On the other hand, there were considerable differences of chemical body composition between farm and laboratory animals, indicating the consequences of long-term evolution under different human-directed selection between the two groups of domestic animals.
Acknowledgements
The authors are grateful to the editor and referees for their valuable suggestions that have improved this paper.
Supplementary material
For supplementary material referred to in this article, please visit http://dx.doi.org/10.1017/S1751731113000220