Implications
This study investigated a novel, structured participatory and farm-centric approach to herd health planning in organic dairy herds. Farmer, veterinarian and advisor (i.e. participants) contributed equally with their knowledge in the process, in contrast to farmers’ previous experiences with more top-down advices. Future herd health advisory services may be revised, according to the principles of this study, because a) the degree of implementation of actions was quite high, even though the improvement of animal health could not be linked to the herd health planning approach; and b) the approach was highly appreciated by the participants.
Introduction
Herd health management in dairy production has evolved during the past decades. At the same time, vast improvements in animal health and production have been made, although it has sometimes been difficult to demonstrate direct links between individual management changes and positive effects on herd health and production indicators (Derks et al., Reference Derks, van Werven, Hogeveen and Kremer2014; Tremetsberger et al., Reference Vaarst and Alrøe2015). Improvements, such as better housing, improved feeding strategies, new milking equipment and milking routines have most likely reduced the prevalence of traumatic lesions, metabolic disorders, mastitis and reproduction disorders (Hultgren, Reference Hultgren2002; Dippel et al., Reference Dippel, Dolezal, Brenninkmeyer, Brinkmann, March, Knierim and Winckler2009; Stengärde et al., Reference Tremetsberger, Leeb and Winckler2012). However, diseases such as mastitis and lameness are still common and have negative effects on animal health and welfare as well as on production economy (Whay et al., Reference Whay, Waterman, Webster and O’Brien1998; Ettema and Østergaard, Reference Ettema and Østergaard2006; Cha et al., Reference Cha, Hertl, Bar and Gröhn2010; Alvåsen et al., Reference Alvåsen, Jansson Mörk, Dohoo, Sandgren, Thomsen and Emanuelson2014). Providing evidence of the costs of poor animal health, and the economic benefits of improving herd health by different actions has, however, not always resulted in the expected changes in herd health management (Rehman et al., Reference Richert, Cicconi, Gamroth, Schukken, D P Stiglbauer and Ruegg2007; Huijps et al., Reference Huijps, Hogeveen, Lam and Huirne2009). One challenge is that farmers rely on advice from many different actors who have different professional perspectives, such as feeding, breeding, housing, milk quality, animal health and farm economics, that may be difficult to balance. Although this may seem reasonable, it has been shown that involving all relevant parties, in itself, is not sufficient to achieve the desired results. The traditional advisory services by external experts, such as veterinarians and advisors, with ‘one size fits all’ solutions based on one single perspective is insufficient in the highly complex systems that dairy farms are today. Rather, an interactive planning approach involving the farmers’ wishes and expectations and thus resulting in farmer-owned decisions has been deemed necessary to achieve changes (Vaarst et al., Reference Vaarst, Winckler, Roderick, Smolders, Ivemeyer, Brinkmann, Mejdell, Whistance, Nicholas, Walkenhorst, Leeb, March, Henriksen, Stöger, Gratzer, Hansen and Huber2007; Tremetsberger and Winckler, Reference van Soest, Mourits and Hogeveen2015). Furthermore, a structured method is needed to ensure that all aspects of herd health, including management, are covered in the herd health plans and that actions and goals are formulated and continuously evaluated (Vaarst et al., Reference Vester2011). Farmers’ own perceptions of herd health problems have been shown to play an important role in the prioritisation of actions to improve herd health (Derks et al., Reference Derks, van Woudenbergh, Boender, Kremer, van Werven and Hogeveen2013; Denis-Robichaud et al., Reference Denis-Robichaud, Cerri, Jones-Bitton and LeBlanc2018). The benefits of participatory approaches that actively involve all relevant actors have been demonstrated as positive effects on herd health indicators following the development of farm-specific herd health plans established together with the farmer, and not as prescriptive advice from the advisor to the farmer (Green et al., Reference Green, Leach, Breen, Green and Bradley2007; Ivemeyer et al., Reference Ivemeyer, Smolders, Brinkmann, Gratzer, Hansen, Henriksen, Huber, Leeb, March, Mejdell, Nicholas, Roderick, Stöger, Vaarst, Whistance, Winckler and Walkenhorst2012; Tremetsberger et al., Reference Vaarst and Alrøe2015). The impact matrix, a tool designed to assess the relationships between numerous system variables, was developed further to be used for structured capturing of the complexity of individual dairy farms, (based on the knowledge of farmer, herd veterinarian and advisor) and to identify farm-specific factors for driving changes as well as focus areas (Krieger et al., Reference Krieger, Hoischen-Taubner, Emanuelson, Blanco-Penedo, de Joybert, Duval, Sjöström, Jones and Sundrum2017a). This provides opportunities to combine a structured (as in use of the impact matrix) and participatory (by all relevant actors at the same time) approach.
Animal welfare including health is often regarded as a trademark of organic dairy production. Standards for organic farming aim for improved animal health and welfare but also create challenges such as restrictions in treatments and generally less frequent veterinary consultations. The higher proportion of older cows, common in organic farms that are associated with higher prevalence of diseases also contributes to these challenges (Luttikholt, Reference Luttikholt2007; Richert et al., Reference Sjöström, Madouasse, Duval and Emanuelson2013; Stiglbauer et al., Reference Tremetsberger and Winckler2013). There are indications that the animal health status in European organic dairy production does not meet consumers’ expectations (Harper and Makatouni, Reference Harper and Makatouni2002; von Meyer-Höfer et al., Reference Nyman, Lindberg and Sandgren2015; Krieger et al., Reference Krieger, Sjöström, Blanco-Penedo, Madouasse, Duval, Bareille, Fourichon, Sundrum and Emanuelson2017b). Hence, there is room for improvement of herd health and thus also welfare, in organic dairy farming which can be achieved by the implementation of tailored herd health plans targeted to the specific situation of individual farms (Jones et al., Reference Jones, Sok, Tranter, Blanco-Penedo, Fall, Fourichon, Hogeveen, Krieger and Sundrum2016). Improving animal health can also lead to improved animal welfare (Nyman et al., Reference Olsson, Baekbo, Hansson, Rautala and Østerås2011). Due to limited availability of records of welfare, the focus in this study was animal health.
The aim of this study was to evaluate a participatory approach, with a structured impact matrix analysis to herd health planning by assessing the implementation of actions listed in farm-specific herd health plans and the associated changes in animal health indicators in organic dairy herds in France, Germany and Sweden.
Material and methods
Study population
A total of 122 organic dairy farms were recruited. Sufficient data were only available from 119 farms in France (27), Germany (59) and Sweden (33). All study farms were taking part in the FP7-funded research project IMPRO (Impact matrix analysis and cost-benefit calculations to improve management practices regarding health status in organic dairy farming, www.impro-dairy.eu). Farms were selected based on the following inclusion criteria: participation in an official milk recording scheme since January 2012, official certification as an organic farm for at least 1 year before the start of the study, expected to be in operation for the coming year, and herd sizes reflecting the farm demography of the country (as regards range and mean). Farms were recruited by mail or phone in Sweden. In France and Germany, local advisors or veterinarians assisted in the process. A sample was drawn from farms willing to participate. The geographic distribution of farms included in the study matched the proportion of organic dairy farms and was deemed to reasonably capture the variation in organic dairy production in Europe (Eurostat, 2017). Further details on farm selection can be found in van Soest et al. (Reference Stiglbauer, Cicconi-Hogan, Richert, Schukken, Ruegg and Gamroth2015). All (100%) of the German farms, 93% of the farms in France and 85% of the farms in Sweden had loose housing systems, whereas the remaining farms in Sweden had tie-stalls and in France, the remaining farms were divided in equal shares of tie-stalls and always kept outside. Holstein was the predominant breed in 52% of the farms in Sweden, 44% in France and 39% in Germany, where the main other breeds were, for example, Swedish red and white cattle in Sweden (39%), Fleckvieh/Simmental in Germany (42%), Montbélliarde (22%) and Normande (19%) in France. Because some farms had their own dairy, the milk production was measured as the amount of sold milk. The median (lower quartile, upper quartile) amount of sold milk kg/cow per year was 5500 (5200, 6000) in France, 6200 (5500, 7000) in Germany and 8700 (7900, 9200) in Sweden.
Participatory approach and impact matrix analysis
As part of the herd health planning, actions to improve animal health were identified, using a structured participatory approach. Farm visits were performed between November 2013 and April 2014 as described in detail by Krieger et al. (Reference Krieger, Sjöström, Blanco-Penedo, Madouasse, Duval, Bareille, Fourichon, Sundrum and Emanuelson2017b). Briefly, each farm visit was attended by the farmer, the herd veterinarian and/or an advisor, and a researcher facilitating discussions. The advisors’ specialty varied between farms. Baseline data, from the official milk recording schemes, breeding companies and animal movement databases, on the animal health status (e.g. calf mortality, somatic cell count (SCC), cow mortality, milk yield) of the individual farm were presented as an input for the discussion. Thereafter an impact matrix analysis (Krieger et al., Reference Krieger, Hoischen-Taubner, Emanuelson, Blanco-Penedo, de Joybert, Duval, Sjöström, Jones and Sundrum2017a) was performed with the aim to identify the farm-specific factors that could have a strong impact on animal health, to support the identification of actions to improve herd health. By this approach all participants had an active role, enabling a more holistic perspective on the farm as a complex system. The structured impact matrix included 13 variables that were assigned to 18 criteria in four categories (areas of life, physical, dynamic and system-related) as proposed by Vester (Reference Vester2007). All aspects of the farm were taken into account, even those not usually discussed in advisory situations, for example, family situation or workers’ influence on the management of animals, were discussed jointly and recorded in a software tool by the researcher. An output graph was generated, that gave an overview of which variables (areas) to focus on. Participants (farmer, veterinarian and advisor) had an active role throughout the process and identified areas with potential for improvement for each of the production disease complexes: metabolic diseases, reproductive disorders, foot and limb disorders and udder health. Taking the health status and the impact matrix outcome into account, potentially effective actions, in relation to the farm goals, were identified. Actions that the farmer regarded as feasible to implement were shortlisted, tailored to the possibilities and resources as well as limitations and constraints on the individual farm. The farmer was asked to state in which of the health areas: udder, locomotion, metabolic and reproduction he/she found the potential for improvement (multiple answers were possible). At the end of the visit, the proposed actions were summed up to give the participants the opportunity to add relevant advice. The visit and the actions were summarised by the researcher and sent to the participants after the visits. The participants, that is, mainly the farmer, with or without co-operation of the veterinarian and advisor, worked with the actions without further intervention by the researchers. The advice and actions could be general, such as seeking more knowledge, or very specific, such as providing straw when drying off, written instructions for staff or reconstruction work, for more details see (Emanuelson, Reference Emanuelson2014).
Implementation of actions
A pen-and-paper questionnaire was sent out to the farmers ~1 year after the visit, to follow-up on what actions had been implemented. For each action defined in the plan, the farmer was asked if it was implemented or not. The reasons for non-implementation were assessed, where the most important were time and cost constraints, followed by limitations in housing, lack of skills and access to expertise, and whether other actions (than those agreed) had been implemented instead. The questionnaire was developed in English, and translated to the respective languages in the participating countries.
Data collection
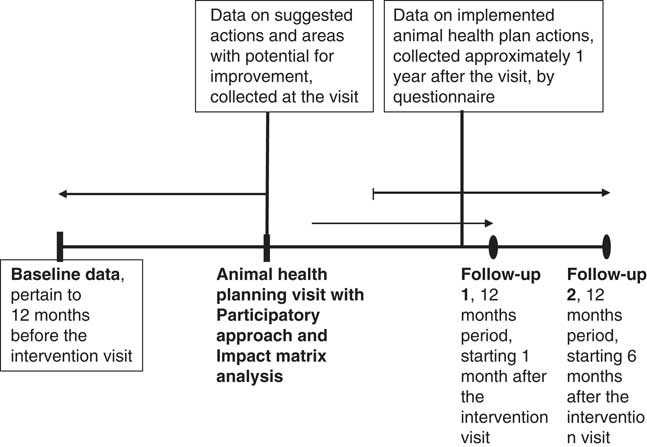
Three time periods were defined: (a) baseline, refers to data from the 12 months before the visit; (b) follow-up 1, refers to data from 1 to 13 months after the visit; (c) follow-up 2, refers to data from 6 to 18 months after the visit (Figure 1). Data from the national recording systems were retrieved as relevant for each country. All countries had access to data from the official milk recording schemes, databases of artificial insemination or natural service information and data from the animal identification and registration databases. The different databases were in most cases separate entities, except in Sweden where all the information is maintained in a common database for dairy herds that participate in the official milk recording scheme. In all countries, permission from the participating farmers and database managers was obtained before data collection.
Illustrates the timeline of data collection. Baseline data pertains to 12 months before the farm visit, on organic dairy cattle farms, when the participatory approach with the Impact Matrix was performed. Follow-up 1 pertains to data from 1 until 13 months after the visit, and follow-up 2 pertains to data from 6 until 18 months after the visit.

The national recording systems are not harmonised and the method of record-keeping, as well as the amount of information recorded, differ. For the purpose of this study, only data that were available in all participating countries were used and transformed into a common structure.
Variables derived from data in the national recording systems, and calculated for baseline and follow-up 1 and 2, were:
∙ Cow mortality, defined as on-farm mortality of cows, that is, the number of cows that died or were euthanized on-farm divided by the sum of their days at risk of dying. Animals that were sold were censored on the day of leaving the herd.
∙ Calf mortality, defined as the number of calves that died between birth and 30 days of life divided by the sum of their days at risk of dying. Animals that were sold were censored on the day of leaving the herd.
∙ The proportion of prolonged calving intervals, used as a proxy for reproductive health, defined as the proportion of all individual calving intervals exceeding 400 days length (LeBlanc et al., Reference LeBlanc, Duffield, Leslie, Bateman, Keefe, Walton and Johnson2002; Dubuc et al., Reference Dubuc, Duffield, Leslie, Walton and LeBlanc2010), for all calvings during the respective time periods.
∙ Risk of ketosis, defined as the proportion of all test-days between 30 and 100 days after calving, during the respective time periods, with a fat/protein ratio above 1.5 (Heuer et al., Reference Heuer, Schukken and Dobbelaar1999).
∙ Prevalence of high SCCs, defined as the proportion of all test-days, during the respective time periods, with an SCC-value above 200 000 cells/ml in milk (Dohoo and Leslie, Reference Dohoo and Leslie1991).
∙ Herd size, defined as the number of calvings per time period (i.e. baseline, follow-up 1 and 2, respectively).
Variables derived from the visits were:
∙ actions, defined as the number of agreed actions put down in the herd health plan;
∙ udder health, area stated by the farmer to have the potential for improvement;
∙ reproduction, area stated by the farmer to have the potential for improvement; and
∙ metabolic disorders, area stated by the farmer to have the potential for improvement.
‘As stated by the farmer’ means that this was an area chosen in response to the question ‘What would you like to improve?’
A variable derived from the follow-up questionnaires was:
∙ proportion of implemented actions, defined as no answer, no actions implemented,<50% implementation, 50% to 75% implementation, >75% implementation.
Statistical analyses
The change in the animal health variables during each of the two 12-month periods, calculated as the difference between each of the two follow-up periods and baseline data (see Figure 1), was analysed by multivariable linear regression models. The explanatory variables assumed to influence each particular outcome were included in the respective models. Hence, the number of explanatory variables varied for each model. The linearity assumption for the association of continuous explanatory variables was checked by adding a centred and squared term, but none of those were found to be significant. Residuals were checked for normal distribution and heteroscedasticity, and none of these assumptions were violated. All statistical analyses were performed using SAS® version 9.4 (SAS Institute Inc., Cary, NC, USA).
Results
Herd health planning
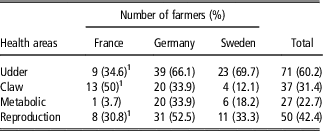
Health areas with potential for improvement, as stated by the farmer at the visit are presented in Table 1.
Distribution of animal health areas with potential for improvement, as stated by farmers (multiple answers possible)

Data from 119 organic dairy cattle farms in France, Germany and Sweden.
1 Data from one herd missing.
The number of actions per farm ranged from 0 to 22 and varied between countries. The respective median (lower quartile, upper quartile) was 1 (0, 3) in France, 7 (5, 10) in Germany and 15 (11, 20) in Sweden. No actions were identified for 10 farms in France and one farm in Germany.
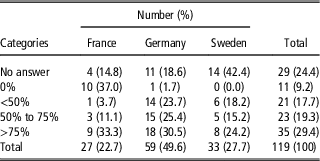
A total of 94 follow-up questionnaires were completed, giving a response rate of 93% in France, 83% in Germany and 61% in Sweden. The overall proportion of implemented actions per farm varied between 0% and 100% (median 67%, lower quartile 40%, upper quartile 83%). The proportions of implemented actions are presented in Table 2.
Proportion of implemented animal health plan actions in 119 organic dairy cattle farms in France, Germany and Sweden

Reasons for non-implementation were indicated in 60% of the questionnaires. The most frequent reasons were constraints related to housing and/or construction, followed by time limitations and costs/financial limitations.
Changes in herd health variables
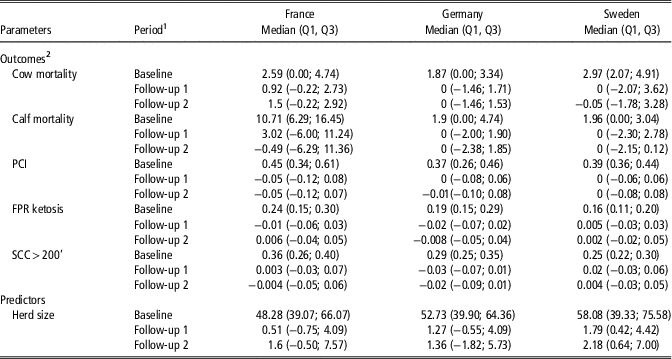
Table 3 presents descriptive statistics of the herd health variables, by country. The biggest difference between the countries, at baseline, was found for calf mortality where the ranges were as follows: France 0 to 42, Germany 0 to 17 and Sweden 0 to 10 . None of the herds decreased in the number of calvings (herd size) by more than 5%, whereas four herds increased by more than 5%, two of these increased by more than 10% during the study period.
Descriptive statistics over continuous animal health parameters at baseline and difference after two 12-month follow-up periods, in 119 organic dairy cattle herds in France, Germany and Sweden

1 Periods are as follows: baseline refers to the 12 months before the farm visit; follow-up 1 refers to the 12 months starting 1 month after the farm visit and is the difference between this period and baseline; follow-up 2 refers to the 12 months starting 6 months after the farm visit and is the difference between this period and baseline.
2 Outcomes are as follows: PCI=proportion of prolonged (>400 days) calving intervals, FPR ketosis=proportion of milk-tests with a fat–protein ratio >1.5, as indicator of ketosis, SCC>200’=proportion of milk-tests with somatic cell count in milk over 200 000 cells/ml.
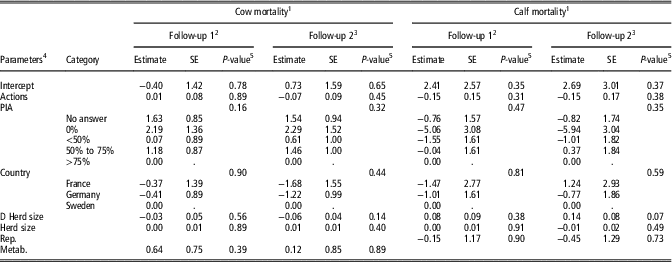
No significant changes were found in cow mortality and calf mortality after the on-farm discussions and herd health planning (Table 4).
Results from the multivariable linear regression analysis of the associations between herd parameters and the change in cow and calf mortality at follow-up in 119 organic dairy cattle herds in France, Germany and Sweden

1 Cow mortality=number of cows that died or were euthanized on-farm divided by a number of (cow) days at risk; calf mortality=number of calves that died between birth and 30 days of life divided by their days at risk of dying.
2 Follow-up 1 pertains to the 12 months starting 1 month after the farm visit and is the difference between follow-up 1 and baseline.
3 Follow-up 2 pertains to the 12 months starting 6 months after the farm visit and is the difference between follow-up 2 and baseline.
4 Parameters are as follows: Actions=number of actions put down in the health plan; PIA=proportion implemented actions; D Herd size=difference in herd size; Rep=reproduction as an area with potential for improvement stated by the farmer; Metab=metabolic disorder as an area with potential for improvement stated by the farmer.
5 Overall P-values.
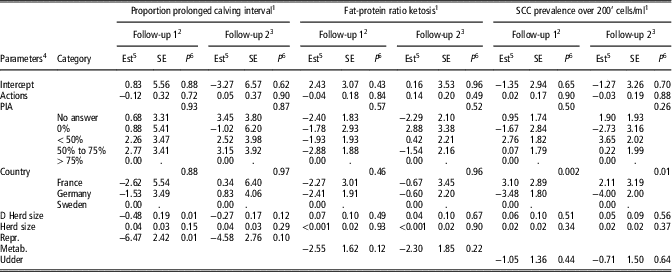
A significant association was seen between change in udder health, as measured by the SCC, and country. Also, at the first follow-up, a significant association was found between change in the proportion of prolonged calving interval and the farmers’ desire to improve reproductive health as well as with an increase in herd size, but this was not seen at the second follow-up (Table 5).
Results from the multivariable linear regression analysis of the associations between herd parameters and the change in proportion of prolonged calving interval (>400 days), risk of ketosis (proportion of milk-tests with fat–protein ratio >1.5) and somatic cell count (SCC) prevalence over 200’ cells/ml, at follow-up in 119 organic dairy cattle herds in France, Germany and Sweden

1 Multiplied by 100, for readable decimals in the table.
2 Follow-up 1 pertains to the 12 months starting 1 month after the farm visit and is the difference between follow-up 1 and baseline.
3 Follow-up 2 pertains to the 12 months starting 6 months after the farm visit and is the difference between follow-up 2 and baseline.
4 Parameters are as follows: Intercept; Actions=number of actions put down in the health plan; PIA=proportion implemented actions; Country; D Herd size=difference in herd size; Herd size; Repr.=reproduction as area with potential for improvement stated by the farmer; Metab.=metabolic disorder as area with potential for improvement stated by the farmer; Udder=udder disorder as area with potential for improvement stated by the farmer.
5 Est=Estimate.
6 Overall P-values.
Discussion
The number of actions in the herd health plans differed between the three countries. In France, there were few actions in each plan, as compared with Sweden and Germany. One explanation for the observed difference between the countries was the difference in the proportion of farms with any action. In France, 63% of the farms had specific actions in their plan, as compared with 98% of the German herds and all of the Swedish herds. In a study by Duval et al. (Reference Duval, Fourichon, Madouasse, Sjöström, Emanuelson and Bareille2016b) a higher degree of implementation of health indicators could be found in Sweden compared with France, suggesting that Swedish dairy farmers may be more used to herd health planning activities than French dairy farmers, which may explain the observed differences.
The median degree of implementation (67%) for all study herds was similar or higher to what has been achieved in other intervention studies (Green et al., Reference Green, Leach, Breen, Green and Bradley2007; Tremetsberger et al., Reference Vaarst and Alrøe2015). The involvement of all relevant actors in health planning very likely resulted in a choice of actions that were in line with the farmer’s own preferences. However, these preferences may have changed over the course of the study, this being the reason for non-implementation of some of the actions. Other barriers to implementation were time and cost related. This is in accordance with Tremetsberger et al. (Reference Vaarst and Alrøe2015), who found the implementation rate of actions to improve daily management routines to be almost twice as high as the implementation of changes in farm buildings and equipment. Rebuilding or major reconstruction would probably exceed available resources, especially within the limited time of this study.
The participating farmers, veterinarians and advisors displayed a very positive attitude and enthusiasm towards this structured participatory approach. The initial session was very much a participatory process, even though it was facilitated by the researcher. Farmers stated that this participatory approach made them take equal part of the discussions on appropriate actions. This was contrasted to previous experiences of more one-way (or even top-down) communication. During the talks, advisors and veterinarians gained insight into why previous advice had not been implemented, and the farmers could avoid getting contradictory advice. Similar experiences are reflected in previous studies by Derks et al. (Reference Derks, van Woudenbergh, Boender, Kremer, van Werven and Hogeveen2013) and Anneberg et al. (Reference Anneberg, Østergaard, Ettema and Kudahl2016). Vaarst et al. (Reference Vester2011) stated that continuous farm development requires an on-going dynamic health planning process involving agreed action and follow-up.
The most consistent and significant result of the study was the association between the udder health indicator and country. Several previous publications have addressed the association between health planning and udder health (Green et al., Reference Green, Leach, Breen, Green and Bradley2007; Ivemeyer et al., Reference Ivemeyer, Smolders, Brinkmann, Gratzer, Hansen, Henriksen, Huber, Leeb, March, Mejdell, Nicholas, Roderick, Stöger, Vaarst, Whistance, Winckler and Walkenhorst2012; Tremetsberger et al., Reference Vaarst and Alrøe2015), all demonstrating positive changes in udder health parameters after subsequent follow-up. However, in our study, only herds in Germany improved the udder health. This could be because many German farmers saw potential for improvement in terms of udder health on their farms and also had a high implementation rate. In comparison, the French herds had poorer udder health than German herds, but the farmers saw more potential for improvement in claw health. The threshold level of 200 000 cells/mL for SCC, the indicator for udder health, has ever since Dohoo and Leslie (Reference Dohoo and Leslie1991) been a commonly used value and was found to be a reasonable compromise within the project group. In a limited study of the farms in the project, the threshold level did not affect the ranking of the farms (Sjöström et al., Reference Stengärde, Hultgren, Tråvén, Holtenius and Emanuelson2015). A limitation is that control herds were not included in this study, and therefore it cannot be assessed if the observed changes may be related to other external factors occurring at the same time as the interventions.
To further motivate farmers to implement changes, benchmarking could be a useful approach (Chapinal et al., Reference Chapinal, Weary, Collings and von Keyserlingk2014). This, however, requires access to data on herd health indicators from other herds and such information is usually limited (Whay et al., Reference Whay, Main, Green and Webster2003; Huxley et al., Reference Huxley, Burke, Roderick, Main and Whay2004), although available, for example Scandinavian dairy herds (Emanuelson, Reference Emanuelson1988; Olsson et al., Reference Rehman, McKemey, Yates, Cooke, Garforth, Tranter, Park and Dorward2001). In this study, this limitation affected which animal health indicators were possible to evaluate. Reproduction diseases such as cystic ovaries, retained placenta and metritis are not recorded routinely in all countries in the study. As these diseases have a substantial effect on the reproductive performance of the herd, this aspect was monitored as a proportion of prolonged calving intervals (LeBlanc et al., Reference LeBlanc, Duffield, Leslie, Bateman, Keefe, Walton and Johnson2002; Dubuc et al., Reference Dubuc, Duffield, Leslie, Walton and LeBlanc2010). There was a significant association between the proportion of prolonged calving intervals and the farmer’s expressed wish to improve reproductive health, but this was not, as would have been expected, more prominent in the second follow-up period. The observed association with change in herd size could be due to the farmers taking actions such as culling cows with reproduction problems and thereby leaving room for cows with better reproductive performance when expanding the herd size (Denis-Robichaud et al., Reference Denis-Robichaud, Cerri, Jones-Bitton and LeBlanc2018). However, it cannot be excluded that some of the farmers were aiming for longer calving intervals, making this an unprecise measure of reproductive health, but it was used as a proxy due to the limitations in comparable indicators.
The implementation of herd health plan actions takes time and continuous interactive and iterative work, and the potential effects can also be expected to take time, depending on the specific actions. The time to follow-up is important for the ability to identify relevant associations between health planning and animal health. This is supported by March et al. (Reference March, Brinkmann and Winckler2011) who reported that the improvements in most health indicators were more pronounced in the 2nd year after implementation of health plans. To be able to see trends in herd health 1 year follow-up periods were used, to include all seasons. The first follow-up period was chosen to capture actions with more immediate effects and the second to capture actions with more delayed effects. The present study may have benefited from a longer follow-up period and of a more continuous follow-up work, which unfortunately was not possible within the framework of the research project, which mainly aimed to assess the participatory approach with impact matrix analysis. The lack of knowledge about organic dairy farming among veterinarians may have influenced the effect of the advisory activities, that may not have met the needs of the farmers. This may have contributed to the lack of improvement in animal health, despite the structured approach of the impact matrix method. (Kristensen and Jakobsen, Reference Kristensen and Jakobsen2011; Vaarst and Alrøe, Reference Vaarst, Nissen, Østergaard, Klaas, Bennedsgaard and Christensen2012; Duval et al., Reference Duval, Bareille, Fourichon, Madouasse and Vaarst2016a). Even when farmers are motivated to make changes, and have the necessary knowledge to improve herd health, implementation of actions is often lacking (LeBlanc et al., Reference LeBlanc, Lissemore, Kelton, Duffield and Leslie2006; Jones et al., Reference Jones, Sok, Tranter, Blanco-Penedo, Fall, Fourichon, Hogeveen, Krieger and Sundrum2016). Previous studies have also concluded that improvements are more difficult to achieve when several issues are addressed simultaneously (Whay et al., Reference Whay, Main, Green and Webster2003; Tremetsberger and Winckler, Reference van Soest, Mourits and Hogeveen2015), as was the case in the present study. Data limitations may also have contributed to the lack of associations detected in the current study.
The selection of study farms was not random, as the sampling frame consisted of farmers that were willing to participate. However, evaluations of the selected farms by Krieger et al. (Reference Krieger, Hoischen-Taubner, Emanuelson, Blanco-Penedo, de Joybert, Duval, Sjöström, Jones and Sundrum2017a) and van Soest et al. (Reference Stiglbauer, Cicconi-Hogan, Richert, Schukken, Ruegg and Gamroth2015) indicate a fair representativity of organic herds in the studied countries.
Although the degree of implementation of actions was quite high, improvement of animal health could not be linked to the herd health planning approach. However, the approach was highly appreciated by the participants and deserves further study.
Acknowledgements
The authors wish to thank the farmers for their participation and access their data. The authors also thank the advisors and veterinarians who participated in the project. This project received funding from the European Union’s Seventh Framework Programme for Research, Technological Development and Demonstration under grant agreement number 311824 (IMPRO).
Declaration of interest
None.
Ethics statement
All animals in this study were treated according to the ethical standards of the participating countries’ regulations. Competent authorities in all the three study countries declared that no ethical permission was required. Participation in the study was voluntary, and the farmers were informed about the purpose and methods of the study. They were assured that all information would be treated anonymously and that they could withdraw from the study at any time.
Software and data repository resources
None of the data were deposited in an official repository.