Implications
Production of bioethanol has resulted in production of million tonnes of coproducts such as dried distiller's grains with solubles (DDGS), which can be included in the rations of ruminants. There is a need to systematically determine the magnitude of the differences in nutrient availability among the coproducts of bioethanol production. This information is important to assist the new bioethanol plants to produce consistent coproducts and to assist nutritionists in designing low cost, efficient feed programs, which lead to a more competitive animal feeding industry. The results of the current study show that batch-to-batch variations in protein availability of bioethanol coproducts for dairy cattle were large enough to be considered in ration formulation. Such variations might be an obstacle in including bioethanol coproducts in dairy cattle rations; therefore, bioethanol plants should strive to minimize them by applying new production methods.
Introduction
Use of bioethanol as fuel has resulted in the production of large volumes of new coproducts such as wheat dried distiller's grains with solubles (DDGS), corn DDGS and wheat/corn blend DDGS (Robinson et al., Reference Robinson, Karges and Gibson2008; Nuez-Ortín and Yu, Reference Nuez-Ortín and Yu2009). Increased availability of these different types of bioethanol coproducts has led to increased interest for systematic evaluation of these coproducts in terms of nutrient availability and variation among different types of DDGS and between different batches within DDGS type. With this data, one can formulate diets with maximum accuracy. Recently, a comprehensive study was carried out with detailed chemical composition, mineral concentrations, protein and carbohydrate sub-fractions associated with different degradation rates, and energy values of different types of DDGS from different bioethanol plants (Nuez-Ortín and Yu, Reference Nuez-Ortín and Yu2009, Reference Nuez-Ortín and Yu2010a and Reference Nuez-Ortín and Yu2010b). These studies concluded that nutritive value including predicted digested and absorbed true protein in the small intestine (DVE) not only differed between DDGS types, but to a lesser extent also between bioethanol plants. This was mainly attributed to variability in nutrient compositions of parental feedstocks, different implemented fermentation, distillation and drying methods and variation in the amount of distiller's solubles added back to DDGS. However, information on availability of protein from DDGS as affected by batch is limited and is based on older versions of protein evaluation systems, particularly for wheat DDGS (WDDGS) and blend DDGS (Nuez-Ortín and Yu, Reference Nuez-Ortín and Yu2010b).
Nuez-Ortín and Yu (Reference Nuez-Ortín and Yu2010b) demonstrated that all DDGS types are good sources of DVE. Various feedstuff evaluation systems have been developed to describe digestion and metabolism of nitrogen in ruminants (Institut National de la Recherche Agronomique, 1978; Agricultural Research Council, 1984; NKJ Protein Group, 1985; Vérité and Geay, Reference Vérité and Geay1987; Agricultural and Food Research Council, 1992; National Research Council (NRC), 2001; Thomas, Reference Thomas2004; van Duinkerken et al., Reference Van Duinkerken, Blok, Bannink, Cone, Dijkstra, Van Vuuren and Tamminga2011). Despite using different approaches, they all have one common goal, which is evaluating the protein value of feeds and evaluating nutrient requirements of dairy cattle in terms of digested and absorbed true protein in the small intestine. The revised DVE/OEB protein evaluation system (Van Duinkerken et al., Reference Van Duinkerken, Blok, Bannink, Cone, Dijkstra, Van Vuuren and Tamminga2011) evaluates the protein value of a feed based on DVE and rumen degradable protein balance (OEB). Input values for calculating these parameters are generated by fractionating chemical constituents of feeds into their inherent fractions (soluble washout fraction, insoluble washout fraction, non-washout potentially degradable fraction and non-degradable fraction) and determining the behavior of these fractions in situ (Van Duinkerken et al., Reference Van Duinkerken, Blok, Bannink, Cone, Dijkstra, Van Vuuren and Tamminga2011).
The objective of this study was to determine variation in protein value for three types of DDGS and for different batches within DDGS type using the approach of Van Duinkerken et al. (Reference Van Duinkerken, Blok, Bannink, Cone, Dijkstra, Van Vuuren and Tamminga2011).
Material and methods
Sample collection and preparation
From February 2009 to January 2010, seven different batches of WDDGS and blend DDGS (BDDGS1, wheat to corn ratio 70 : 30; BDDGS2, wheat to corn ratio 50 : 50) were collected from two recently opened bioethanol processing plants located in Saskatchewan, Canada. These bioethanol plants are equipped with the most updated fermentation techniques to manufacture bioethanol. Drying temperature in the bioethanol plants for all batches of WDDGS was 85°C and for all batches of BDDGS1 and BDDGS2 was 125°C.
Three different batches of WDDGS were sampled on December 13 and 27 of 2009 and January 11 of 2010. Two batches for both blend DDGS types were collected in 2009 on February 9 and 17 for BDDGS1 and at February 6 and March 9 for BDDGS2. On a given sample day, three samples per batch of DDGS were taken over a period of 24 h; however, only two samples were used for chemical analyses and in situ studies. Samples from the same bioethanol plant were used to study the effect of batch on ruminal availability of nutrients for microbial protein synthesis and truly digested and absorbed protein supply to dairy cattle.
Animals and diets
Four rumen cannulated (internal diameter 10 cm; Bar Diamond Inc., Parma, ID, USA) non-pregnant dry Holstein Friesian cows were used in an in situ trial, which had been reviewed and approved by the Animal Care Committee of the University of Saskatchewan (Animal Use Protocol No. 19910012). The cows were individually housed in the pens at the experimental farm of the University of Saskatchewan (Saskatoon, SK, Canada) and were cared for in accordance with guidelines of the Canadian Council on Animal Care (CCAC) guidelines (CCAC, 1993). The cows had free access to water and were fed 14 kg dry matter (DM)/day total mixed ration twice daily in equal portions at 0800 and 1600 h. The total mixed ration consisted of 56.8% barley silage, 10.2% alfalfa hay, 4.5% dehydrated alfalfa pellets and 28.5% concentrates on a DM basis as described in Yu et al. (Reference Yu, Hart and Du2009).
Rumen incubation procedure
In order to have a homogeneous sample, the DDGS samples were processed using a laboratory scale roller mill (gap, 0.203 mm; Apollo Machine and Products Ltd, Saskatoon, SK, Canada) before the in situ trial. In situ rumen degradation kinetics were determined as described by Yu et al. (Reference Yu, McKinnon and Christensen2004). Approximately 7 g of sample were weighed into pre-weighed numbered nylon bags (10 × 20 cm; pore size of 41 μm; Nitex 03-41/31 monofilament open mesh fabric, Screentec Corp., Mississauga, ON, Canada), resulting in a sample-to-bag surface ratio of 17.5 mg/cm2. The bags were randomly incubated in the rumen of the cows and incubations were performed in two runs by the ‘all-out method’ (Nuez-Ortín and Yu, Reference Nuez-Ortín and Yu2009). A polyester mesh bag (45 cm × 45 cm with a 90 cm length of rope to be anchored to the cannula) was used to hold the bags in the rumen. For the incubation times of 72, 36, 12, 6 and 2 h, seven, six, five, four and two bags of each sample were incubated in the rumen of each cow, respectively. Immediately after retrieval, all bags were placed in cold tap water to stop the microbial fermentation and then washed manually five times in cold tap water followed by oven drying at 55°C for 48 h. The 0 h incubation samples were washed by the procedure described by Azarfar et al. (Reference Azarfar, Williams, Boer and Tamminga2007) to fractionate the washout fraction (W) into a water soluble fraction (S) and an insoluble fraction (WI). As the WI was almost zero, for the purpose of modeling it was assumed that the W fraction was equal to the S fraction. Incubation residues from the treatment bags were pooled within time and incubation run.
Chemical analysis
The samples and rumen residues were ground through a 1-mm screen (Retsch ZM-1, Brinkmann Instruments Ltd, Ontario, Canada) before chemical analysis, and analyzed for DM (Association of Official Analytical Chemists (AOAC), 1990; AOAC 930.15), ash (AOAC 942.05), CP (Leco protein/N analyzer, Model FP-528; Leco Corp., St. Joseph, MI, USA), NDF (Ankom A200 Filter Bag Technique; Ankom Technology, Fairport, NY, USA), starch (Megazyme total starch assay kit; Megazyme International Ltd, Wicklow, Ireland; McCleary et al., Reference McCleary, Gibson and Mugford1997), acid detergent insoluble CP (ADICP; Licitra et al., Reference Licitra, Hernandez and Van Soest1996) and neutral detergent insoluble CP (NDICP; Licitra et al., Reference Licitra, Hernandez and Van Soest1996). Amylase and sodium sulphite were used for NDF analysis. Additionally, original samples were analyzed for crude fat (CFat; AOAC 954.02) and ethanol soluble carbohydrates (ESC; Hall et al., Reference Hall, Hoover, Jennings and Miller Webster1999).
For all chemical analyses, samples were analyzed in duplicate and repeated if the error was higher than 5%.
Protein and carbohydrate fractionations
Protein and carbohydrates were fractionated using the approach described by Van Duinkerken et al. (Reference Van Duinkerken, Blok, Bannink, Cone, Dijkstra, Van Vuuren and Tamminga2011). Protein and carbohydrates (ESC, starch, NDF and residual non-starch polysaccharide (RNSP) calculated as organic matter (OM) − (CP + CFat + starch + ESC + NDF)) were partitioned into a truly soluble fraction (S), a washout insoluble fraction (WI), a non-washout potentially degradable fraction (D; calculated as (1000 − (S + WI) − U)) and a non-washout undegradable fraction (U; calculated as the asymptote of the degradation curve at infinite incubation time). The WI of CP was assumed to be zero in the current study as described earlier. The ESC is designated as the S fraction of carbohydrates and was assumed to degrade with a fractional degradation rate of 2.0/h in the rumen (Van Duinkerken et al., Reference Van Duinkerken, Blok, Bannink, Cone, Dijkstra, Van Vuuren and Tamminga2011). The rest of the carbohydrates were classified into NDF, RNSP and starch. The washout RNSP and starch (WIRNSP and WIStarch, respectively) were assumed to contain only insoluble material, whereas NDF was assumed to contain no washout material. As the incubation residues were not directly analyzed for CFat, the correction factors 65, 44, 17 and 3% of the original CFat were applied to calculate RNSP for the 0, 2, 6 and 12 h incubation residues, respectively (Van Duinkerken et al., Reference Van Duinkerken, Blok, Bannink, Cone, Dijkstra, Van Vuuren and Tamminga2011).
The size of U fraction as well as fractional degradation rates of D for CP, NDF and RNSP (Kd, /h) were calculated by fitting the degradation data to a first-order kinetics model described by Robinson et al. (Reference Robinson, Fadel and Tamminga1986) and Tamminga et al. (Reference Tamminga, van Straalen, Subnel, Meijer, Steg, Wever and Blok1994):
 $${\rm{R(t)}}\,{\rm{ = }}\,{\rm{U}}\,{\rm{ + }}\,{\rm{D}}\,\times \,{\rm{e}}{{{}}^{{\rm{ - Kd}}\,\times \,{\rm{(t}}\,{\rm{ - }}\,{\rm{lag)}}}} $$
where R(t) is residue left after t h rumen incubation (g/kg), lag is lag time (h) and Kd is fractional degradation rate of the D fraction (/h).
As U and lag are assumed to be zero for starch (Tamminga et al., Reference Tamminga, van Straalen, Subnel, Meijer, Steg, Wever and Blok1994), the following model was applied to estimate Kd of the starch D fraction:
 $${\rm{R (t)}}\,{\rm{ = }}\,{\rm{(100}}\,{\rm{ - }}\,{\rm{W)}}\,\times \,{{{\rm{e}}}^{{\rm{ - Kd}}\,\times \,{\rm{t}}}} $$
where W is washout fraction. The parameters of models were estimated using NLIN procedure of SAS Institute (2003) with iterative least squares regression (Gauss–Newton method).
Owing to the lack of fit, effective rumen degradation was not determined for RNSP of BDDGS1 and BDDGS2.
Calculation of truly digested and absorbed protein
Concepts and calculations to predict the truly digested and absorbed protein supply (DVE) and rumen degraded protein balance (OEB) were according to those in the 2010 DVE/OEB system, outlined in detail by Van Duinkerken et al. (Reference Van Duinkerken, Blok, Bannink, Cone, Dijkstra, Van Vuuren and Tamminga2011).
Rumen degraded protein balance is calculated as the difference between the microbial protein synthesized based on the rumen degradable protein (MCPRDP) and that synthesized based on rumen fermentable organic matter (MCPFOMr; Van Duinkerken et al., Reference Van Duinkerken, Blok, Bannink, Cone, Dijkstra, Van Vuuren and Tamminga2011). Microbial protein synthesized based on available rumen fermentable organic matter (FOMr) is a function of ATP yield of each in situ fraction, yield of microbial DM (Pirt, Reference Pirt1965; Van Duinkerken et al., Reference Van Duinkerken, Blok, Bannink, Cone, Dijkstra, Van Vuuren and Tamminga2011), and the quantities of each specific in situ fraction and their fractional degradation and passage rates (Van Duinkerken et al., Reference Van Duinkerken, Blok, Bannink, Cone, Dijkstra, Van Vuuren and Tamminga2011).
Truly digested and absorbed protein is calculated as:
 $$ {\rm{DVE}}\,{\rm{ = }}\,{\rm{DMCP}}\,{\rm{ + }\,{\rm{DRUP}}\,{\rm{ - }}\,{\rm{DMFP}} $$
where intestinally available microbial CP (DMCP), intestinally available rumen undegraded protein (DRUP) and endogenous protein loss (DMFP) are calculated as described by Van Duinkerken et al. (Reference Van Duinkerken, Blok, Bannink, Cone, Dijkstra, Van Vuuren and Tamminga2011).
Statistical analysis
Statistical analyses were carried out using the MIXED procedure of SAS 9.2 (SAS Institute, 2003). The models used were:
 $$ {{Y}_{ijk}}\,{\rm{ = }}\,\mu \, + \,{{F}_i}\, + \,{{R}_j}\, + \,{{e}_{ijk}} $$
 $$ {{Y}_{ijk}}\,{\rm{ = }}\,\mu \, + \,{{B}_i}\, + \,{{R}_j}\, + \,{{e}_{ijk}} $$
where Yijk is the dependent variable under examination; μ is the population mean for the variable, Fi is the fixed effect of feed sources (i = 3; WDDGS, BDDGS1 and BDDGS2), Bi is the fixed effect of batch (i = 3 for WDDGS and 2 for BDDGS1 and BDDGS2), Rj is the random effect of in situ incubation run (j = 2; 1 and 2) and eijk is the random error associated with the observation ij. Model 1 was used to study the effects of DDGS type. We used the second model to compare the different batches within DDGS type. In the first model, batch and runs were regarded as experimental replicates (n = 3 batches × 2 in situ runs = 6 replicates for WDDGS and n = 2 batches × 2 in situ runs = 4 replicates for BDDGS1 and BDDGS2) and in the second model, sample and runs (n = 2 samples × 2 in situ incubation runs = 4 replicates) were considered as replicates.
For all statistical analyses, significance was declared at P < 0.05. The Fisher's protected least significant difference (LSD) test was used for multiple treatment comparisons using the LSMEANS of SAS 9.2 (SAS Institute, 2003) with letter grouping obtained using SAS pdmix800 macro (Saxton, Reference Saxton1998). The residual analysis was carried out to test the model assumptions using the UNIVARIATE procedure of SAS 9.2 (SAS Institute, 2003) with NORMAL and PLOT options.
Relationships between ADICP, DRUP and DVE values were analyzed using the CORR procedure of SAS using a Pearson correlation method.
Results
Effects of DDGS type and batches within DDGS type on the chemical composition
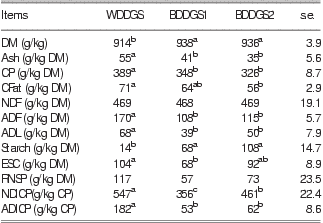
The effects of DDGS type on chemical composition are presented in Table 1. WDDGS was higher in ash, CP, CFat (numerically higher than BBDGS1), ADF, ADL, sugars (numerically higher than BDDGS2), NDICP and ADICP, but lower in DM and starch than BDDGS1 and BDDGS2 (P < 0.05).
Detailed chemical composition of WDDGS and two DDGS blends
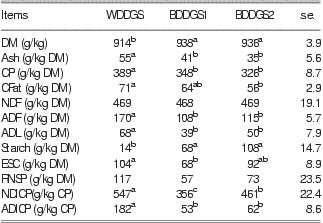
WDDGS = wheat DDGS; DDGS = dried distiller's grains with solubles; BDDGS1 = blend DDGS1 (corn to wheat ratio 30% : 70%); BDDGS2 = blend DDGS2 (corn to wheat ratio 50% : 50%); DM = dry matter; CFat = crude fat; ESC = ethanol soluble carbohydrates; RNSP = residual non-starch polysaccharides; NDICP = neutral detergent insoluble CP; ADICP = acid detergent insoluble CP.
a–cMeans with the different letters in the same row are significantly different (P < 0.05). Multi-treatment comparison method: Fisher's protected least significant difference (LSD).
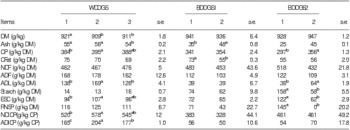
Detailed chemical profiles for different batches of WDDGS, BDDGS1 and BDDGS2 are presented in Table 2. There were significant differences between the three batches of WDDGS in DM, ash, CP, ADL, sugars, NDICP and ADICP, whereas the two batches of BDDGS1 only differed in ash and CFat content. In BDDGS2, batch1 had 20%, 75% and 61% less CP, ADL and SCP and 63.5% and 65% more starch and sugars compared with batch2, respectively.
Detailed chemical composition of different batches within WDDGS and two DDGS blends

WDDGS = wheat DDGS; DDGS = dried distiller's grains with solubles; BDDGS1 = blend DDGS1 (corn to wheat ratio 30% : 70%); BDDGS2 = blend DDGS2 (corn to wheat ratio 50% : 50%); DM = dry matter; CFat = crude fat; ESC = ethanol soluble carbohydrates; RNSP = residual non-starch polysaccharides; NDICP = neutral detergent insoluble CP; ADICP = acid detergent insoluble CP.
a–cMeans with the different letters in the in the same row within each type of DDGS are significantly different (P < 0.05). Multi-treatment comparison method: Fisher's protected least significant difference (LSD).
Effects of DDGS type and batch within DDGS type on the kinetics of degradation in situ
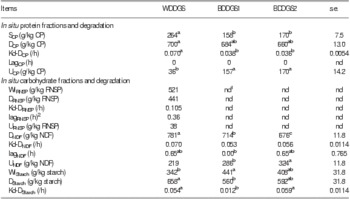
WDDGS had a higher SCP, higher DCP (numerically higher than BDDGS1), higher Kd-DCP and a lower UCP compared with BDDGS1 and BDDGS2 (Table 3). The lagCP was higher in BDDGS1 compared with WDDGS and BDDGS2. Despite a higher ADICP in WDDGS (Table 1), UCP was lower in WDDGS compared with both DDGS blends (Table 3). WDDGS had a higher DNDF and lower UNDF than BDDGS1 and BDDGS2 (Table 3). WDDGS had a significantly lower WIStarch, higher DStarch and higher Kd-DStarch than BDDGS1, while BDDGS2 were in between.
In situ protein and carbohydrate fractions, fractional degradation rates and lag time for WDDGS and two DDGS blends based on the 2010 DVE/OEB protein evaluation system

WDDGS = wheat DDGS; DDGS = dried distiller's grains with solubles; DVE = truly digested and absorbed protein in the small intestine (Van Duinkerken et al., Reference Van Duinkerken, Blok, Bannink, Cone, Dijkstra, Van Vuuren and Tamminga2011); OEB = rumen degraded CP balance; BDDGS1 = blend DDGS1 (corn to wheat ratio 30% : 70%); BDDGS2 = blend DDGS2 (corn to wheat ratio 50% : 50%).
Carbohydrate and protein fractions: S = washout soluble fraction; D = non-washout potentially degradable fraction; Kd = fractional degradation rate for the D fractions (Robinson et al, Reference Robinson, Fadel and Tamminga1986; Tamminga et al., Reference Tamminga, van Straalen, Subnel, Meijer, Steg, Wever and Blok1994); U = undegradable fraction; WI = washout insoluble fraction; RNSP = residual non-starch polysaccharides (Van Duinkerken et al., Reference Van Duinkerken, Blok, Bannink, Cone, Dijkstra, Van Vuuren and Tamminga2011).
1nd = not determined. Owing to the lack of fit, fractional degradation rate for the D fraction was not determined for RNSP of BDDGS1 and BDDGS2.
2lag = lag time before fermentation initiated.
a–cMeans with the different letters in the same row are significantly different (P < 0.05). Multi-treatment comparison method: Fisher's protected least significant difference (LSD).
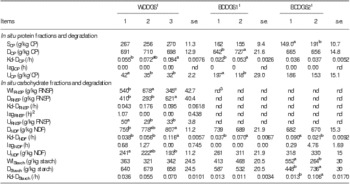
Comparing the three batches of WDDGS revealed that they differed in Kd-DCP, UCP, WIRNSP, DRNSP, URNSP, DNDF, Kd-DNDF and UNDF (Table 4). Significant differences in batches of BDDGS1 were observed for DCP, Kd-DCP, UCP and Kd-DNDF (Table 4). The first batch of BDDGS2 had a lower SCP, higher Kd-DNDF, higher WIStarch, lower DStarch and lower Kd-DStarch than the second batch (Table 4).
In situ protein and carbohydrate fractions, ruminal degradation rates and lag time for different batches within WDDGS and two DDGS blends

WDDGS = wheat DDGS; DDGS = dried distiller's grains with solubles; BDDGS1 = blend DDGS1 (corn to wheat ratio 30% : 70%); BDDGS2 = blend DDGS2 (corn to wheat ratio 50% : 50%).
Carbohydrate and protein fractions: S = washout soluble fraction; D = non-washout potentially degradable fraction; Kd = fractional degradation rate for the D fractions (Robinson et al., Reference Robinson, Fadel and Tamminga1986; Tamminga et al., Reference Tamminga, van Straalen, Subnel, Meijer, Steg, Wever and Blok1994); U = undegradable fraction; WI = washout insoluble fraction; RNSP = residual non-starch polysaccharides (Van Duinkerken et al., Reference Van Duinkerken, Blok, Bannink, Cone, Dijkstra, Van Vuuren and Tamminga2011).
1Three batches of WDDGS and two batches for both DDGS blends.
2lag = lag time before fermentation initiated.
3nd = not determined. Owing to the lack of fit, fractional degradation rate for the D fraction was not determined for RNSP of BDDGS1 and BDDGS2.
a–cMeans with the different letters in the same row within each type of DDGS are significantly different (P < 0.05). Multi-treatment comparison method: Fisher's protected least significant difference (LSD).
Effects of DDGS type and batch within DDGS type on total true digested and absorbed protein supply to dairy cattle
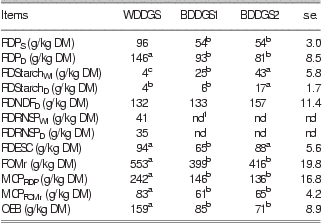
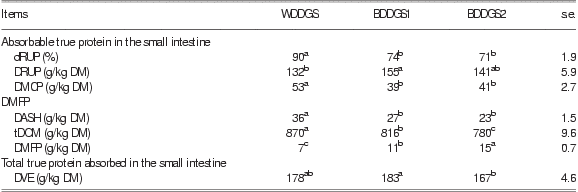
The effects of DDGS type on the ruminal availability of nutrients for microbial protein synthesis and truly digested and absorbed protein in the small intestine are shown in Tables 5 and 6. The higher amounts of RDP and FOMr in WDDGS resulted in a higher MCPRDP, MCPFOMr, OEB (Table 5) and DMCP and a lower DRUP (Table 6) compared with BDDGS1 and BDDGS2. However, the lower DRUP in WDDGS compared with both DDGS blends was counterbalanced by a higher DMCP and a lower DMFP in WDDGS, which resulted in similar DVE value for WDDGS, BDDGS1 and BDDGS2 (Table 6). The OEB values were positive for all DDGS samples; WDDGS was the highest followed by the BDDGS1 and BDDGS2. The blend DDGS1 had the highest DRUP (Table 6), which resulted in a significantly higher DVE compared with BDDGS2. The results indicated that DDGS type had a profound effect on ruminal degradation of protein and therefore on both the MCP synthesized in the rumen and on the OEB.
Estimated ruminal availability of nutrients for microbial protein synthesis in WDDGS and two DDGS blends based on the 2010 DVE/OEB protein evaluation system
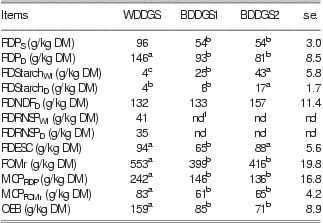
WDDGS = wheat DDGS; DDGS = dried distiller's grains with solubles; DVE = truly digested and absorbed protein in the small intestine (Van Duinkerken et al., Reference Van Duinkerken, Blok, Bannink, Cone, Dijkstra, Van Vuuren and Tamminga2011); OEB = rumen degraded CP balance; BDDGS1 = blend DDGS1 (corn to wheat ratio 30% : 70%); BDDGS2 = blend DDGS2 (corn to wheat ratio 50% : 50%); RDP = rumen degraded protein; S = washout soluble fraction; DM = dry matter; D = potentially degradable fraction calculated as: (1000 − (S + WI + U)); RDStarch = rumen degraded starch; WI = washout insoluble fraction; RDNDF = rumen degradable NDF; RNSP = residual non-starch polysaccharides (Van Duinkerken et al., Reference Van Duinkerken, Blok, Bannink, Cone, Dijkstra, Van Vuuren and Tamminga2011); RDRNSP = rumen degraded residual non-starch polysaccharides; RDESC = rumen degraded ESC; FOMr = rumen fermentable organic matter; MCPRDP = microbial protein synthesized from RDP (RDPS + RDPD); MCPFOMr = microbial protein synthesized from FOMr.
1nd = not determined. Owing to the lack of fit, effective rumen degradation was not determined for RNSP of BDDGS1 and BDDGS2.
a–cMeans with the different letters in the same row are significantly different (P < 0.05). Multi-treatment comparison method: Fisher's protected least significant difference (LSD).
Intestinal availability of protein in WDDGS and two DDGS blends based on the 2010 DVE/OEB 2010 protein evaluation system
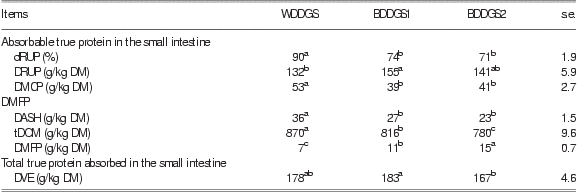
WDDGS = wheat DDGS; DDGS = dried distiller's grains with solubles; DVE = truly digested and absorbed protein in the small intestine (Van Duinkerken et al., Reference Van Duinkerken, Blok, Bannink, Cone, Dijkstra, Van Vuuren and Tamminga2011); OEB = rumen degraded CP balance; BDDGS1 = blend DDGS1 (corn to wheat ratio 30% : 70%); BDDGS2 = blend DDGS2 (corn to wheat ratio 50% : 50%); dRUP = intestinal digestion of rumen undegraded protein calculated as RUP − U/RUP × 100; DM = dry matter; DRUP = intestinally available rumen undegraded protein; DMCP = intestinally available microbial protein; DASH = total digestible ash; tDOM = total digestible organic matter; DMFP = endogenous protein losses; DVE = truly digested and absorbed protein in the small intestine (Van Duinkerken et al., Reference Van Duinkerken, Blok, Bannink, Cone, Dijkstra, Van Vuuren and Tamminga2011).
a–cMeans with the different letters in the same row are significantly different (P < 0.05). Multi-treatment comparison method: Fisher's protected least significant difference (LSD).
Rumen degradation characteristics of BDDGS protein were not affected by corn to wheat ratio in bioethanol fermentation (Table 5). However, increasing the corn to wheat ratio in bioethanol fermentation decreased DRUP (numerically) and increased DMFP of BDDGS2, which resulted in a significantly lower DVE in BDDGS2 than in BDDGS1 (Table 6).
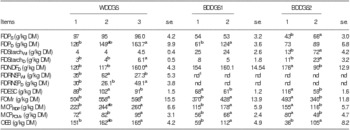
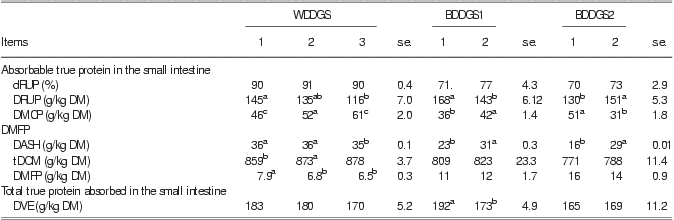
The effects of batch within DDGS type on ruminal availability of nutrients for microbial protein synthesis and intestinal availability of protein are presented in Tables 7 and 8. Differences between batches of WDDGS were observed for FOMr, MCPFOMr, MCPRDP and OEB. This is due to the differences in rumen degradable protein (RDPD), rumen degradable starch (RDStarchD), rumen degradable NDF (RDNDFD), rumen degradable WI and D of RNSP and rumen degradable ESC (RDESC; Table 7). Batches of BDDGS1 differed in RDPD, RDESC, FOMr, MCPFOMr, MCPRDP and OEB (Table 7). Batches of BDDGS2 differed in ruminal availability of nutrients for microbial protein synthesis resulting in different MCPFOMr, MCPRDP and OEB among batches (Table 7). Consequently, DRUP and DMCP differed significantly (P < 0.05) between the different batches of all three DDGS types. In spite of different DRUP and DMCP between different batches within all three DDGS types, DVE was only different between the batches of BDDGS1 (Table 8).
Estimated ruminal availability of nutrients for microbial protein synthesis in different batches within WDDGS and two DDGS blends

WDDGS = wheat DDGS; DDGS = dried distiller's grains with solubles; BDDGS1 = blend DDGS1 (corn to wheat ratio 30% : 70%); BDDGS2 = blend DDGS2 (corn to wheat ratio 50% : 50%); RDP = rumen degraded protein; S = washout soluble fraction; DM = dry matter; D = potentially degradable fraction calculated as: (100 − (S + WI + U)); RDStarch = rumen degraded starch; WI = washout insoluble fraction; RDNDF = rumen degradable NDF; RNSP = residual non-starch polysaccharides (Van Duinkerken et al., Reference Van Duinkerken, Blok, Bannink, Cone, Dijkstra, Van Vuuren and Tamminga2011); RDRNSP = rumen degraded residual non-starch polysaccharides; RDESC = rumen degraded ESC; FOMr = rumen fermentable organic matter; MCPRDP = microbial protein synthesized from RDP (RDPS + RDPD); MCPFOMr = microbial protein synthesized from FOMr; OEB = rumen degraded CP balance.
1nd = not determined. Owing to the lack of fit, effective rumen degradation was not determined for RNSP of BDDGS1 and BDDGS2.
a–cMeans with the different letters in the same row within each type of DDGS are significantly different (P < 0.05). Multi-treatment comparison method: Fisher's protected least significant difference (LSD).
Intestinal availability of protein in different batches within WDDGS and two DDGS blends
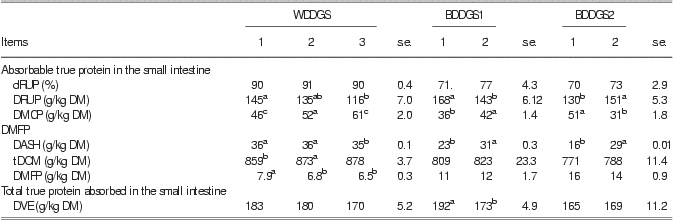
WDDGS = wheat DDGS; DDGS = dried distiller's grains with solubles; BDDGS1 = blend DDGS1 (corn to wheat ratio 30% : 70%); BDDGS2 = blend DDGS2 (corn to wheat ratio 50% : 50%); dRUP = intestinal digestion of rumen undegraded protein calculated as RUP − U/RUP × 100; DRUP = intestinally available rumen undegraded protein; DM = dry matter; DMCP = intestinally available microbial protein; DASH = total digestible ash; tDOM = total digestible organic matter; DMFP = endogenous protein losses; DVE = truly digested and absorbed protein in the small intestine (Van Duinkerken et al., Reference Van Duinkerken, Blok, Bannink, Cone, Dijkstra, Van Vuuren and Tamminga2011).
a–cMeans with the different letters in the same row within each type of DDGS are significantly different (P < 0.05). Multi-treatment comparison method: Fisher's protected least significant difference (LSD).
Discussion
The chemical profiles of DDGS samples were in the approximate range of those reported by others (NRC, 2001; Gibb et al., Reference Gibb, Hao and McAllister2008; Nuez-Ortín and Yu, Reference Nuez-Ortín and Yu2009). However, Nuez-Ortín and Yu (Reference Nuez-Ortín and Yu2009) reported lower ADL and ADICP values for WDDGS compared with our study. This discrepancy with those of our results reflects plant-to-plant variation in nutrient content of coproducts from bioethanol processing, which has been reported before (Robinson et al., Reference Robinson, Karges and Gibson2008; Belyea et al., Reference Belyea, Rausch, Clevenger, Singh, Johnston and Tumbleson2010). This is mainly attributed to different implemented fermentation, distillation and drying methods and variation in the amount of distiller's solubles added back to DDGS. Except for CP, ADF and ADL, differences in chemical components of WDDGS, BDDGS1 and BDDGS2 cannot be justified by the differences in the chemical compositions of their parental feedstock (Nuez-Ortín and Yu, Reference Nuez-Ortín and Yu2009). Higher CP, ADF and ADL content of WDDGS than BDDGS1 and BDDGS2 was attributed to the higher CP, ADF and ADL content of wheat compared with corn (Boila and Ingalls, Reference Boila and Ingalls1994; Nuez-Ortín, Reference Nuez-Ortín2010). As wheat contains more CP compared with corn (Boila and Ingalls, Reference Boila and Ingalls1994; Nuez-Ortín, Reference Nuez-Ortín2010), one may expect a higher CP content in the BDDGS as the ratio of wheat increases in the mixture. Indeed, such a trend was observed in our study as BDDGS1 had a numerically higher CP compared with BDDGS2. Analogous to findings of Nuez-Ortín and Yu (Reference Nuez-Ortín and Yu2009), SCP in the DDGS mainly consisted of non-protein nitrogen (Azarfar et al., Reference Azarfar, Jonker, Hettiarachchi-Gamage and Yu2011). There are some possible explanations for that. First during fermentation, soluble true proteins may have been fermented by yeast. Second, heat applied during the bioethanol production may have reduced the solubility of soluble true proteins. The first assumption is void as yeasts lack proteolytic enzymes responsible for protein degradation (Rose and Harrison, Reference Rose and Harrison1987). A third possibility is that the added urea as a source of nitrogen for yeast fermentation was not completely utilized by the yeasts before the end of incubation and therefore it may have ended up in the DDGS (Davis, Reference Davis2001). Significantly higher starch content in BDDGS1 and BDDGS2 compared with WDDGS was an indication of incomplete fermentation of starch. The values for sugars in our study were higher than those reported by Lanzas et al. (Reference Lanzas, Sniffen, Seoa, Tedeschi and Fox2007). During the production of DDGS, usually condensed distiller's solubles (CDS; with high-soluble sugar content) blend with wet distiller's grains, which will increase the sugar content of the final product (Kim et al., Reference Kim, Mosier, Hendrickson, Ezeji, Blaschek, Dien, Cotta, Dale and Ladisch2008).
Although DDGS from bioethanol processing plants have been extensively used as an ingredient in ruminant rations, concerns have been raised with regard to nutrient variability of these coproducts (Depenbusch et al., Reference Depenbusch, Coleman, Higgins and Drouillard2009; Mulrooney, et al., Reference Mulrooney, Schingoethe, Kalscheur and Hippen2009). Factors such as variability in nutrient profile of parental feedstocks, the extent of drying, drying temperature (Kingsly et al., Reference Kingsly, Ileleji, Clementson, Garcia, Maier, Stroshine and Radcliff2010), physical properties (e.g. particle size distribution; Liu, Reference Liu2009) and amounts of distiller's solubles added back to DDGS greatly affect the nutrient profiles of DDGS (Belyea et al., Reference Belyea, Eckhoff, Wallig and Tumbleson1998; Kleinschmit, et al., Reference Kleinschmit, Anderson, Schingoethe, Kalscheur and Hippen2007). Spieh et al. (Reference Spieh, Whitney and Shurson2002) reported that there was variation in chemical compositions of corn DDGS among bioethanol plants in South Dakota and Minnesota in a 3-year study. Similarly, Belyea et al. (Reference Belyea, Rausch and Tumbleson2004) also observed variations in the nutrient contents of corn DDGS among ethanol plants located in Minnesota in a 5-year study. However, they stated that the differences were small from a biological point of view. Our results indicated that, at least for batches of BDDGS2, variations in chemical compositions were large enough to be considered in ration formulation. Although no data on the amounts of CDS added were recorded, the visually darker color of the second batch compared with the first batch of BDDGS2 implied a higher inclusion of CDS in batch1 than in batch2. The CDS inclusion level in the process of DDGS production is among the most important factors that affect physico-chemical properties of the final products (Kingsly et al., Reference Kingsly, Ileleji, Clementson, Garcia, Maier, Stroshine and Radcliff2010).
To our knowledge, no information is available on kinetics of rumen degradation for wheat based as well as blend DDGS using the updated DVE/OEB protein evaluation system (Van Duinkerken et al., Reference Van Duinkerken, Blok, Bannink, Cone, Dijkstra, Van Vuuren and Tamminga2011). Using the previous DVE/OEB protein evaluation system (Tamminga et al., Reference Tamminga, van Straalen, Subnel, Meijer, Steg, Wever and Blok1994), Nuez-Ortín (Reference Nuez-Ortín2010) reported numerically higher soluble CP and Kd-CP for WDDGS compared with blend DDGS (corn to wheat ratio, 30% : 70%). The rumen undegradable CP fraction in BDDGS1 and BDDGS2 was higher (average 163.0 g/kg CP) than in WDDGS and than those reported for wheat and corn (49.4 and 14.5 g/kg CP, respectively; Nuez-Ortín, Reference Nuez-Ortín2010).
Not all of the starch is converted to sugars during the enzymatic hydrolysis of starch dry grinding process of bioethanol production. Therefore, unhydrolysed starch may appear in DDGS (Sharma et al., Reference Sharma, Rausch, Graeber, Schmidt, Buriak, Tumbleson and Singh2009). To the author's knowledge, no literature is available on the rumen degradation characteristics of residual starch in DDGS. As it is apparent from Table 3, cooking the wheat and corn for production of bioethanol resulted in the formation of resistant starch, which had rumen degradation characteristics more similar to structural carbohydrates rather than to those reported for corn and wheat starch (Offner et al., Reference Offner, Bach and Sauvant2003). During the process of bioethanol production, two types of resistant starch might have been appeared, namely, ungelatinised starch and retrograded starch, which are both extremely resistant to ruminal degradation (Sharma et al., Reference Sharma, Rausch, Graeber, Schmidt, Buriak, Tumbleson and Singh2009).
This study showed significant effect of DDGS types on ruminal availability of nutrients for microbial protein synthesis (Table 5). WDDGS was significantly higher in FOMr than BDDGS1 and BDDGS2 (Table 5), which is in agreement with the findings of Nuez-Ortín and Yu (Reference Nuez-Ortín and Yu2010a). However, the FOMr values of all DDGS types in our study were lower than those reported by Nuez-Ortín and Yu (Reference Nuez-Ortín and Yu2010a) for the WDDGS and BDDGS1. The discrepancy between the values of FOMr observed in the current study with those reported by Nuez-Ortín and Yu (Reference Nuez-Ortín and Yu2010a) might be due to plant-to-plant variation in nutrient availability of DDGS samples. Additionally, to estimate FOMr, Nuez-Ortín and Yu (Reference Nuez-Ortín and Yu2010a) used a method different from that used in our study. In our study, FOMr was calculated as the summation of various rumen degradable OM components (with different fractional rate of passage out of the rumen for each component (Kp); Van Duinkerken et al., Reference Van Duinkerken, Blok, Bannink, Cone, Dijkstra, Van Vuuren and Tamminga2011), whereas Nuez-Ortín and Yu (Reference Nuez-Ortín and Yu2010a) measured degradation of OM as one fraction and with one Kp (6%/h; Tamminga et al, Reference Tamminga, van Straalen, Subnel, Meijer, Steg, Wever and Blok1994).
In agreement with findings of Nuez-Ortín and Yu (Reference Nuez-Ortín and Yu2010a), WDDGS had a higher OEB compared with BDDGS1 and BDDGS2, which was mainly due to the higher RDP in the WDDGS than in the BDDGS1 and BDDGS2 (242, 147 and 135 g/kg DM for the WDDGS, BDDGS1 and BDDGS2, respectively). The rumen degraded protein balance values for WDDGS and BDDGS1 in our study were higher than those reported by Nuez-Ortín and Yu (Reference Nuez-Ortín and Yu2010a). These higher OEB values in our study resulted from lower MCPFOMr values compared with those reported by Nuez-Ortín and Yu (Reference Nuez-Ortín and Yu2010a) and were mainly due to different equations used to calculate MCPFOMr in these two studies (Tamminga et al., Reference Tamminga, van Straalen, Subnel, Meijer, Steg, Wever and Blok1994; Van Duinkerken et al., Reference Van Duinkerken, Blok, Bannink, Cone, Dijkstra, Van Vuuren and Tamminga2011). Although in the DVE/OEB 1991 (Tamminga et al., Reference Tamminga, van Straalen, Subnel, Meijer, Steg, Wever and Blok1994), MCPFOMr is calculated assuming a constant microbial yield of 150 g/kg fermentable OM; in the DVE/OEB 2010 (Van Duinkerken et al., Reference Van Duinkerken, Blok, Bannink, Cone, Dijkstra, Van Vuuren and Tamminga2011), it is calculated based on the ATP yield of each in situ fraction, yield of microbial DM (Pirt, Reference Pirt1965), and the quantities of each specific in situ fraction and their fractional degradation and passage rates.
A dietary OEB of zero is required for optimal protein synthesis (Tamminga et al., Reference Tamminga, van Straalen, Subnel, Meijer, Steg, Wever and Blok1994; Van Duinkerken et al., Reference Van Duinkerken, Blok, Bannink, Cone, Dijkstra, Van Vuuren and Tamminga2011). As all the DDGS types had positive OEB values (159, 85, 71 g/kg DM in WDDGS, BDDGS1 and BDDGS2, respectively), their inclusion in the diets of dairy cattle may alleviate a deficiency of rumen available nitrogen caused by the inclusion of ingredients with negative OEB values.
Despite having a higher intestinal digestibility of rumen undegraded protein (90%, 74% and 71% in WDDGS, BDDGS1and BDDGS2, respectively), WDDGS provided a lower DRUP than BDDGS1 (Table 6). This was mainly caused by the higher RDP in WDDGS compared with both BDDGS types (Table 5), which resulted in a lower supply of RUP to the lower digestive tract.
Estimated DMFP were higher in BDDGS2 compared with BDDGS1, which had a higher DMFP compared with WDDGS (Table 6). This was mainly due to a lower estimated total tract digestible OM in BDDGS1 compared with the other two DDGS types. The DVE was higher in BDDGS2 compared with WDDGS (numerically higher) and BDDGS2 (Table 6). This was because DRUP was higher, whereas DMFP was lower in the BDDGS1 than in WDDGS and BDDGS2.
The average DVE value of all DDGS types in this study were on average two and a half times higher than for alfalfa (176 v. 70 g/kg DM; Jonker et al., Reference Jonker, Gruber, Wang, Coulman, Azarfar, McKinnon, Christensen and Yu2011), higher than for canola meal (176 v. 135 g/kg DM; Centraal Veevoeder Bureau (CVB), 2010) and lower than for soybean meal (176 v. 221 g/kg DM; CVB, 2010). Although soybean meal has a higher DVE compared with DDGS, several studies showed that soybean meal can be replaced by DDGS in the diet of dairy cows by up to 20% of the ration DM without affecting milk production (Kleinschmit et al., Reference Kleinschmit, Schingoethe, Kalscheur and Hippen2006; Christen et al., Reference Christen, Schingoethe, Kalscheur, Hippen, Karges and Gibsont2010). In their study, the slightly lower milk protein percentage observed when replacing soybean meal with DDGS was compensated with a slightly higher milk production, which resulted in a similar total milk protein yield. Similarly, no differences were observed in milk production and milk composition when dairy cows were fed either canola meal or DDGS as the sole protein supplement (Mulrooney et al., Reference Mulrooney, Schingoethe, Kalscheur and Hippen2009). This implies that all the DDGS types are quantitatively good sources of DVE for dairy cattle.
Different batches within DDGS type significantly affected DRUP and DMCP. Except for BDDGS1, these differences did not affect the DVE values for dairy cattle. The differences observed between the batches within DDGS types were not due to their ADICP. The ADICP contents were not significantly related to DRUP (r = −0.13, 0.03, 0.39 in WDDGS, BDDGS1 and BDDGS2, respectively), intestinally available microbial protein (r = 0.23, −0.40, −0.41 in WDDGS, BDDGS1 and BDDGS2, respectively) and DVE (−0.03, −0.14, 0.26 in WDDGS, BDDGS1 and BDDGS2, respectively). Previously, several studies reported a poor relationship between ADICP and protein digestibility of non-forage plant protein sources that had been subjected to heat treatment (Harty et al., Reference Harty, Akayezu, Linn and Cassady1998; Nakamura et al., Reference Nakamura, Klopfenstein and Britton1998). This poor relationship is believed to be due to the partial digestion of ADICP.
The difference in DVE values between the batches of BDDGS1 may not only have an impact on diet formulation but it may also have economical impact, as almost 500 g extra of batch2 is required compared with batch1 to meet 50% of the DVE required by a 650 kg lactating dairy cow producing 30 FPCM (fat and protein-corrected milk).
Conclusions
All DDGS types tested had highly positive rumen degradable protein balance (OEB) values. The predicted truly digested and absorbed protein supply (DVE) to dairy cattle differed among DDGS types. Due to a higher DRUP and a lower DMFP, the DVE was higher in BDDGS1 than in WDDGS (numerically) and BDDGS2. Variations in OEB and DVE within different batches were of concern because OEB differed among different batches within DDGS types tested, and DVE differed among the batches of BDDGS1. The magnitude of such batch variation on milk production should be further considered.
Acknowledgments
The authors thank the Ministry of Agriculture Strategic Feed Research Chair Program, ABIP–FOBI, BCRC and ADF – Saskatchewan for financial support of the feed research program. The authors express their gratitude to Zhiyuan Niu and Inoka K. Hettiarachchi-Gamage, without whose help this study would not have been possible.