
Introduction
The hardness of solid-state materials has played a critical role in advancement and sustenance of human civilization. This property has assumed an even more significant role in modern cutting tools needed for applications ranging from high-speed machining to deep-sea drilling and protective coatings. Diamond is the stiffest and the hardest material known to humankind. The stiffness is determined by the bulk modulus (B = 440 GPa) and Young's modulus (E = 1015 GPa), whereas the hardness (H) is directly proportional to the shear modulus (μ = 506 GPa) of the diamond as H = 0.151*μ. These extraordinary properties of diamond are derived primarily from its short and strong covalent bonding. The C60 fullerites under ultrahigh pressures with intramolecular distances approaching C–C bonds have been predicted to be stiffer than diamond.[Reference Ruoff and Ruoff1] However, the empirical modeling[Reference Ruoff and Ruoff1] multiplied incorrectly in-plane stress with out-of-plane strain to arrive at pressure, relating to B. They also assumed unusually large strain to arrive at the surface tension and bulk modulus of C60, and ignored Poisson's effect in arriving at bulk modulus harder than diamond. This is tantamount to assuming Poisson's ratio of 0.5, which is ~500% higher than the accepted values for diamond. Furthermore, the C–C bonds in these fullerites need to be considerably shorter than C–C bond of diamond (0.154 nm sp 3 bonds) for showing over 100% increase in stiffness.[Reference Blank, Popov, Buga, Davydov, Denisov, Ivlev, Marvin, Agafonov, Ceolin, Szwarc and Rassat2] Taking 0.143 nm for sp 2 bond length, the increase in bulk modulus should not exceed 30%, since bulk modulus (B) varies with bond length (d) as d −3.5.[Reference Liu, Cohen and Tolbert3, Reference Niu, Lu and Lieber4] Therefore, the fundamental scientific challenge remains to create a material harder than diamond, which will have exciting technological applications.[Reference Liu, Cohen and Tolbert3–Reference Kaner, Gilman and Tolbert5]
In designing superhard materials, we need to consider the response of solid-state materials to external forces. The materials upon external loading undergo elastic (reversible) and plastic (irreversible) deformation through the generation of dislocations. The stiffness of the material is related to the resistance to volume compression (bulk modulus, B) and the resistance to linear compression (Young's modulus, E). The bulk modulus B is related to Young's modulus through Poisson's ratio, B = E/3(1 − 2υ). The Poisson's ratio is the measure of transverse contraction to longitudinal extension. The hardness is related to plastic deformation and shear modulus (μ), which is related to Young's modulus as μ = E/2(1 + υ). It shows that the Poisson's ratio plays a critical role in maintaining the high shear modulus and hardness of materials. The shear modulus decreases with the increase of Poisson's ratio, whereas the bulk modulus increases with the increase in Poisson's ratio. Thus, an optimum value of hardness can be achieved when bulk modulus equals the shear modulus, which happens at a Poisson's ratio of 0.125. The Poisson's ratio of diamond (0.115) is close to this value, which makes diamond an ideal superhard material. Due to the highly directional covalent bonding in diamond, it can resist both elastic and plastic deformation, leading to the highest stiffness and hardness.
To go beyond the stiffness and hardness of diamond, we have examined the unit-cell structure of diamond cubic lattice (DCL) and focused on the number density of covalently bonded carbon atoms. The DCL with zinc blende structure consists of two interpenetrating face-centered cubic (FCC) lattices, where one is displaced with respect to the other along the diagonal by (a/4, a/4, a/4) units. Since these atoms touch each other, the atomic diameter is related to the lattice constant as  $d = \sqrt {3a} /4,$ and number density of atoms in the diamond unit cell is
 $N_{\rm D} = 3\sqrt 3 /8d^3 $. The atoms are covalently bonded and tetrahedrally coordinated. Liu and Cohen have shown that the bulk modulus and stiffness are related to the covalent bond length and iconicity parameter.[Reference Liu and Cohen6] We have generalized this approach relating the number density of covalently bonded atoms in diamond, which is 1.76 × 10²³ atoms cm−3, the highest of all of the solid-state materials so far. It is interesting to note that despite its highest number density of atoms, diamond has a relatively open structure with atomic packing fraction (APF) of only 34%. It is much lower than 74% in the case of close-packed FCC and HCP lattices, 68% of BCC, and 52% for simple-cubic structure. The low value of APF of diamond provides an exciting opportunity albeit a significant challenge to enhance number density of atoms and achieve higher stiffness and hardness than diamond while keeping the bonding characteristics the same in covalently bonded carbon-related materials.
Here we address this challenge by increasing the number density of atoms in amorphous phases of Q-carbon and Q-BN.[Reference Narayan and Bhaumik7–Reference Narayan, Bhaumik and Xu10] This opportunity arises because number density of atoms in the diamond tetrahedron is considerably (50% in crystalline and higher in a random structure) higher than the average density in the DCL. By repeating the tetrahedral structure, we can increase the number density of atoms by 50% (from  $3\sqrt 3 /8d^3 $ to
 $9\sqrt 3 /16d^3 $) in a crystalline lattice and 60% by random packing of tetrahedra, leading to enhancement in bulk modulus by over 60% and 70%, respectively. The tetrahedra can be packed with the packing efficiency exceeding 80%.[Reference Jaoshvili, Esakia, Porrati and Chaikin11, Reference Haji-Akbari, Engel, Keys, Zheng, Petschek, Muhoray and Glotzer12] A modulated nanoindentation technique[Reference Gao, Kim, Zhou, Chiu, Nélias, Berger, Heer, Polloni, Sordan, Bongiorno and Riedo13, Reference Gao, Cao, Cellini, Berger, Heer, Tosatti, Riedo and Bongiorno14] is used to measure effective stiffness (Young's modulus) of Q-carbon while using chemical vapor deposition (CVD) diamond and sapphire as standards. Since the sp 3 covalent bonding is preserved, we expect Poisson's ratio to be similar to that of the diamond. Therefore, we estimate the Q-carbon to be harder than diamond by as much as 70% based on our model of increase in the number density of atoms. Since the bonding between the tetrahedra is mostly sp 2 with a shorter bond length (0.143 nm) compared with that in diamond (0.154 nm), a further enhancement is expected. We also discuss the role of enhanced toughness and adhesion of Q-carbon and Q-BN films, which are critical for practical applications.
It is very interesting to note that superconductivity and hardness are quite directly linked to each other through the McMillanc–Hopfield equation,  $ T_{{\rm c}\;} \approx 0.2[\lambda \langle \omega ^2 \rangle ] = \mathop \sum \limits_i [ \eta _i /M_i ]^{0.5}, $ where λ is the electron–phonon coupling constant related to ratio of spring constants, ω is the averaged phonon frequency, M is the averaged atomic mass, and ɳ is the McMillan–Hopfield parameter with units of spring constant and is related to strength of electronic response of electrons near the Fermi surface to atomic perturbations. Thus, sp 3 and sp 2 strongly bonded carbon-based materials offer the best hope for Bardeen-Cooper-Schrieffer (BCS) high-temperature superconductivity and superhard materials. The highest superconducting transition temperature (T c) in B-doped was reported to be 11 K, which was obtained in CVD diamond, where B-concentration is limited to the equilibrium concentration of 2.0 %at. Since T c was predicted to scale with B-concentration in diamond, this field was at standstill until the discovery of Q-carbon. By non-equilibrium laser melting and rapid quenching, we were able to attain distinct concentrations 17%, and 25% at of B in Q-carbon with record T c of 37 and 57 K, respectively. Therefore record BCS T c in B-doped Q-carbon should lead to a higher hardness than diamond.[Reference Bhaumik, Sachan and Narayan15–Reference Bhaumik, Sachan, Gupta and Narayan17]
We have created a new phase of carbon named Q-carbon which is over 40% harder than diamond. This phase is formed by nanosecond laser melting of amorphous carbon and rapid quenching from the super-undercooled state. The molten carbon is metallic, and atoms are closely packed in this state. Upon rapid quenching, bonding characteristics change to covalent bonding with estimated 80–85% sp 3 fraction and the rest sp 2 in Q-carbon. During melt quenching, C–C bonded tetrahedra are formed and packed randomly to form an amorphous structure. Bonding within the tetrahedra is sp 3 and between the tetrahedra a mixture of sp 3 and sp 2. The sp 2 bonding between the tetrahedra can be stronger than sp 3 due to its shorter bond length. The number density of atoms in Q-carbon can vary from 40% to 60% higher than that in the DCL, as the tetrahedra packing efficiency increases from 70% to 80%. Using this semiempirical approach, the corresponding increase in Q-carbon hardness is theoretically estimated to vary from 48% to 70% compared with diamond. Theoretical predictions on the large stiffness and superhardness of amorphous Q-carbon are experimentally validated using two separate atomic force microscopy (AFM) methods. More specifically, the modulated nanoindentation (MoNI) method[Reference Gao, Kim, Zhou, Chiu, Nélias, Berger, Heer, Polloni, Sordan, Bongiorno and Riedo13, Reference Gao, Cao, Cellini, Berger, Heer, Tosatti, Riedo and Bongiorno14] is used to measure the effective stiffness (indentation modulus) of Q-carbon while using CVD diamond and sapphire as standards. From these measurements, values of 1538 ± 324 GPa for Q-carbon, 1094 ± 261 GPa for diamond, and 350 ± 78 GPa for sapphire have been extracted. The superhardness of Q-carbon is further shown through AFM-based nanohardness experiments, whereby a diamond indenter is employed to probe the Q-carbon filaments. Results show that while diamond can easily indent the diamond-like-carbon film, it is unable to penetrate the Q-carbon surface.
Methods
Synthesis
Q-carbon is formed by converting amorphous carbon thin films by nanosecond pulsed laser melting and subsequent quenching. Amorphous carbon films were deposited onto c-sapphire using pulsed laser deposition (PLD) with a total thickness ranging from 100 to 500 nm in the temperature range of 300–570 K and based pressure of 1.0 × 10⁻⁷ Torr. For the PLD process, KrF excimer laser (laser wavelength = 248 nm, pulse duration = 25 ns) was used. The laser energy density used during the diamond-like-carbon (DLC) deposition process was 3.5 Jcm−2. Before the start of thin-film deposition, the targets are pre-ablated to eliminate surface contaminants. Subsequently, amorphous carbon thin films were irradiated with nanosecond ArF excimer laser (laser wavelength = 193 nm, pulse duration = 20 ns) using laser energy density 0.6–1.0 Jcm−2. The pulse laser annealing technique melts the carbon film in a highly super undercooled state, which is followed by quenching to complete the whole process within 200–250 ns. This leads to conversion of amorphous carbon films into Q-carbon and Q-diamond. The Q-diamond was found to nucleate from Q-carbon, particularly at triple points.
Raman and scanning electron microscopy (SEM) characterization
The Raman active vibrational modes are characterized using an Alfa300 R superior confocal Raman spectroscope with a lateral resolution <200 nm. The datasets are calibrated using a single-crystalline Si, which has its characteristic Raman peak at 520.6 cm−1. High-resolution SEM with the sub-nanometer resolution was carried out using FEI Verios 460L SEM to characterize the as-deposited and the laser-irradiated films.
Transmission electron microscopy (TEM) characterization
The FEI Quanta three-dimensional (3D) FEG with a dual beam technology is employed to use both electron and ion beam guns for preparing thin Q-carbon/sapphire cross-sectional TEM samples. A low-energy ion beam (5 kV, 10 pA) was utilized to clean up the damage introduced during the focused ion beam (FIB) processing. An aberration-corrected STEM-FEI Titan 80–300 was used in conjunction with electron energy-loss spectroscopy (EELS) to acquire high-angle annular dark-field (HAADF) images and EEL spectra for Q-diamond and Q-carbon thin films. The electron probe current used in the experiment was 38 ± 2 pA. The collection angle of 28 mrad was used for EELS data acquisition.
Mechanical properties measurements
The MoNI method[Reference Gao, Kim, Zhou, Chiu, Nélias, Berger, Heer, Polloni, Sordan, Bongiorno and Riedo13, Reference Gao, Cao, Cellini, Berger, Heer, Tosatti, Riedo and Bongiorno14] is employed to measure the stiffness of the Q-carbon filaments. The microscope adopted for MoNI measurements is an Agilent PicoPlus AFM externally controlled by a Stanford Research Systems SR830 Lock in the amplifier. MoNI allows measuring the local perpendicular-to-the-surface indentation modulus of stiff thin films at 0.01 nm depth resolution. (13) Indentation curves measured through MoNI for Q-carbon, CVD diamond film, and Sapphire are reported in Fig. 6(a) in the paper. By assuming a sphere indenting an isotropic bulk material following a Hertzian behavior,[Reference Willis18] the indentation depth d is related to the effective modulus (E*) as follows:
 $$d = [9 F^2 /(16E^{\ast 2} R)]^{0.5}, $$
where F is the normal force, R is the effective sphere radius, and the effective modulus is
 $$1/E^{\ast} = (1 - \upsilon _{\rm t}^2 )/E_{\rm t} + (1 - \upsilon _{\rm s}^2 )/E_{\rm s}, $$
where E t and υ t are the elastic modulus and Poisson's ratio of the indenting sphere, respectively, and E s and υ s are the effective elastic modulus and Poisson's ratio of the indented material.
Equations (1) and (2) are employed to identify the values of the effective elastic stiffness of the materials from the indentation curves using a non-linear fitting procedure in Python. To identify the effective modulus of the sample, we assume E t = 1050 GPa, υ t = 0.115 for the diamond coated tips used in the MoNI experiments (Nanoworld DT-NCHR), and we adopt υ s = 0.25 for sapphire and υ s = 0.115 for CVD diamond and Q-carbon. The effective tip radius R (in the range 50–150 nm) is identified from the experimental data using the sapphire sample as the calibration standard.
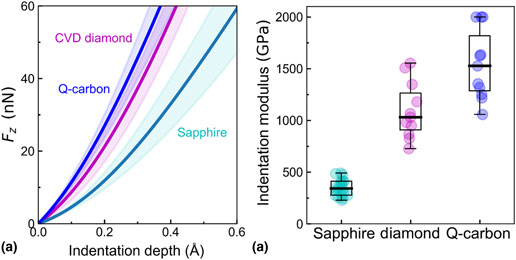
Following this procedure, we obtain an effective stiffness for Q-carbon of 1538 ± 324 GPa, compared with 1094 ± 261 GPa for diamond and 350 ± 78 GPa for sapphire. These values are obtained by averaging results for ten independent experiments on Q-carbon and CVD diamond and twenty independent experiments for sapphire (data are reported in Fig. 6(b) in the paper). For each of these experiments, indentation curves are acquired three to five times in different positions on the sample.
Results and discussion
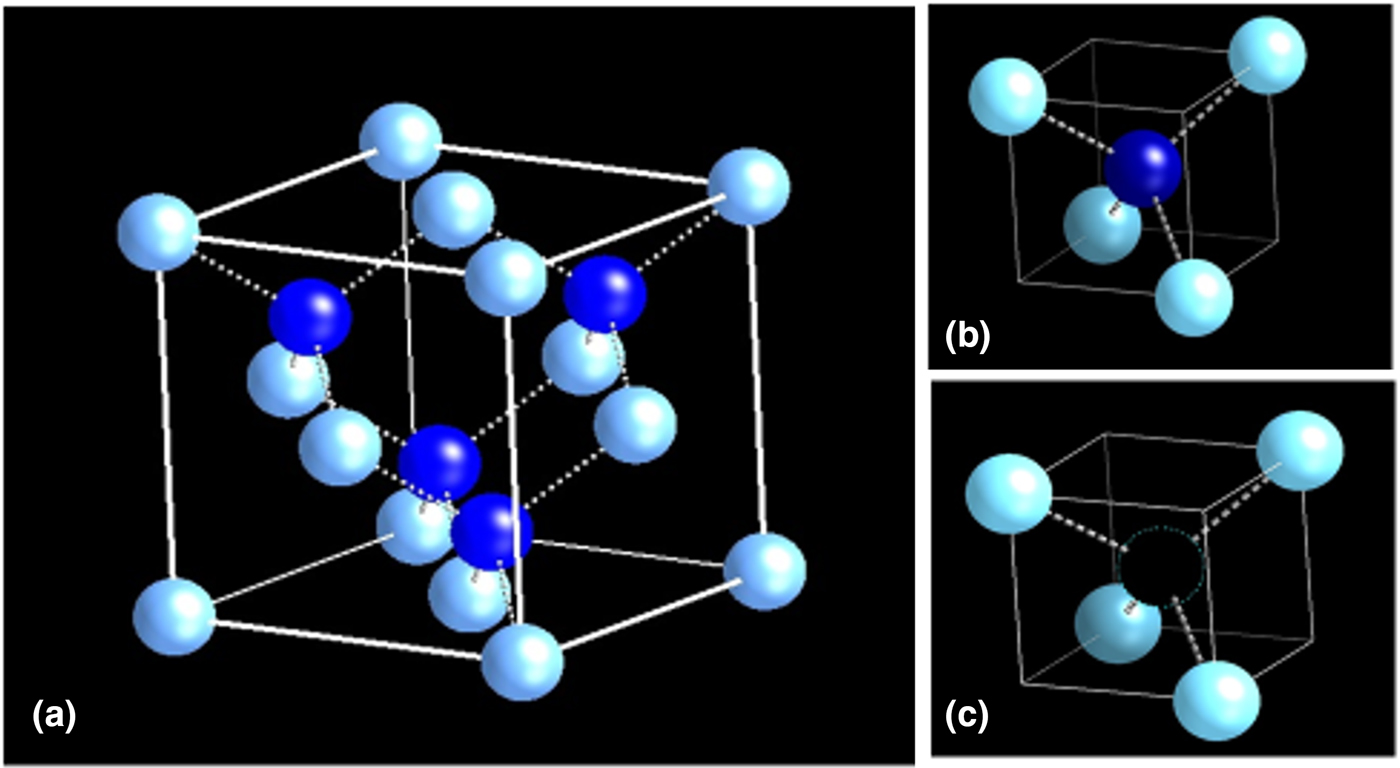
To create Q-carbon, we examine the standard unit cell of diamond, as shown in Fig. 1(a). The standard DCL unit cell consists of four tetrahedra containing central atoms along the four 〈111〉 directions. These DCL tetrahedra with central atoms are shown in Fig. 1(b). These D1 subunits are contained in (a/2, a/2, a/2), one-eighth of the unit cell. The adjacent subunit cell D2 consists of only four atoms [Fig. 1(c)], which is equivalent to missing central atom in the subunit cell D1. However, all the atoms in D2 subunit cell are covalently bonded and are part of neighboring tetrahedra with no dangling bonds. These D1 and D2 subunit cells having (a/2, a/2, a/2) dimensions alternate with each other to form diamond unit cell D [Fig. 1(c)]. The number density of atoms N D in diamond unit cell D is N D = 8a −3.
(a) The standard unit cell of diamond consisting of 4 tetrahedra containing central atoms along the four 〈111〉 directions. Panel (b) shows the DCL tetrahedra (D1) with a central atom. These D1 subunits are contained in (a/2, a/2, a/2), one-eighth of the unit cell. Panel (c) represents the adjacent subunit cell D2 consisting of only four atoms, which is equivalent to missing central atom in the subunit cell D1.

This structural arrangement provides an exciting opportunity to enhance N D or ρ for carbon-based sp 3 bonded materials and achieves higher hardness than diamond. As shown in Fig. 1(a), diamond unit cell D (lattice constant “a’) can be divided into four subunit cells denoted as D1 in Fig. 1(b) and four subunit cells denoted as D2 in Fig. 1(c). The four atoms in D2 are covalently bonded to neighboring D1 subunit cells. The number density of atoms in diamond unit cell D is N D = 8a −3, whereas it is 50% higher in D1 (N D1 = 12a −3) and it is 50% lower in D2 (N D2 = 4a −3). Thus, D1 and D2 alternate to account N D = 8a −3 in the DCL. If we can repeat D1 tetrahedra in a solid and maintain sp 3 bonding, then it is possible to enhance number density of atoms to by 50% (N D1 = 12a −3) and achieve ADF of 51%, which is still lower than even that of simple cubic structure (52%).”
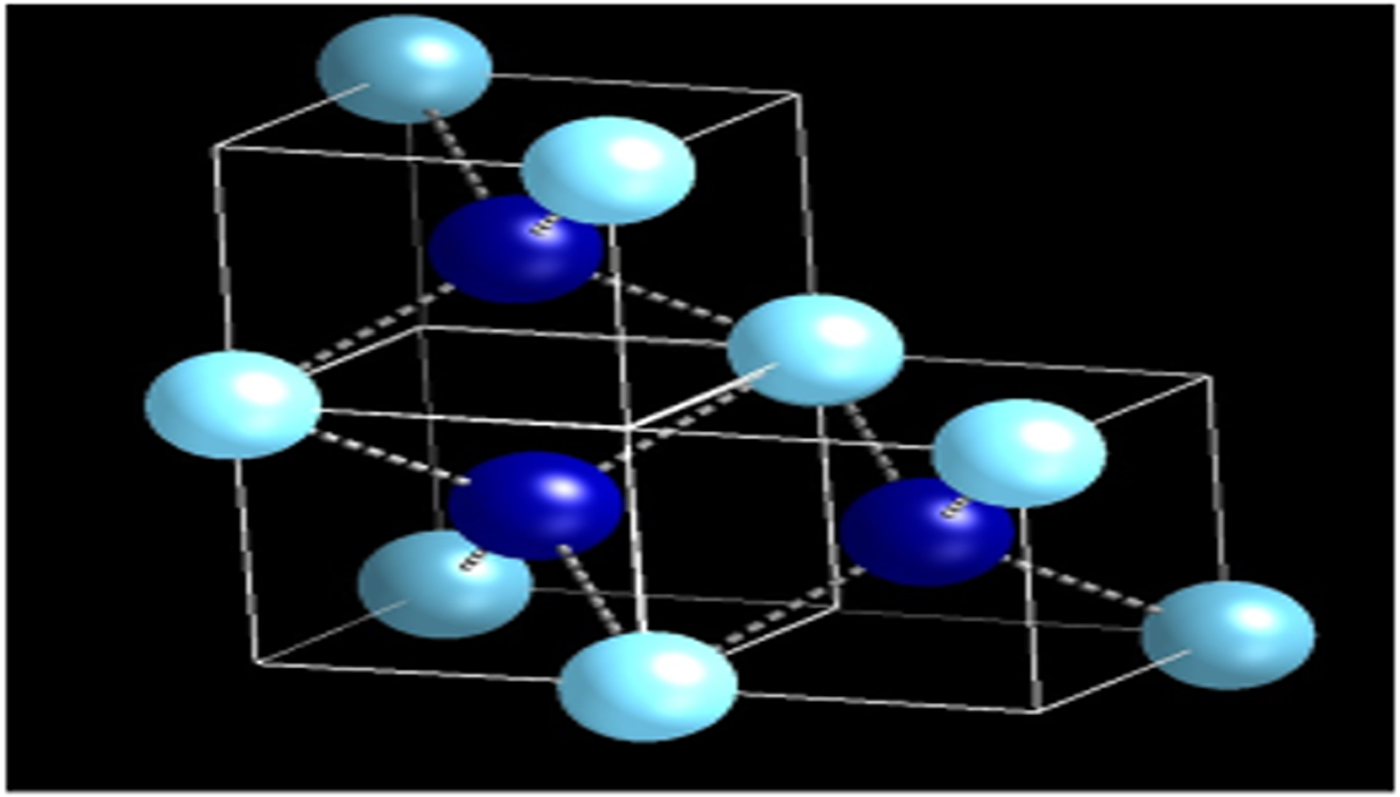
The effective number density of atoms in D1 subunit cell depends upon 3D arrangement and packing. When the carbon tetrahedra are packed systematically, requiring a 90° rotation, as shown in Fig. 2, then the number density is N D1 = 12a −3, which is 50% higher than the diamond unit cell. This unit cell having Calcium Fluorite structure is named Q-diamond. The Q-diamond structure can be repeated randomly, or in a quasi-crystalline manner to preserve tetrahedra bonding. The formation of Q-carbon occurs when there is a random packing of D1 subunit cells, where corner carbon atoms are shared by four atoms. Modeling and experimental studies have shown that tetrahedra can be packed with efficiency varying from 70% to 80%. Assuming this packing density, we derived Q-carbon structure as an amorphous structure with over 40– 60% higher number density of atoms. The formation of these tetrahedral amorphous structures is evidenced by the radial distribution function having intensity peaks at 0.154 and 0.252 nm in the electron diffraction pattern, as shown in Fig. S1. Since the number density of atoms of Q-carbon and Q-diamond are significantly higher, it is possible to achieve a much higher hardness, the details of which will be discussed later. The tetrahedral bonding within the subunit cell D1 gives rise to sp 3 bonding. However, the bonding between the tetrahedral D1 units can result in sp 2 as well as sp 3 bonding. These D1 tetrahedra are formed during melting of amorphous carbon and are packed closely, but randomly during quenching. Thus, the random packing of tetrahedral leads to the formation of Q-carbon. The random tetrahedral packing enhances entropy driving the formation of Q-carbon thermodynamically from free-energy considerations. Also, the kinetic barrier for rotation during nanosecond laser melt quenching may further promote the formation of amorphous Q-carbon as opposed to crystalline Q-diamond, the formation of which requires a 90° degree twinning rotation.
The proposed Q-diamond unit cell. When the carbon tetrahedra are packed systematically, requiring a 90° rotation, then the number density of the unit cell is N D1 = 12a −3, which is 50% higher than the diamond unit cell.

In the case of Q-carbon, we have achieved this experimentally by putting only D1 units randomly by nanosecond laser melting of carbon in a super undercooled state and quenching subsequently. This quenched structure is amorphous with over 80–85% sp 3 bonding and the rest sp 2. Some of the bonding between the sp 3 bonded tetrahedrally is sp 2, accounting for 15–20% of the total bonding. The experimental results on B-doping of Q-carbon show that single subunit cell D1 [shown in Fig. 1(b)] can be randomly arranged to create amorphous structures of distinct concentrations. When all the carbon tetrahedra containing B dopants as central atoms are packed together randomly, we achieve 50% (atomic percent) B-doped Q-carbon. When only half of the tetrahedra contain B dopants, and other half are undoped, we achieve 25% B-doped Q-carbon. When one B-doped and two undoped tetrahedral are repeated, we achieve 17% B-doped Q-carbon. These three compositions result in the formation of specific phases of B-doped Q-carbon and exhibit novel BCS high-temperature superconductivity.[Reference Bhaumik, Sachan and Narayan16, Reference Bhaumik, Sachan, Gupta and Narayan17, Reference Narayan, Bhaumik and Sachan19] We have synthesized three distinct phases of B-doped Q-carbon, which exhibit high-temperature superconductivity as follows: (1) B-concentration (~17%) with T c = 37 K (QB1), (2) B-concentration (~25%) with T c = 56 K (QB2), and (3) B-concentration (~50%) with T c expected over 100 K (QB3). Other structures with two, three, four, five, and six subunit cell structures can be randomly arranged to create different amorphous structures of fixed B concentrations.[Reference Narayan, Bhaumik and Sachan19]
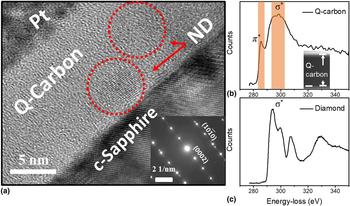
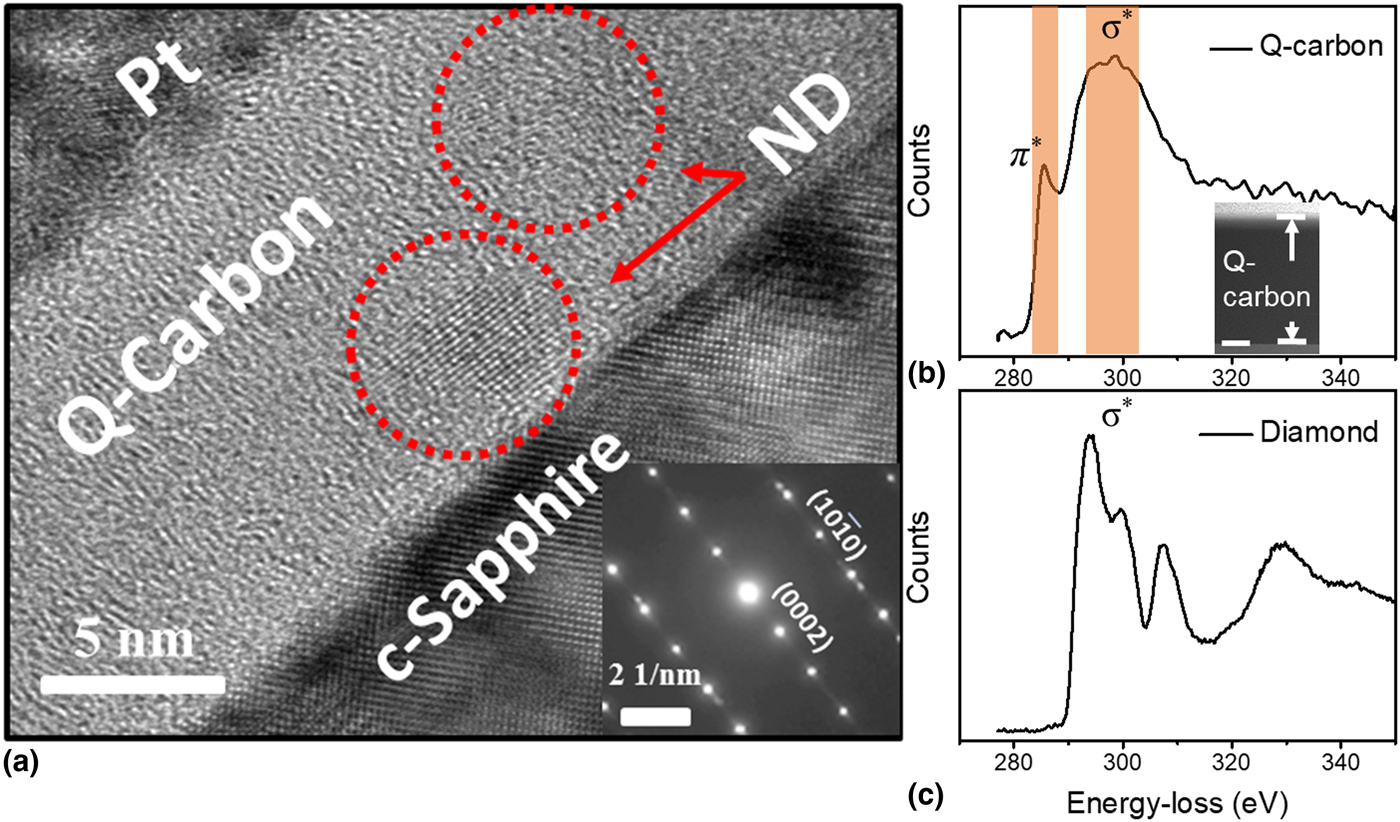
The high-resolution TEM micrograph shows the amorphous structure of Q-carbon in Fig. 3(a), where initial stages of nucleation of crystalline Q-diamond is shown by arrows. The characteristic EELS spectrum from the Q-carbon is shown in Fig. 3(b), which has a sloping edge at 285 eV with a broad peak at 292 eV.[Reference Bruley, Williams, Cuomo and Pappas20] From the two-window method for quantifying the EELS spectrum,[Reference Bruley, Williams, Cuomo and Pappas20] the sp 3 was estimated to be about 80% and 20% sp 2; this is consistent with Raman results from the Q-carbon, as shown below. Figure 3(c) represents a characteristic EELS spectrum acquired from microdiamonds near the Q-carbon near the Q-carbon filaments, showing prominent sp 3 (σ*) bonding. Notably, a sharp edge at 288 eV is observed with a peak around 292 eV which corresponds to sp 3 (σ*) bonding. It is a signature EELS spectrum for microsized diamond crystallites. The bonding between the tetrahedra is largely sp 2, where bond-length is shorter (0.143 nm) compared with that of diamond (0.154 nm).
(a) HRTEM image showing the formation of Q-carbon on the sapphire substrate. The marked regions contain crystallites of nanodiamonds (ND). Inset figure represents the electron diffraction pattern with sapphire substrate diffraction spots. (b) EEL Spectra obtained from amorphous Q-carbon and (c) diamond, demonstrating the presence of π* (284 eV) and σ* (292 eV). The inset in (b) shows the HAADF image of Q-carbon.
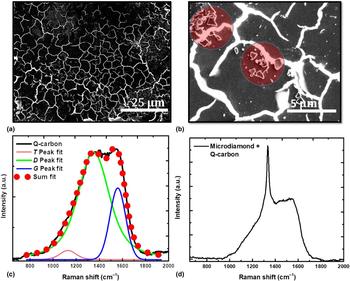
Figures 4(a) and 4(c) show an SEM micrograph consisting large area Q-carbon formation and the Raman acquisition from Q-carbon on the sapphire substrate after a single laser pulse of ArF laser. The Raman spectrum consists of a broad D peak about 1350 cm−1, a small T peak at 1140 cm−1, associated with strained sp 2 carbon at the interface and a small G peak about 1570 cm−1. By fitting this Raman spectrum with 1140 cm−1, 1333 cm−1, and 1580 cm−1 Voigt peaks, we obtain about 81% sp 3 and the rest as sp 2 fraction. A slight up-shift of the primary Raman peak is related to strain generated during quenching, and a bump around 1140 cm−1 in the Q-carbon spectrum is the characteristic of sp 2 bonded carbon at the interfaces in nanodiamonds corresponding to sp 2–sp 3 bonded states. Figure 4(b) shows the microsized diamond nucleation from the Q-carbon filamentary structures after a single laser pulse of ArF laser [energy density (0.6 Jcm−2)], in the encircled regions. The associated Raman spectrum is acquired from the regions containing microdiamonds on a sapphire substrate as shown in Fig. 4(d). A sharp diamond peak at 1331.54 cm−1 and small G peak of residual unconverted amorphous graphite are observed. The Raman shift (Δω) is related to Δω (in cm−1) = 2.2 ± 0.10 cm−1 GPa−1 along the [111] direction, Δω (in cm−1) = 0.7 ± 0.20 cm−1 GPa−1 along the [100] direction, and Δω (in cm−1) = 3.2 ± 0.23 cm−1 GPa−1 for the hydrostatic component. The biaxial state of stress in thin films can be described as a combination of two-thirds hydrostatic and one-third uniaxial stress. The biaxial stress is estimated using σ = 2μ (1 + υ)/(1 − υ).Δα.ΔT, where μ is the shear modulus, ʋ is Poisson's ratio, Δα is the change in thermal coefficient of expansion and ΔT is the change in temperature.[Reference Prawer and Nemanich21] The presence of residual stresses causes an increase in the stiffness. Therefore, the residual stresses play an important role in the measured mechanical properties of Q-carbon.
(a) SEM micrograph demonstrating conformal coverage of Q-carbon along with a representative (c) Raman spectrum showing T, D, and G peaks of carbon. (b) SEM micrograph showing the formation of microsized diamonds (encircled regions) nucleating from the Q-carbon filamentary structures after performing the second shot PLA. (d) Raman spectrum acquired from the region containing both microdiamonds and Q-carbon showing the prominence of diamond 1332 cm−1 peak.

Modulated nanoindentation experiments are conducted to measure the stiffness of the amorphous Q-carbon filaments. Figure 5(a) displays the AFM topography of the amorphous DLC film after formation of the Q-carbon filaments. The thin film topography reveals that the filaments are located 20–40 nm below the level of the surrounding DLC film. This topography is associated with the significant shrinkage induced by the formation of the high-density Q-carbon after melting. The cross-section of one of the filaments is displayed in Fig. 5(b), wherein markers are used to identify the regions of the sample that are probed using MoNI. More specifically, positions 3, 4, and 5 pertain to the Q-carbon filament, whereas 1, 2, 6, and 7 are from the DLC film. The force versus indentation depth curves for Q-carbon and the surrounding DLC film are displayed in Fig. 5(c). These indentation curves represent only the elastic regime, where loading and unloading curves overlap. Results from MoNI experiments prove that—in line with theoretical predictions—the Q-carbon filaments have a much higher stiffness than the surrounding DLC film.
Modulated nanoindentation (MoNI) of Q-carbon filaments. (a) AFM topography of Q-carbon filaments formed in diamond-like-carbon (DLC) films. (b) AFM topography of a filament cross-section; markers indicate positions across the filament where indentation measurements are conducted. (c) MoNI curves measured on a Q-carbon filament and DLC film. Blue and red lines are measurements performed on the Q-carbon filament and the surrounding DLC film, respectively. Numbers refer to positions identified in (b).

To provide a quantitative estimation of the stiffness of the filaments compared with other stiff materials, indentation curves measured for Q-carbon are displayed in Fig. 6(a) together with those measured for CVD (111) diamond films on Silicon and for bulk (0001) sapphire. The slope of the indentation curves shows that the stiffness of Q-carbon is larger than the stiffness of CVD diamond, and substantially larger than the stiffness of bulk sapphire. The values of the indentation modulus—which are identified following the procedure discussed in the “Methods” section[Reference Gao, Kim, Zhou, Chiu, Nélias, Berger, Heer, Polloni, Sordan, Bongiorno and Riedo13, Reference Gao, Cao, Cellini, Berger, Heer, Tosatti, Riedo and Bongiorno14] and are displayed in Fig. 6(b). From the data reported in Fig. 6(b), we obtain an average modulus of 1538 ± 324 GPa for Q-carbon, 1094 ± 261 GPa for CVD diamond, and 350 ± 78 GPa for the sapphire substrate. Q-carbon filaments present an extremely large stiffness, which is larger than the stiffness of diamond of about 40–70% based on these findings. Moreover, direct evidence of the super hardness of Q-carbon filaments is provided in the S2 section of the supporting information, where results for nanohardness experiments performed using a diamond indenter are reported. Notably, we observe that a diamond indenter cannot penetrate the Q-carbon filament to any extent, whereas it can easily indent the surrounding DLC film as well as a silicon carbide substrate used as an external reference (see Supplementary Fig. S2).
Indentation elastic moduli of Q-carbon, diamond, and sapphire. (a) MoNI indentation curves measured on Q-carbon filaments (blue line), CVD diamond film grown on silicon (violet line), and on a sapphire substrate (cyan line). (b) Indentation moduli (in GPa) for Q-carbon (blue markers), CVD diamond (violet markers), and sapphire (cyan markers). The moduli are obtained by fitting the curves in (a) with the Hertz model[Reference Jaoshvili, Esakia, Porrati and Chaikin11, Reference Haji-Akbari, Engel, Keys, Zheng, Petschek, Muhoray and Glotzer12] using the procedure detailed in the “Methods” section. The box plots show the median of the measurements (solid black line) as well as the 25th and 75th percentiles (top and bottom limits of the box).

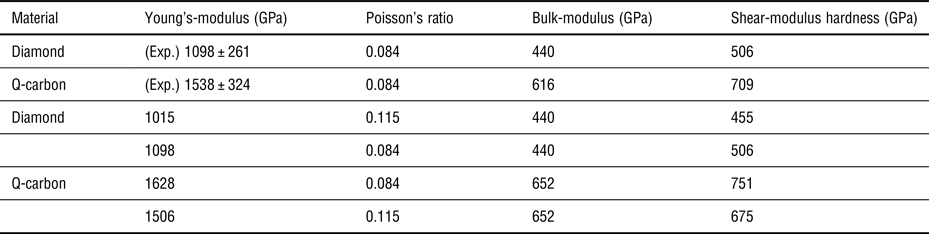
A semiempirical approach is developed to predict the bulk modulus B as a function of bond length for elements near the center of the periodic table for groups IV, III–V and II–VI tetrahedrally bonded homogeneous materials.[Reference Liu and Cohen6] According to this approach, B (in GPa) can be expressed as B = (N c/4)(1972 − 220I)/d 3.5, where N c is the coordination number, and d (in Å) is the bond length. The ionicity parameter I accounts for charge transfer across the bond and its value is estimated as 0, 1, and 2 for groups IV, III–V, and II–VI solids, respectively. Thus, I is equal to 1 in covalently bonded c-BN. We have modified this formula to relate bulk modulus with the number density of atoms. The bulk modulus can also be expressed as = (N c/4)(3265 − 364I)/d 1.17, where N D is the number density of atoms (in Å−3), and B = (N c/4)(98 − 10I)ρ 1.17, with ρ as the mass density in g cm−3. The highest hardness of diamond is associated with its highest number density of atoms 1.76 × 10²³ atoms cm−3, which are covalently bonded. Using this value of N D for diamond, bulk modulus (B) is calculated as 440 GPa, and Young's modulus as 1015 GPa (with ν = 0.115) and 1098 GPa (with ν = 0.084). The corresponding values for Q-carbon are estimated as 652 GPa for bulk modulus, 1628 GPa for Young's modulus, and 751 GPa for shear modulus. These theoretical estimates are in good agreement with experimental results from diamond and Q-carbon, as summarized in Table I.
A comparison of experimental results and theoretical estimates for the mechanical properties of Q-carbon and diamond, based on the semiempirical approach.

The structure factor of diamond, which can be described as FCC structure with a basis of two atoms (0, 0, 0) and (1/4, 1/4, 1/4) is given by
 $$\eqalign{{F_{hkl}} & = f\left[{1 + {\cos}\{\pi /2 (h + k + l)\}}\right] \cr & \quad \times \left[{1 + e^{i\pi (h + k)} + e^{i\pi (k + l)} + e^{i\pi (h + l)}}\right]},$$
where f is the scattering factor for the sp 3 bonded carbon atom. The structure factor (F) is obtained by multiplying geometrical structure factor with the Debye–Waller factor exp (−W). The structure factor contains information about the intensity and phase of the reflections of the family of planes in the unit cell. The phase can be positive or negative, but the intensity I is always positive as it is proportional to F 2.
On the other hand, the Q-diamond lattice can be described as FCC lattice with a basis of three atoms (0, 0, 0), (1/4, 1/4, 1/4), and (3/4, 3/4, 3/4). The geometrical structure factor of Q-diamond is derived as:
 $$\eqalign{F_{hkl} & = f\; \left[ {1 + 2\; {\cos}\; \{ \pi /2\; (h + k + l)\}} \right] \cr & \quad \times\left[ {1 + e^{i\pi \; (h + k)} + e^{i\pi \; (k + l)} + e^{i\pi \; (h + l)}} \right]},$$
where f is the scattering factor for the Q-diamond atom. The intensity of (200) reflection in diamond is zero, but F hkl = 16 f 2 for Q-diamond. This is consistent with intensities of (200) reflections in the EBSD patterns of Q-diamond (as shown in Fig. S3).
The applications of superhard materials also depend on toughness and adhesion to the substrate, in addition to hardness. The CVD diamond films often exhibit poor adhesion due to soft graphitic layer between the diamond film and the substrate. The diamond films also exhibit less toughness as they are prone to brittleness. We have solved these problems in Q-carbon films and achieved higher hardness, toughness, and adhesion compared with those in diamond. Higher adhesion is achieved by the interfacial reaction of carbon with the substrate during the melting process. The enhanced toughness is achieved through the amorphous structure of Q-carbon. The toughness can be further enhanced by reducing the undercooling and creating diamond crystallites in the Q-carbon matrix, leading to the formation of Q-carbon/diamond composites.
Conclusion
In summary, we have shown that the number density of covalently bonded carbon atoms in Q-carbon can be increased from 40% to 60%, as the packing efficiency of tetrahedra is increased from 70% to 80%. The sp 3 bonded tetrahedra are bonded to each other through a mixture of sp 2 and sp 3 bonding. This structure is achieved by nanosecond pulsed laser melting of carbon in the super undercooled state and followed by quenching. This enhancement in the number density of atoms along with stronger 3D sp 2 bonding between the tetrahedra can result in as much as 70% increase in stiffness and hardness of Q-carbon. Also, crystalline form of Q-carbon named Q-diamond is formed when DCL tetrahedra are attached with a 90° twinning rotation. The Q-diamond is expected to have interesting mechanical and other physical properties. Similar results on super stiffness and hardness have been obtained for Q-BN, which will be reported shortly.
Supplementary material
The supplementary material for this article can be found at https://doi.org/10.1557/mrc.2018.35.
Acknowledgments
We are grateful to Fan Family Foundation Distinguished Chair Endowment for J. Narayan. R. Sachan acknowledges the National Academy of Sciences (NAS), USA for awarding the NRC research fellowship. This work was performed under the National Science Foundation (Award number DMR-1735695). We used Analytical Instrumentation Facility (AIF) at North Carolina State University, which is supported by the State of North Carolina. Filippo Cellini and Elisa Riedo acknowledge the support from the Office of Basic Energy Sciences of the US Department of Energy (grant no. DE-SC0016204).
Author contributions
J. N. conceived and designed the theory and wrote the manuscript with inputs from all the co-authors. S. G. and A. B. synthesized the samples and performed the Raman spectroscopy, SEM, and HR-TEM imaging. R. S. performed electron microscopic imaging and EEL spectroscopy. F. C. and E. R. performed the performed AFM imaging and nanomechanics experiments.
Competing financial interests statement
The authors declare no competing financial interests.
Conflict of interest
The authors declare no competing financial interest.