I. INTRODUCTION
With high frequency and low stress amplitude, high cycle fatigue (HCF) behavior requires a relatively large fraction of life to produce cracks of detectable sizes and leaves a very small fraction of life for propagation to failure. This trend results in unacceptable incidence of HCF-related failures in the aircraft engine industry over the past several years. Reference Ren and Nicholas1 Especially, in aeroengines, HCF behavior is generally caused by the high-frequency aerodynamic bending vibration loads Reference Ritchie, Davidson and Boyce2 and often combined with the in-service damage due to fretting, foreign object damage (FOD), or others. Reference Ren and Nicholas1,Reference Nicholas and Zuiker3 The detailed information on the HCF capability of materials affected by such in-service damage was necessary. Reference Nicholas4 However, most existing studies on fatigue have been investigated under constant stress or strain amplitude conditions Reference Singh and Singh5–Reference Singh, Ramachandra and Singh7 and during the typical operations of turbine engine, the gas turbine blades often suffer from the HCF load conditions combined with low cycle fatigue (LCF) damage caused by changes in operating speed of the engine disk. Reference Ren and Nicholas1 Hence, studies must be conducted to obtain a fundamental understanding of the interaction between these two types of loadings, and the current study was focused on the influence of the predamage from LCF loadings on the HCF capability.
Up to now, there have been limited studies of predamage from LCF cycling on the subsequent HCF limit stress. Ren and Nicholas Reference Ren and Nicholas1 studied the effects and mechanisms of various fractions of LCF predamage on subsequent HCF limit in Ni-based superalloy Udimet 720 at room temperature. The results showed that even small fractions of LCF life led to significant reduction of the subsequent HCF limit, which was attributed to a combination of LCF damage and the plastic deformation induced during the LCF process. Nicholas Reference Mall, Nicholas and Park8 investigated the effect of prior LCF on the subsequent HCF fatigue limit in Ti–6Al–4V plate using a step-loading technique. They found that there is no significant degradation of HCF fatigue strength due to prior LCF cycling, even up to 75% of life. Huang Reference Huang, Wang and Wagner9 carried out ultrasonic fatigue tests following LCF loadings to study the strength of very high cycle fatigue (VHCF) and the results showed that LCF cycling affects the following VHCF strength obviously. According to the above-mentioned studies, we can find that the predamage from LCF loadings exhibits a different action form. Hence, for each type of material, the effect of LCF predamage should be taken into critical consideration in terms of the selection, development, and design of materials for blades.
With a desirable balance of material properties in low and medium temperature regions, Reference Srivatsan, Kuruvilla and Park10 the titanium alloys have been widely applied toward the front end of the gas turbine engine. Generally, the titanium alloys can be commercially categorized by annealed microstructure as being unalloyed, alpha and near-alpha, alpha-beta, and metastable beta alloys. The mechanical properties are strongly affected by the chemical composition, microstructure, deformation, and heat treatment history. Reference Dehghan-Manshadi, Reid and Dippenaar11 Hence, things become complicated for the distinct alpha-/beta-phase related microstructures existed in different types of titanium alloys. For a certain titanium alloy with specific initial microstructure, the mechanical properties should be sufficiently studied for safety applications. In this paper, a near alpha titanium alloy was studied and compared with most other commercial titanium alloys, the material owns exceptional creep properties, good weldability, and a relatively high tensile modulus to density ratio. Reference Li, Ma and Liu12 However, to the authors' knowledge, studies on LCF/HCF interactions are still insufficient.
Hence, this paper sought to determine the detrimental effects of LCF loading on the subsequent HCF limit stress. First, the fatigue resistance under both LCF and HCF loadings at room temperature was characterized by experimental investigations. Then, the core emphasis was focused on the influences of the varying degrees of predamage from LCF loadings on the subsequent HCF limit stresses corresponding to a life of 106 cycles. The fractures were further discussed to reveal the LCF damage mechanism on the subsequent HCF strength using scanning electron microscopy (SEM) figures.
II. EXPERIMENTS
A. Material and specimen
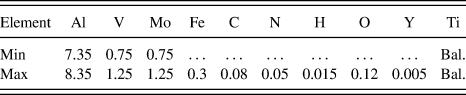
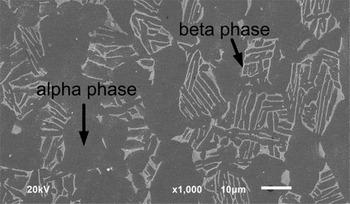
The studied material is a near alpha titanium alloy, whose chemical composition is shown in Table I. The thermal treatment specifications are as follows: 900–925 °C/1 h/air cooled + 565–595 °C/8 h/air cooled + 600–700 °C/0.25–4 h/air cooled or furnace cooled. The room temperature longitudinal tensile properties are shown as follows 13 : elastic modulus = 113.5 GPa, 0.2%-yield strength = 915 MPa, ultimate tensile strength = 940 MPa, elongation is 21%, and reduction in area is 44%. The microstructure is shown in Fig. 1, from which we can see that the studied titanium alloy is composed of elongated equiaxed alpha phase, along with a small quantity of intergranular beta phase. The black alpha phase with hexagonal close-packed (HCP) structure is the stable phase at room temperature, while the white beta phase with body-centered cubic (BCC) structure is metastable below the transition temperature. The surface fractions of alpha and beta phases are around 89.3 and 10.7%, respectively. In this paper, all tests (i.e., LCF, HCF, and LCF-predamaged HCF tests) were performed on cylindrical specimens with gauge length and gauge diameter of 25 and 7.5 mm conforming to GB/T4337-2008 specifications. Specimens were machined parallel to the longitudinal direction of the forging using low-stress grinding technique. To exclude interferer of surface machining defects, all specimens were further hand-polished successively by the grade 400, 800, 1500, and 2000 abrasive papers along loading axis before experiment. During LCF test, the axial strains were measured and gathered through an extensometer with the gauge length equal to 20 mm.
Nominal chemical composition (wt%) of the material.

SEM micrograph of microstructure.

B. Experimental procedure
In current research, a total of three types of test were conducted. To save money and time, the first involved the validity of an accelerated test method (i.e., step-loading method developed by Maxwell and Nicholas
Reference Maxwell and Nicholas14
) on determining the HCF strength, where rotary bending tests with the frequency of 83.0 Hz and the stress ratio of −1 were conducted at room temperature. In this technique, such as obtaining the HCF limit stress corresponding to 107 cycles, a specimen at a fixed stress ratio is fatigued to a limit of 107 cycles at a stress level lower than the expected fatigue limit. After each block of 107 cycles, the stress is increased by some small amount until failure occurs at less than 107 cycles. The HCF limit stress is determined using a linear interpolation scheme as described in the equation
 ${\sigma _{{\rm{eHCF}}}} = {\sigma _{{\rm{pr}}}} + {{{N_{\rm{f}}}} \over {{{10}^7}}}({\sigma _{\rm{f}}} - {\sigma _{{\rm{pr}}}})$
, where σeHCF is the maximum fatigue strength corresponding to 107 cycles, σpr is the maximum stress of the loading block prior to the failure block, and σf and N
f are the maximum stress and cycle number of the failure block. To apply a known predamage from LCF to the subsequent HCF test, the second type of tests were carried out to determine cycles to failure under specified LCF conditions. Concretely, the stress-controlled tension–tension LCF tests were conducted to failure on Shimadzu, where sine waveform (with frequency f = 2.0 Hz) under a range of stress ratios (i.e., R
σ = 0, 0.1, and 0.3) and maximum stresses (i.e., 750, 800, and 900 MPa) were adopted. Finally, the third series of tests were conducted to determine the HCF limit stress of the LCF-predamaged specimens by the step-loading technique. Concretely, the specimens were initially cycled to a designed proportion of life under stress-controlled tension–tension LCF loadings on Shimadzu. Then, these specimens were further cycled to failure using the step-loading technique on the rotary bending fatigue testing machine. Meanwhile, it should be noted that all tests were conducted according to the Standard Test Methods (i.e., GB/T15248-94 and GB/T4337-2008, respectively). After the fatigue testing, the fracture surfaces of fractured specimens under LCF and HCF loadings were observed by SEM. Meanwhile, part of the specimens were sectioned along the axial direction and then polished. After etching, the longitudinal sections were also observed by SEM to exhibit the crack initiation and growth behavior.
III. TEST RESULTS
A. Cyclic deformation response
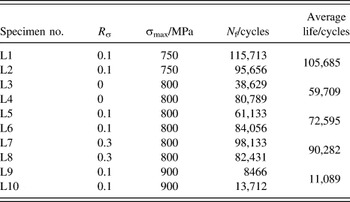
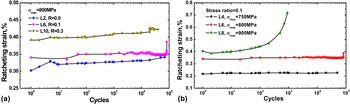
Ratcheting can deteriorate the performances of a component by the cumulative effects of fatigue damage Reference Paul, Sivaprasad and Dhar15 and there is no strain accumulation in HCF test with low load levels. Hence, cyclic strain responses with increased cycles under different LCF loading conditions (shown in Table II) were measured using an extensometer. Generally, the ratcheting strain can be defined as the position of the center of the hysteresis loop on the strain axis, so axial ratcheting strain εr is expressed as εr = (εmax + εmin)/2, where εmax is the maximum of the axial strain and εmin is the minimum axial strain for a particular cycle. The accumulated ratcheting strain is shown in Figs. 2(a) and 2(b), from which it can be found that all specimens display a certain degree of softening phenomenon but apparent strain accumulation is only occurred under σmax = 900 MPa [shown in Fig. 2(b)], which seems to be increased continually throughout the test. Therefore, for this near alpha titanium alloy, there is obvious ratcheting phenomenon when the maximum LCF load is close to 0.2%-yield strength at room temperature.
LCF testing matrix.

Ratcheting strain response under different LCF loadings.

B. Fatigue strength
To save money and time, the validity of an accelerated test method named as the step-loading method for determining the HCF strength was verified firstly, where tests were conducted on rotary bending testing machine with a frequency of 83.0 Hz and a stress ratio of −1. As is shown in Table III, the specimens under HCF tests were named successively as H1, H2, and H3. The concrete step numbers, the initial and final fatigue stress are summarized, from which the HCF limit stress for each specimen corresponding to 106 and 107 cycles was easily determined (i.e., 409.5 and 401.8 MPa for 107 cycles and 457.6 MPa for 106 cycles). Hence, the average values of the limit stresses corresponding to 106 and 107 cycles are 457.6 and 405.7 MPa, respectively. The limit stress corresponding to 106 cycles was further determined as 457.6 MPa. Meanwhile, according to the material handbook, 13 the HCF limit stresses have been determined by the conventional rotary bending testing method. The limit stresses corresponding to 106 and 107 cycles are 454 and 399 MPa, respectively. Hence, we can conclude that the step-loading method can be well used to reveal the HCF limit stresses of this material quickly.
Rotary bending HCF test results by step-loading method (R σ = −1).

To apply a known predamage from LCF to the subsequent HCF test, the LCF tests were then conducted to failure under specified loading conditions. As is shown in Table II, a range of maximum stresses (i.e., 750, 800, and 900 MPa) and stress ratios (i.e., 0.0, 0.1, and 0.3) have been adopted. The specimen number was named successively, such as L1, L2, L3, and so on. Two specimens were tested at each loading condition and their average value was assumed as the corresponding baseline LCF strength. The LCF results also show that the LCF strength is affected by both stress amplitude and mean stress. Roughly, the LCF lives at σmax = 800 MPa are increased with the increased stress ratio, which can be attributed to the decreased stress amplitude with the increased stress ratio at the constant maximum stress. Meanwhile, the LCF life at R σ = 0.1 is decreased evidently with increased σmax, which is generally caused by the increased tensile mean stress with increased σmax at constant stress ratio.
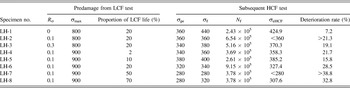
In the above-mentioned LCF tests, the baseline LCF strength under different loading conditions has been determined. Then, as is shown in Table IV, a total of eight levels of predamage from LCF were introduced into specimens, and these specimens were further tested to failure using the step-loading technique on rotary bending testing machine. Then the LCF-predamaged HCF strength corresponding to a life of 106 cycles was easily calculated. It should be noted that these specimens were named successively, such as LH1, LH2, and so on. The results exhibit that these varying degrees of predamage conditions (even 2% of initial LCF life) do affect the subsequent HCF strength for 106 cycles, which varies from 424.9 to less than 280 MPa with predamage, compared to 457.6 MPa without predamage. The deterioration rate of the HCF strength in Table IV is defined as
 ${{\left| {457.6 - \sigma _{{\rm{eHCF}}} } \right|} \mathord{\left/ {\vphantom {{\left| {457.6 - \sigma _{{\rm{eHCF}}} } \right|} {457.6}}} \right. \kern-\nulldelimiterspace} {457.6}} \times 100\%$
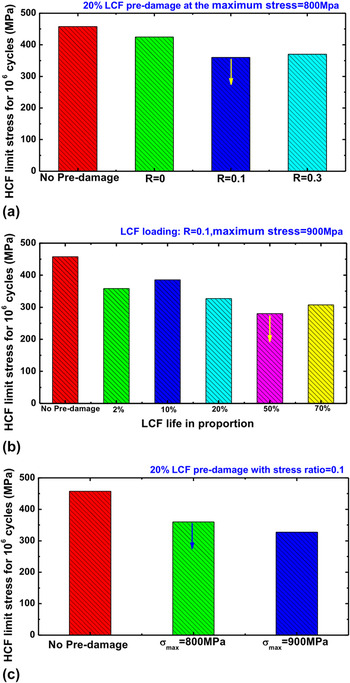
, whose values are ranged from 7.2% to more than 38.8%. Further, as is shown in Figs. 3(a)–3(c), the prior LCF damage was distinguished by proportion of LCF life, stress ratio, and the maximum cycling stress to clearly reveal the influences of LCF predamage on HCF strength, where all the obtained results were compared with the pure HCF limit stress. With initial 20% LCF life under the maximum cycling stress of 800 MPa, the influence of LCF predamage affected by stress ratios on HCF strength is shown in Fig. 3(a), from which we can roughly see that the LCF predamage at the higher stress ratio leads to the lower HCF strength. This phenomenon may be due to the mean stress effect on LCF predamage. Meanwhile, with the stress ratio of 0.1 under the maximum cycling stress of 900 MPa, the HCF strength with different proportions of initial LCF predamage is shown in Fig. 3(b). On the whole, it can be found that the increased proportion of LCF predamage leads to decreased HCF strength. Similarly, with initial 20% LCF life under different maximum cycling stresses, the HCF strength is shown in Fig. 3(c), from which we can see that the higher the maximum cycling stress, the lower HCF strength is obtained. This phenomenon may be due to the irreversible cyclic plastic deformation behavior happened at 900 MPa shown in Fig. 2(b).
HCF strength affected by various degrees of LCF predamage: (a) stress ratio; (b) proportion of LCF life; (c) the maximum cycling stress.

LCF-predamaged HCF limit stresses (units: stress in MPa and fatigue life in cycles).

IV. FRACTURE ANALYSIS
In this section, SEM observations on fracture surfaces had been carried out fully on broken specimens to analyze the corresponding fracture mechanisms, which were tested under HCF, LCF, and HCF loadings with LCF predamage.
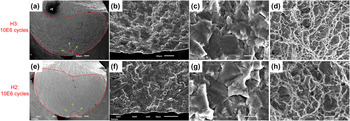
As is shown in Fig. 4, the observations of the fracture surfaces of specimens H2 and H3 (corresponding to 1E6 and 1E7 cycles) tested by step-loading technique were conducted for revealing the typical HCF failure mechanisms, from which we can find there were three typical cracking regions (i.e., crack initiation region in Figs. 4(b) and 4(f), crack propagation region in Figs. 4(c) and 4(g), final fracture region in Figs. 4(d) and 4(h)) with distinct microscopic features on the fracture surface. Figure 4(a) shows that flat fracture surface was formed with big propagation region. Figure 4(b) exhibits that the crack was surface-initiated and only one fatigue source was propagating inward, where typical cleavage fractured facets with weakly developed secondary cracks were partially observed. The crack initiation region with radial lines was very flat and, along the opposite direction, these radial lines were converged to the crack initiation position. The morphology at the center part of the crack propagation region is shown in Fig. 4(c), where secondary cracks, shallow dimples surrounding the cleavage facets, and well-developed fatigue striations on cleavage facets and secondary cracks were obviously observed. The final fracture features with fine equiaxed ductile dimples are shown in Fig. 4(d). Roughly, there were no particularly observable differences on crack characteristics between the specimens corresponding to 1E6 and 1E7 cycles.
SEM pictures for specimens H3 and H2 (106 and 107 cycles): (a and e) overall morphology; (b and f) crack initiation region; (c and g) crack propagation region; (d and h) final fracture region.

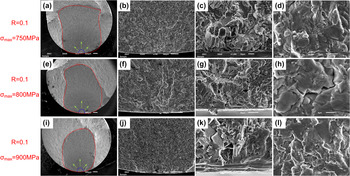
Furthermore, fracture surfaces of specimens tested under LCF loadings at R σ = 0.1 with different σmax are shown in Fig. 5, where four SEM photos were taken from the fracture surface for each specimen in four similar regions. Take the specimen tested at σmax = 750 MPa for example, an overall morphology of the fracture with three distinctly different feature regions is shown in Fig. 5(a), the crack initiation region is shown in Fig. 5(b), the enlarged local initiation region is shown in Fig. 5(c), and the crack propagation region is shown in Fig. 5(d). As is shown in Figs. 5(a) and 5(b), the crack was initiated at the specimen surface and relatively small region of crack propagation combined with relatively big region of final fracture were occurred. As is shown in Fig. 5(c), the enlarged area of the crack initiation region shows obvious transgranular cleavage facets containing feather-like features. In Fig. 5(d), we can see well-developed fatigue striations in cleavage facets, whose directions are roughly perpendicular to the crack propagation direction and the locally existed misorientation is due to the specific grain orientation. Roughly, although the higher maximum stress of 900 MPa (near 0.2%-yield strength = 915 MPa) causes obvious ratcheting strain [shown in Fig. 2(b)], there were no particularly observable differences on crack characteristics of these specimens tested under different σmax. However, the higher applied loads resulted in small stable crack propagation region, while the lower applied loads led to a smaller area of fast fracture, which were coincident with the conclusion that the region size of fatigue crack propagation is related to the load level. Reference Totten16
LCF fracture of specimens at different σmax with R σ = 0.1: (a, e, and i) overall morphology; (b, f, and j) crack initiation region; (c, g, and k) enlarged crack initiation region; (d, h, and l) crack propagation region.

Compared with Figs. 4 and 5, the fracture surfaces of specimens tested under pure LCF and pure HCF loadings exhibited obvious differences in fracture mechanism. In general, cleavage associated with the crack initiation stage was more developed in HCF than LCF because cleavage was a low-energy fracture that propagates along well-defined low index crystallographic planes known as cleavage planes. Reference Mall, Nicholas and Park8 Hence, the specimens under HCF loadings showed more flat fracture surface, bigger propagation region, and more well-developed cleavage facets than the specimen tested under pure LCF in crack initiation region.
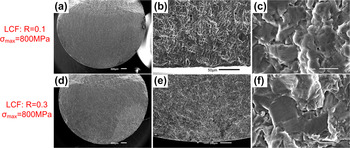
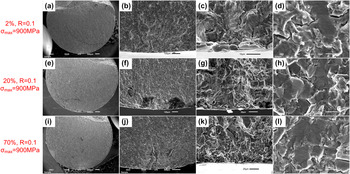
As are shown in Figs. 6 and 7, SEM observations have been fully carried out to compare these fractographs of these HCF specimens with various degrees of predamage from LCF cycling. The influence of predamage from LCF at σmax = 800 MPa with different stress ratios on fracture mechanism is shown in Fig. 6, and effect of various proportions of LCF life at σmax = 900 MPa on fracture mechanism is further shown in Fig. 7. Compared with the above-mentioned fracture properties in pure LCF and pure HCF tested specimens, we can find that the overall fracture surfaces in Figs. 6 and 7 show typical HCF morphologies, such as flat fracture surfaces and relatively big crack propagation regions. However, the microscopic features in local crack initiation region exhibit typical LCF characteristics due to the effects of strain accumulation during LCF which influences the features of cleavage facet, Reference Mall, Nicholas and Park8 such as high roughness, obvious transgranular cleavage facets containing feather-like features. Furthermore, there was no apparent difference of failure characteristics in crack initiation region with and without LCF predamage. Meanwhile, as is shown in Fig. 6, the LCF predamage with stress ratios of 0.1 and 0.3 exhibited no obvious difference on fracture surface, and as is shown in Fig. 7, different proportions of LCF predamage (i.e., ranging from 2–70%) also showed no particularly observable differences on fracture features. It has been reported that, generally, the surface microcracks nucleate after only 10% of the LCF life while more than 60% of the fatigue life is necessary in HCF, Reference Brechet, Magnin and Sornette17 which agrees with our observation on LCF fracture properties in crack initiation regions of LCF predamaged specimens (i.e., even 2% proportion of prior LCF life resulted in obvious LCF failure characteristics in crack initiation region). Furthermore, it has been concluded that the prior LCF loading leads to the accelerated fatigue crack growth rate of subsequent HCF test. Reference Russ18 Hence, we assumed that, with the fracture characteristics in LCF mode by the prior LCF loadings, the fatigue crack growth rate of the subsequent HCF test is accelerated, leading to the reduction of HCF limit stress.
Fracture analysis of specimens tested under LCF-predamaged HCF loadings: (a and d) overall morphology; (b and e) crack initiation region; (c and f) crack propagation region.

Fracture analysis of specimens tested under LCF-predamaged HCF loadings: (a, e, and i) overall morphology; (b, f, and j) crack initiation region; (c, g, and k) enlarged crack initiation region; (d, h, and l) crack propagation region.

V. CONCLUSIONS
Experimental investigations on HCF strength affected by predamage from LCF of a near alpha titanium alloy at room temperature were carried out here; the main conclusions were summarized as follows:
-
(1) The step-loading method was proved to be well used to reveal the HCF limit stresses of this material quickly. The baseline LCF strength was obtained over a range of maximum stresses and stress ratios to provide the quantitative LCF predamage.
-
(2) A total of eight levels of predamage from LCF, distinguished by proportion of LCF life, stress ratio, and the maximum cycling stress, were introduced into the subsequent test on HCF limit stress corresponding to the life of 106 cycles. The results exhibit that these varying degrees of predamage conditions (even 2% of initial LCF life) do affect the subsequent HCF strength. The deterioration rate of the HCF strength was ranged from 7.2% to more than 38.8%.
-
(3) Fracture mechanisms under HCF, LCF, and HCF loadings with LCF predamage had been carried out fully. Compared with the fracture properties of specimens under pure LCF and HCF loadings, the overall fracture surfaces of specimens with predamage were observed with typical HCF morphologies, however, typical LCF characteristics were exhibited in the local crack initiation region. Hence, with the fracture characteristics in LCF mode by the prior LCF loadings, the fatigue crack growth rate of the subsequent HCF test was accelerated, leading to the reduction of HCF limit stress.
ACKNOWLEDGMENTS
The research was supported by National Program on Key Basic Research Project (973 Program, No. 2015CB057400), National Natural Science Foundation of China (No. NSFC 51275023), and the Innovation Foundation of BUAA for PhD Graduates (No. YWF-14-YJSY-49).