

1. Introduction
In the UK, there has been an increase in the participation of women aged 16–64 in the labor force over the last four decades. In the period from January to May 2023, about 72.4% of women were in work,Footnote 1 an increase from 67% in 2013 and 53% in 1971.Footnote 2 According to the Office of National Statistics, in 2021 more than 83% of women aged 25–35 without children are employed, while for those with children the employment rate is around 66.5%. For women aged 35–49, the employment rate for both groups, with and without children, was similar at around 80%. Only about 39.3% of single mothers whose youngest child was up to 3 years old were working, compared to 65.2% of young mothers living with a partner. The employment rate of mothers whose youngest child was of primary school age (4–10 years old) was higher (74.2%) if they were in a couple than if they were single mothers (61.4%).
The increase in female employment has prompted research into the relationship between maternal employment and children's cognitive and physical outcomes (Ruhm, Reference Ruhm2008; Greve, Reference Greve2011; Mendolia, Reference Mendolia2016). There is little evidence on the impact of maternal employment status on children's well-being, even if it is key to the acquisition of soft or non-cognitive skills as children develop. In recent years, evidence has accumulated on the role that the acquisition and development of non-cognitive skills in childhood play in later labor market success (Heckman et al., Reference Heckman, Stixrud and Urzua2006; Cunha et al., Reference Cunha, Heckman and Schennach2010). Non-cognitive skills are important factors in explaining human capital development. They positively influence future wages and employment opportunities (Heckman et al., Reference Heckman, Stixrud and Urzua2006; Lindqvist Vestman, Reference Lindqvist and Vestman2011).
There are different mechanisms by which maternal work and work intensity can affect a child's well-being in various dimensions. For example, working long hours may have a negative relationship with a child's well-being because the mother spends less time with the child, provides less emotional support and participates less in school and extracurricular activities (Mendolia, Reference Mendolia2016). At the same time, work intensity may have a positive association with maternal life satisfaction (Berger, Reference Berger2013); and the psychology literature has shown that maternal well-being partly explains children's well-being (Richter et al., Reference Richter, Bondu, Spiess, Wagner and Trommsdorff2018). Therefore, it is possible that the positive effects of higher maternal work intensity cancel out or even offset the negative ones.
In this paper, we use data from the UK Millennium Cohort Study (MCS) to understand the relationship between maternal work intensity and child well-being. We employ subjective indicators of child well-being. Within this study, we initially scrutinize the child's subjective assessments of happiness and formulate a composite index that consolidates the child's self-evaluations across various dimensions pertinent to a child's well-being. Additionally, we create an index encompassing happiness assessments reported by the child, parents, and teacher. Our baseline findings suggest a positive association between maternal employment and child well-being, particularly regarding the number of hours worked, with significance at the intensive margin but not at the extensive margin. To address omitted variable bias, we test the stability of coefficients and find that our base case results are reliable. However, the interpretation of our estimates remains as an association. The indices that capture responses from the child, parent and teacher suggest a positive and larger association between maternal employment and child happiness both at the extensive and intensive margin at the age of 7. These effects only prevail at the intensive margin at the age of 11. The indices precisely estimated are those of the mother and the teacher, suggesting the happiness assessment when the child is taken into account may not alone be truly informative of their level of happiness.
We find there are no differences across the income distribution of maternal labor supply on happiness. We also investigate the influence of maternal commuting time, and our results suggest notable associations with child well-being. Commuting time is negatively associated with child happiness but these relationships are only present when the child is seven. In an attempt to understand whether family structure matters, we re-estimate our specifications using the sub-sample of children living with both parents. Paternal employment increases happiness at age 7 for children in the top quartile of income, but this effect is reversed at age 11. Overall, parental employment does not influence maternal decisions on labor supply.
This paper contributes to the literature on maternal work and children's well-being in several ways. First, our research is the first to consider happiness in addition to other measures of emotional health, as opposed to life satisfaction. Although life satisfaction and happiness are related, happiness is a more immediate measure while life satisfaction tends to be a more reflective assessment of one's life (Ng, Reference Ng2022), which might require a level of cognitive development that children have not yet reached (Ramia Voicu, Reference Ramia and Voicu2022). Also, happiness in children has been linked to positive development outcomes such as better school performance, social relationships, and physical health (Proctor et al., Reference Proctor, Linley and Maltby2009). Second, our empirical approach differs from the existing literature because of the array of outcome variables we use, which include self-reported child's happiness and a composite measure that captures several aspects of the child's emotional well-being, as well as indices combining child, mother and teacher's answers to the child's happiness. This strategy diminishes the potential cognitive biases arising from relying solely on single self-reported measures. Third, in contrast to existing evidence focusing on adolescent life satisfaction studies, our sample includes children during mid-childhood, moving away from the endogenous emotional changes experienced by adolescents during this period of their lives. Finally, we add to the literature by including not only the mother's labor supply but also accounting for the mother's commuting time.
The paper is structured as follows. Section 2 discusses the related literature. Section 3 presents the empirical strategy and framework. Section 4 describes the MCS, well-being, and maternal labor supply variables and other control variables of interest. In section 5 we show the results for all well-being dimensions examined and some robustness checks. Section 6 concludes.
2. Background literature
There is a large literature examining the impact of maternal employment on various dimensions of children's development. One of the most studied strands concerns the effect of maternal employment on cognitive development. Maternal employment during the first year of life appears to have the most detrimental effect on cognitive development (Waldfogel et al., Reference Waldfogel, Han and Brooks-Gunn2002; Ruhm, Reference Ruhm2004; James-Burdumy, Reference James-Burdumy2005). This effect persists later in childhood and youth (Ermisch et al., Reference Ermisch, Francesconi and Pevalin2004; Bernal, Reference Bernal2008; Ruhm, Reference Ruhm2008; Bernal Keane, Reference Bernal and Keane2010; Ermisch Francesconi, Reference Ermisch and Francesconi2013). Some estimates suggest that the effect of maternal employment is small and depends largely on family structure (Gregg et al., Reference Gregg, Washbrook, Propper and Burgess2005; Verropoulou Joshi, Reference Verropoulou and Joshi2009).
Another strand of the literature has examined the relationship between maternal working hours and risk behaviors, with mixed evidence. Children of working mothers who rely on non-parental care are less likely to engage in risky or antisocial behaviors, such as truancy, alcohol and/or drug use, stealing or harming others, and are also more likely to participate in after-school sports activities (Aizer, Reference Aizer2004; Lopoo, Reference Lopoo2007). While maternal work increases the likelihood of smoking, the effects of working mothers on teenage pregnancy are mixed, with some evidence suggesting that children of working mothers are more likely to develop behavioral problems (Lopoo, Reference Lopoo2004; Ermisch et al., Reference Ermisch, Francesconi and Pevalin2004; Berger et al., Reference Berger, Hill and Waldfogel2005). Conversely, there is also some research that finds no statistically significant relationship between the mother's employment status and children's risk behaviors (Aughinbaugh Gittleman, Reference Aughinbaugh and Gittleman2004).
Children's health may also be negatively affected by maternal employment. A wide range of health outcomes, such as subjective health, hospital stays, asthma distress, injuries, and poisoning, are negatively affected by maternal employment (Gennetian et al., Reference Gennetian, Hill, London and Lopoo2010; Morrill, Reference Morrill2011). The evidence overwhelmingly suggests a negative impact on children's body mass index (Anderson et al., Reference Anderson, Butcher and Levine2003; Phipps et al., Reference Phipps, Lethbridge and Burton2006; Ruhm, Reference Ruhm2008; Morrissey et al., Reference Morrissey, Dunifon and Kalil2011; Fitzsimons Pongiglione, Reference Fitzsimons and Pongiglione2019). This is particularly relevant given the increasing trend in children's obesity for the last 20 years.Footnote 3 There is also evidence that the impact of maternal work is mediated by the quality of childcare and the contribution of fathers to child-rearing so that the net effect is zero (Greve, Reference Greve2011).
The effect of maternal employment on children's life satisfaction has received less attention. Powdthavee Vernoit (Reference Powdthavee and Vernoit2013) examine the impact of paternal unemployment on adolescents’ life satisfaction. Their results suggest that paternal unemployment is positively associated with life satisfaction for younger adolescents, while this association dissipates for older adolescents and is highly dependent on which parent suffers the period of unemployment. In contrast, Mendolia (Reference Mendolia2016) finds no evidence that children of working mothers have lower life satisfaction. However, when the negative effect prevails, it is not limited to contemporaneous levels but lasts into later adulthood. Young adults whose parents were unemployed during early and late childhood have lower life satisfaction when they become young adults. Our paper directly relates to Powdthavee Vernoit (Reference Powdthavee and Vernoit2013) and Mendolia (Reference Mendolia2016), as the aim is to examine maternal employment on child well-being. However, our paper examines the well-being of younger children, in the pre-adolescence stage, and uses a wider range of well-being measures, including a composite measure of happiness, as opposed to life satisfaction.
The literature on maternal employment and child well-being has typically been limited to the analysis of working time only. This approach excludes the mother's commuting time, which adds to her total time away from home. In the economics literature, commuting has been defined as a time-consuming activity that has detrimental effects on individual well-being (Stutzer Frey, Reference Stutzer and Frey2008).Footnote 4 The detrimental effect of commuting is heterogeneous by gender. Women's psychological health is more affected by commuting than men's, even after taking into account possible compensation through better housing and/or wages (Roberts et al., Reference Roberts, Hodgson and Dolan2011). Thus, the effect of maternal commuting time on children's well-being might not only be direct (reducing time spent on child development activities) but also indirect if commuting negatively affects the mother's well-being and this, in turn, changes the quality of parenting provided. In our results section, we explore the effect of adding commuting time to the mother's work on child well-being.
Although maternal employment tends to hurt children's cognitive development, risk behaviors, and health, these effects are heterogeneous across a range of factors. There are differences in the magnitude of the effect (Verropoulou Joshi, Reference Verropoulou and Joshi2009; Gregg et al., Reference Gregg, Washbrook, Propper and Burgess2005) and across income distribution (Anderson et al., Reference Anderson, Butcher and Levine2003; Lopoo, Reference Lopoo2004; Ruhm, Reference Ruhm2008), and is further affected by the timing and intensity of maternal employment (Berger et al., Reference Berger, Hill and Waldfogel2005; von Hinke Kessler Scholder, Reference von Hinke Kessler Scholder2008; Ermisch Francesconi, Reference Ermisch and Francesconi2013), childcare provision (Gregg et al., Reference Gregg, Washbrook, Propper and Burgess2005; Greve, Reference Greve2011), and family structure (Ruhm, Reference Ruhm2004; Gregg et al., Reference Gregg, Washbrook, Propper and Burgess2005; Fitzsimons Pongiglione, Reference Fitzsimons and Pongiglione2019). The existing differences across individual characteristics already highlighted by the literature motivate our sub-sample analysis where we look at changes to the base-case results according to income distribution and family structure.
3. Empirical strategy and framework
As in Ruhm (Reference Ruhm2008), we estimate an additive separable function in which the dependent variable is child well-being and the arguments are the mother's labor supply in the current period, as well as a rich set of covariates to minimize omitted variable bias. The function we estimate is as follows:

where cw it is child i's emotional well-being at each wave t = 1, 2; ψ is a constant; h it refers to one of the employment variables that we examine; X it is a vector of child, mother, and family characteristics that control for happiness production-shifters; and $\epsilon _{it}$ is a disturbance defined as $\epsilon _{it} = \upsilon _{it} + d_{i}$
 , where d i represents unobserved heterogeneity, and υit an i.i.d. error term.
We estimate model (1) for a selected set of child well-being measures by applying weighted ordinary least squares (OLS), which corrects for attrition using the weights provided in the MCS. Linear regression models have been preferred to non-linear models because they allow direct interpretation of the coefficients and, in the case of fixed effects and/or interaction terms, retain the significance of the coefficients (see Gomila, Reference Gomila2021 and Hellevik, Reference Hellevik2009, for a discussion of the relative merits of logit and linear regression models, and Angrist Pischke, Reference Angrist and Pischke2021, for an in-depth analysis).
The existence of unobservable factors in d i that are correlated with maternal labor supply might bias the coefficient associated with maternal work. The most common approach to minimize this potential bias is to include a rich set of explanatory variables unrelated to the labor supply decision (Ruhm, Reference Ruhm2004; Gregg et al., Reference Gregg, Washbrook, Propper and Burgess2005; Ruhm, Reference Ruhm2008). Even after controlling for a comprehensive set of covariates, we are unable to rule out other sources of heterogeneity arising from unobserved characteristics. For instance, OLS estimates will still be potentially biased if we omit proxy variables to capture the personality traits of the child that will naturally influence their well-being. In an attempt to explore the extent to which our estimates are affected by omitted variable bias, we check for coefficient stability and quantify the bias-adjusted β following Oster (Reference Oster2019). The coefficient for h may exhibit increased variance and potential instability if covariates that also influence the labor supply of the mother, such as household income or paternal employment, are included in the model. We exclude these variables from our main specifications but explore the association of father's employment in ad-hoc analysis and we also look at the association of children's well-being and maternal work across different quartiles of the income distribution.
The association with employment is potentially ambiguous, as increased working hours reduce the time available to interact with the child, but at the same time allow the possibility of acquiring inputs that positively affect the child's development. As Becker (Reference Becker1960) or Mincer (Reference Mincer1963) pointed out, increasing the wages available to women in the labor market would have an effect both on the quality of education that mothers could provide for their children and on the number of children they would be willing to have. Technological progress in the labor market has been faster than in the household, so both the imputed cost of time and effort devoted to children is likely to have increased (Lee, Reference Lee2015).
In our study, we employ various variables concerning maternal employment. The first variable of interest relates to employment status, specifically whether the mother is employed or not. This binary variable might capture the overall association of maternal employment on child well-being, considering factors such as role modeling, family dynamics, and time availability. The second variable focuses on the number of hours worked, conditional on the mother being employed. Research in child development and psychology suggests that the hours a mother works (intensive margin) can have different effects on children's emotional well-being (Kalil Dunifon, Reference Kalil, Dunifon, Crosby and Su2014; Dunifon Kalil, Reference Dunifon, Kalil, Crosby and Su2013; Crouter et al., Reference Crouter, Bumpus, Maguire and McHale1999) compared to the simple dichotomy of working vs. not working. Thus, it is important to distinguish between them. The third variable is a variation of the intensive margin measure in which hours of work are classified into a categorical indicator with five distinct groups.
The relationship between maternal labor supply and children's well-being may follow different patterns, as a result of the underlying mechanisms at play in each of them. First, child development and well-being may vary at different stages of the life cycle, particularly between ages 7 and 11. As children grow older, their needs, experiences, and the relative importance of the family environment evolve. Consequently, the relationship between maternal employment and child well-being may differ between these age groups. For example, younger children may require more direct caregiving and supervision, making maternal availability more critical. In contrast, older children may be more independent but still benefit from maternal presence and support. Therefore, we anticipate that the influence of maternal employment on child well-being will be heterogeneous across these distinct stages of their life cycle. Throughout the paper, our analysis will explore differences arising from age.
Second, the relationship between maternal employment and the well-being of children may exhibit variations across income levels. We anticipate heterogeneous relationships at the higher and lower ends of the income distribution. Toward the lower end of the income distribution, where families may face economic challenges, maternal employment could have positive effects by contributing to improved financial stability and access to resources. It may also have negative consequences if this leads to less time spent with the child. In contrast, at the top end of the income distribution, the financial benefits of maternal employment may be less critical, and any negative impact on child well-being due to reduced maternal time and attention could become more prominent. Hence, we hypothesize that the associations between maternal employment and child well-being differ across the income distribution and examine whether these differences exist.
Third, differences in the estimate of the mother's labor supply may arise according to household composition, i.e., when the father resides at home vs. not. When both parents are present and work, maternal employment might lead to reduced availability of time for child care and family activities, potentially affecting child well-being negatively, but, at the same time, it may contribute positively to family income without significantly altering parental childcare. We will present results focusing on households where both parents cohabit and tease out the role of the maternal work when the father's employment is accounted for.
4. Data
We examine the subjective well-being of children aged 7 and 11 years old in the UK using data from the MCS. This survey follows nearly 19,000 children born in the UK in 2000–2001. The first wave was collected when children were 9 months old, with further waves of data collection to track this cohort of children across their early childhood years and into adulthood. It contains information on a wide range of areas such as child behavior and cognitive development, child and parental health, parents’ employment and education, income, housing, neighborhood and residential mobility, and social capital and ethnicity. Our sample includes all children regardless of family structure; that is, living with both natural parents, with the mother only, or with the natural mother and a partner (non-biological father).
We use data from waves 4 and 5, when the children were 7 and 11 years old, respectively. The data are limited to these two waves for two main reasons. The first is to ensure that we can use a consistent set of well-being indicators in the analysis, as not all well-being measures were collected uniformly in the earlier waves. Second, we restrict the analysis to these ages to capture children before adolescence and exclude later waves when children have entered adolescence. Children's indicators of emotional well-being undergo acute changes when children reach puberty (Jozefiak et al., Reference Jozefiak, Larsson and Wichstrøm2009; Conti Heckman, Reference Conti and Heckman2012) and their brain experiences structural changes from 11 to 14 (Bodison et al., Reference Bodison, Colby and Sowell2020). In addition, adolescence is associated with decreased emotional well-being (Bluth et al., Reference Bluth, Campo, Futch and Gaylord2017).
4.1. Outcome variables
4.1.1. Emotional well-being
Our primary outcome variables are based on self-reported ratings of various dimensions of emotional well-being available in the MCS dataset. Emotional well-being reflects “the emotional quality of an individual's everyday experience” (Kahneman Deaton, Reference Kahneman and Deaton2010). These experiences include anxiety, worry, or happiness among many others, all leading toward positive or negative feelings (Choi, Reference Choi2018). We first explore self-reported happiness as a positive measure of emotional well-being. At age 7, children answer the following question: “How often do you feel happy?” The response options are “All of the time,” “Some of the time,” and “Never.” At age 11, the question is: “On a scale of 1 to 7, where 1 means completely happy and 7 means not at all happy, how do you feel about your life as a whole?”
In addition to the happiness measure, we also investigate four other well-being dimensions that reflect negative experiences. We exploit information related to the child's level of worry, temperament, experiences of bullying, and their behavior toward others. We have selected these four questions for consistency across waves. The questions included in the child's questionnaire at age 7 were as follows: “How often do you get worried?,” “How often do you lose your temper?,” “How often do other children bully you?,” and “How often are you horrible to other children at school?” The response options were “All of the time,” “Some of the time,” and “Never.” At age 11, questions related to worry and temper were slightly modified, asking the child to reflect on their experiences in the 4 weeks prior to completing the questionnaire, e.g., “In the last four weeks, how often did you get worried about what would happen to you?” and the number of response options was expanded to five: “Almost always,” “Often,” “Sometimes,” “Almost never,” and “Never,” and the questions regarding being bullied and behaving horribly were reformulated as “How often do other children hurt you or pick on you on purpose?” and “How often do you hurt or pick on other children on purpose?” There were six possible responses, ranging from “Never” to “Most days.” All outcome variables are adjusted so that lower values correspond to negative feelings (such as not feeling happy or experiencing consistent bullying).
We follow the approach described in Anderson (Reference Anderson2008) to create a standardized summary index that combines the four areas of losing temper, being worried, bullying, and being bullied. Given the need to assess multiple dimensions of well-being, this index is a suitable approach to avoid, due to the multiplicity of indicators, wrongly rejecting the null hypothesis that the overall effect is significant (i.e., committing type I errors). The summary index is a robust method to compare groups, accounting for the correlations and non-normality of the variables. Aggregating variables into an index can reduce noise, as random errors that are not related across indicators tend to cancel out with more indicators and this makes of a summary index a better outcome. The summary index is formulated through the application of a generalized least-squares weighting method. This approach confers a primary advantage in enhancing efficiency by assigning reduced weight to highly correlated indicators and greater weight to uncorrelated indicators. Consequently, indicators that offer novel information are accorded greater significance within the index.
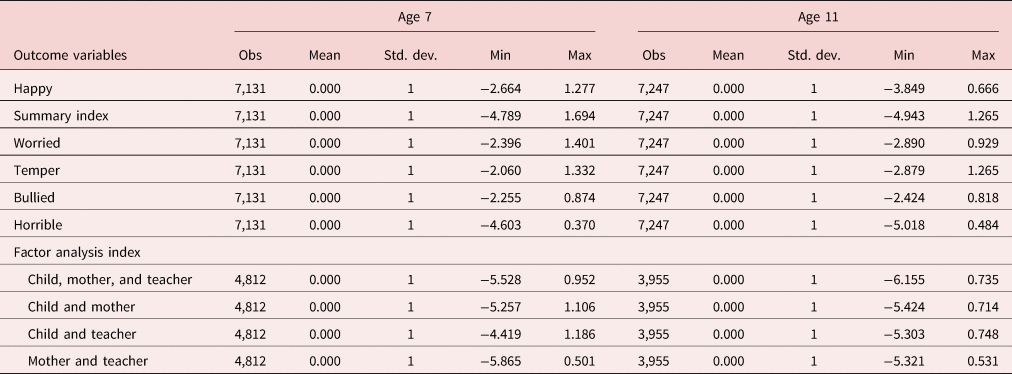
Table 1 shows the descriptive statistics of the happiness variable, the summary index, and the individual well-being variables. All these well-being variables are normalized to a mean of zero and a standard deviation of one.
Well-being variables – summary statistics

Notes: This table presents the summary statistics for the happiness response given by the child, the summary index that we have created using Anderson (Reference Anderson2008) and the statistics for the individual well-being variables. All these variables are standardized. The indices generated using factor analysis combine answers to the happiness question from the child, mother, and teacher. Responses to the happiness variable are of categorical nature, whereas the summary index is a continuous variable.
Finally, children in the MCS may encounter challenges when interpreting well-being questions due to their ongoing personality development (Holder Klassen, Reference Holder and Klassen2010). Personality might not become stable until the age of 30, when adults are likely to have accomplished enough major life transitions such as starting a family, completing education, or getting settled into their careers (Costa McCrae, Reference Costa and McCrae1994; Coffey et al., Reference Coffey, Gallagher, Desmond and Ryall2014). Children in the MCS answer questions about their well-being at 7 and 11 years of age when their personalities are still developing (Holder Klassen, Reference Holder and Klassen2010). Thus, their understanding of questions on happiness such as “How often do you feel happy?” might vary depending on their phrasing and children's perception and ability to understand. The summary index described above means to attenuate this by combining the different aspects.
In the robustness section of our paper, we go further and use factor analysis (Chetty et al., Reference Chetty, Friedman, Hendren, Stepner and Team2021) to create an index that combines the answers of the child, parent, and teacher to the happiness question. We then generate several indices exploiting all possible combinations of the three types of respondents (child, mother, and teacher; child and mother; child and teacher; mother and teacher).Footnote 5 Summary statistics for these indices are also available in Table 1.
4.2. Control variables
4.2.1. Maternal employment
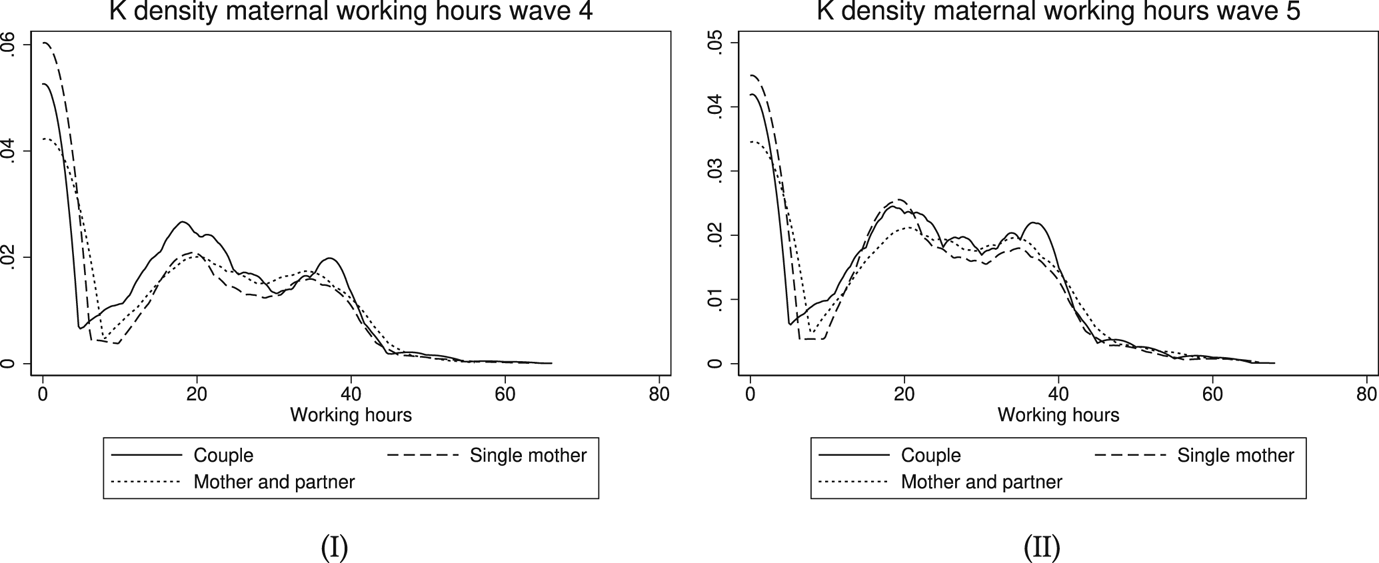
We explore three different maternal employment measures in our specifications. To account for differences in working patterns we look at the extensive and intensive margin of maternal labor supply. First, we consider a binary variable that indicates whether the mother is employed. We then explore the impact at the intensive margin by defining the number of weekly hours worked. Researchers have defined maternal working hours as the total number of weekly hours divided by 20 such that the estimated coefficient captures the effect of a one-unit increase equivalent to 20 h of additional work (Ruhm, Reference Ruhm2008; Mendolia, Reference Mendolia2016). This is a large increase in working hours and unlikely to be representative of the working patterns of mothers in the UK, where working arrangements are generally flexible and allow mothers to work any proportion of their time from zero to full-time. Based on this and to ease the interpretation of our results, we divide the number of hours worked by 10.Footnote 6 Figure 1 displays the kernel densities of the continuous variable of working hours across the two waves by family structure.Footnote 7 The density function shows that working patterns concentrate at around 20 and 40 h a week but there is large heterogeneity in the supply of weekly hours worked.
Maternal work intensity by family type.

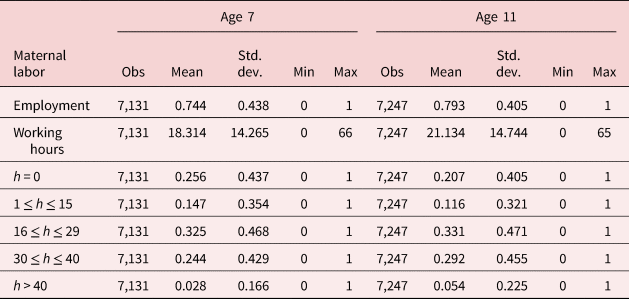
The third employment measure is a categorical variable determined by the distribution of hours worked by mothers in the MCS sample as shown in Figure 1. Except for the zero hours area, the shape of the density is quite similar for all families in both waves. The bulk of N concentrates mainly in three peaks: 0, approximately 16, and 40 h per week. We also observe a drop at about 30 h. Mothers in households where both biological parents cohabit are more likely to be working in comparison to the other two family types examined. A similar pattern is observed for families formed by the natural mother and her partner. Single mothers are more likely to be either non-working or working less than 20 h per week. Based on our data inspection, we define an alternative variable based on maternal labor supply intensity. We use a categorical variable that captures whether the mother's working hours per week are: (1) zero (the reference category); (2) between 1 and 15; (3) between 16 and 29; (3) between 30 and 40; (5) more than 40.Footnote 8 This variable allows us to test for non-linearities in the effect of maternal labor supply, combining the effect at the extensive and intensive margin. Table 2 shows the summary statistics of these employment variables.
Maternal labor supply – summary statistics

Notes: This table presents three employment variables to capture maternal labor supply. Employment is a dummy for whether in work, hours the number of hours per week worked, and the last categorical variable reflects different bands for hours worked, including when the mother does not work.
4.2.2. Other child, maternal, and family controls
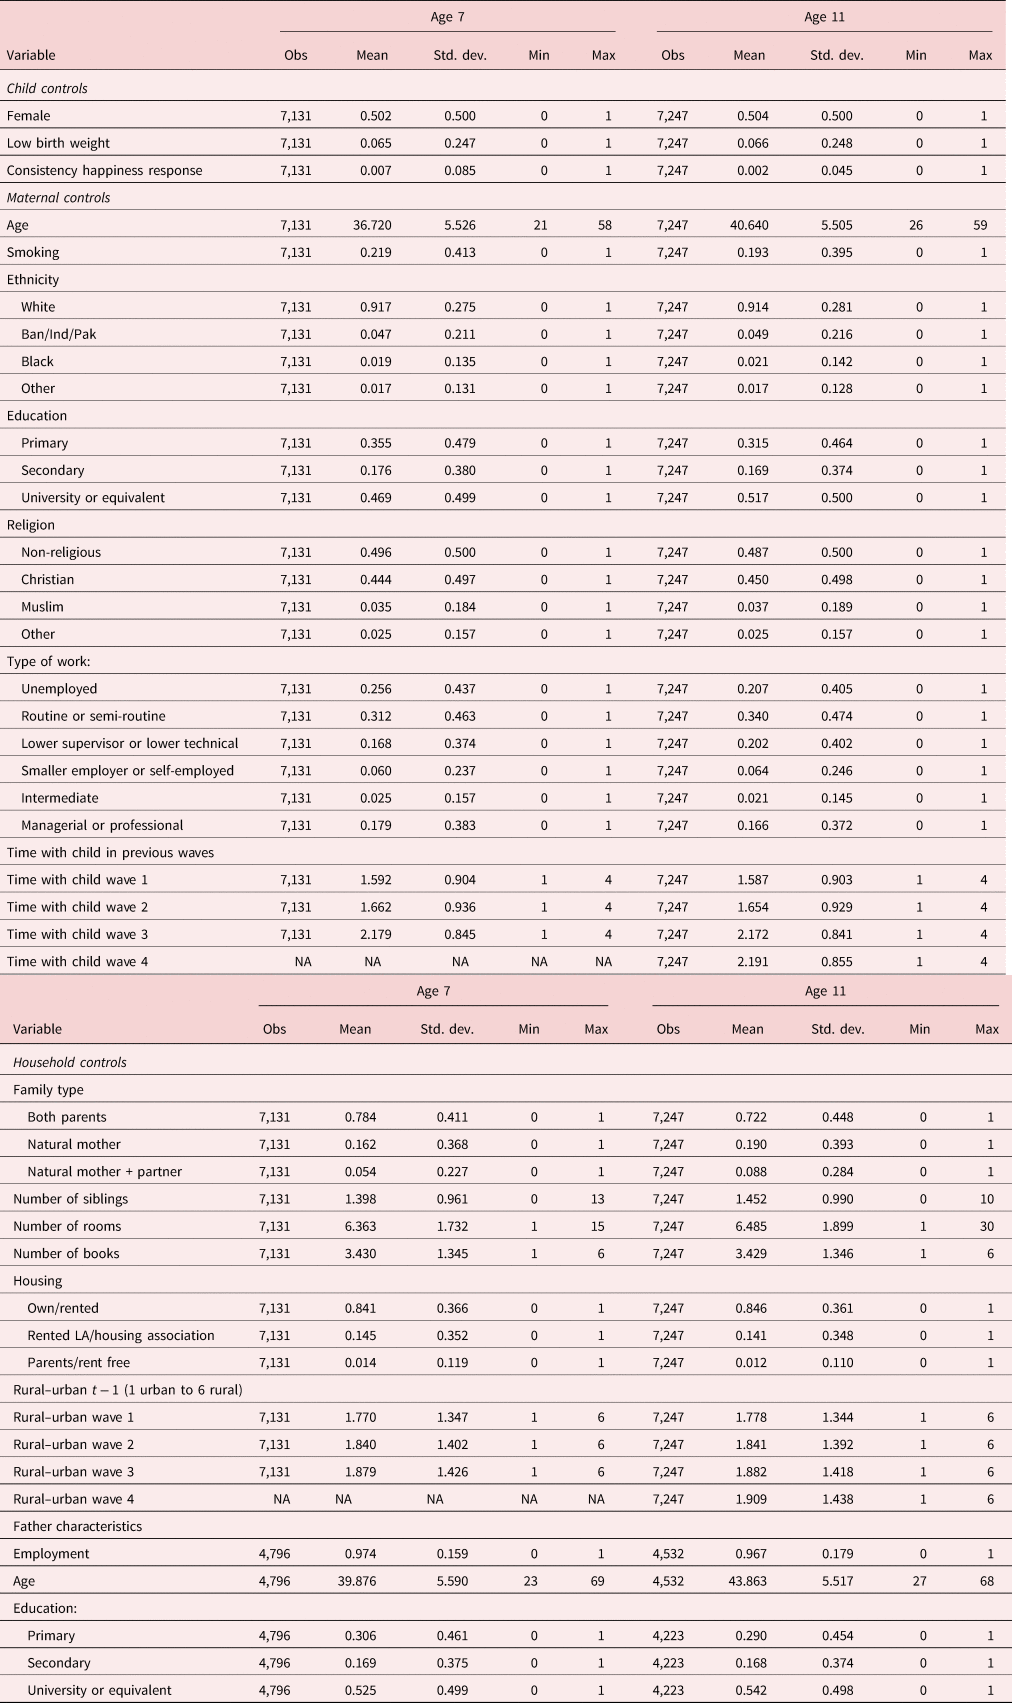
Our specifications also include the following array of covariates. We control for the child's gender and an indicator variable that takes value 1 when the child was born with a low birth weight (2.5 kg or below). In all our model specifications, we account for the consistency of happiness responses and include a dummy equal to 1 when the respondent shows inconsistency in their answers.Footnote 9 This variable serves as a proxy for a comprehensive understanding of the question at hand.Footnote 10 We include as a control the level of maternal education, using a set of dummies indicating her highest educational achievement. Parents’ education may be related to children's developmental achievements insofar as parents’ beliefs and behaviors may be affected by their education level (Davis-Kean, Reference Davis-Kean2005; Powdthavee Vernoit, Reference Powdthavee and Vernoit2013; Ruhm, Reference Ruhm2008). We also include the mother's age, a dichotomous variable on whether the natural mother smokes as an indicator of lifestyle, ethnicity, and information on religious beliefs.Footnote 11
We also control for a set of variables reflecting the distribution of time between work and family. First, we add the mother's current job category to account for job flexibility. It has been suggested that self-employed workers have greater autonomy at work, which translates into greater job involvement and job satisfaction. However, they also experience higher levels of work–family conflict and lower family satisfaction than the employed (Parasuraman Simmers, Reference Parasuraman and Simmers2001). Second, we also include the mother's own perception of the time spent with the child prior to waves 4 and 5.Footnote 12 This variable may influence the decision on working hours, and it could potentially bias the estimated coefficient, hence we use the answers in previous waves (Ruhm, Reference Ruhm2004, Reference Ruhm2008; Powdthavee Vernoit, Reference Powdthavee and Vernoit2013).
Our specifications account for other family characteristics that could affect child-rearing, such as family structure (both natural parents cohabit; the natural mother's partner is not the child's natural father; and, the natural mother has no partner); the number of siblings living in the household; the number of books in the household; the number of rooms in the household; and tenure status of the dwelling. Additionally, we incorporate controls for the geographical location of the household by employing a categorical variable that denotes residence in an urban or rural area. The geographical location of the household can potentially impact maternal labor force participation. Consistent with our overarching approach of not including variables directly associated with the decision to engage in employment, we include these urban/rural indicators with a lag.
Previous research has suggested that family income has a negligible effect on child development in comparison to family background and other characteristics (Blau, Reference Blau1999; Shea, Reference Shea2000; Aughinbaugh Gittleman, Reference Aughinbaugh and Gittleman2003; Violato et al., Reference Violato, Petrou, Gray and Redshaw2011). In addition, income may confound the effect of the labor supply decision, and hence we do not include it in the benchmark specifications. However, we investigate the robustness of the base-case results for the bottom and top quartiles of the household income distribution.Footnote 13 Additional robustness checks are reported running sub-sample analysis using households where both natural parents cohabitate. In these specifications, we add the father's characteristics including his employment status, level of education, and age. Descriptive statistics for all control variables discussed here are listed in Table A1 in the Appendix.
5. Results
5.1. Identifying the impact of maternal work on children's subjective well-being
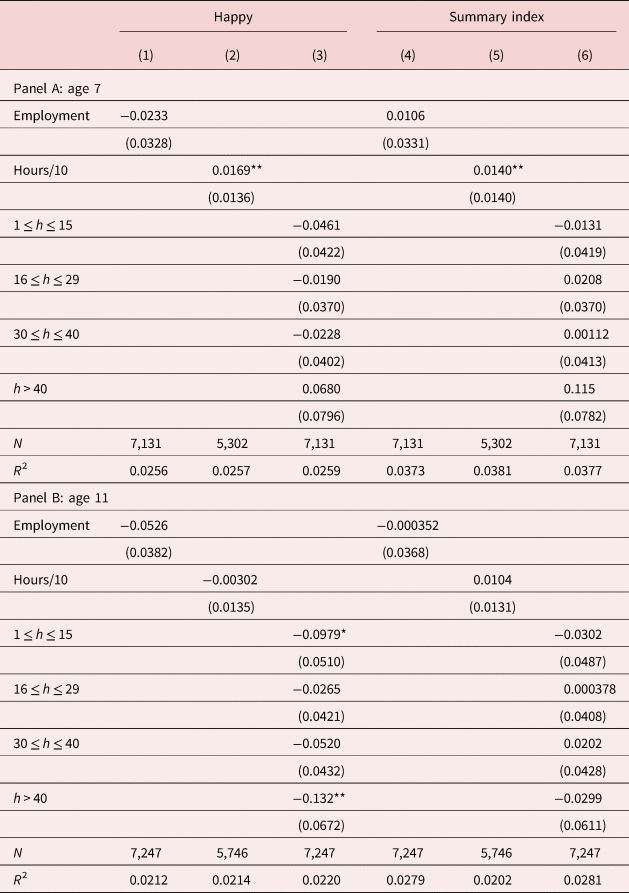
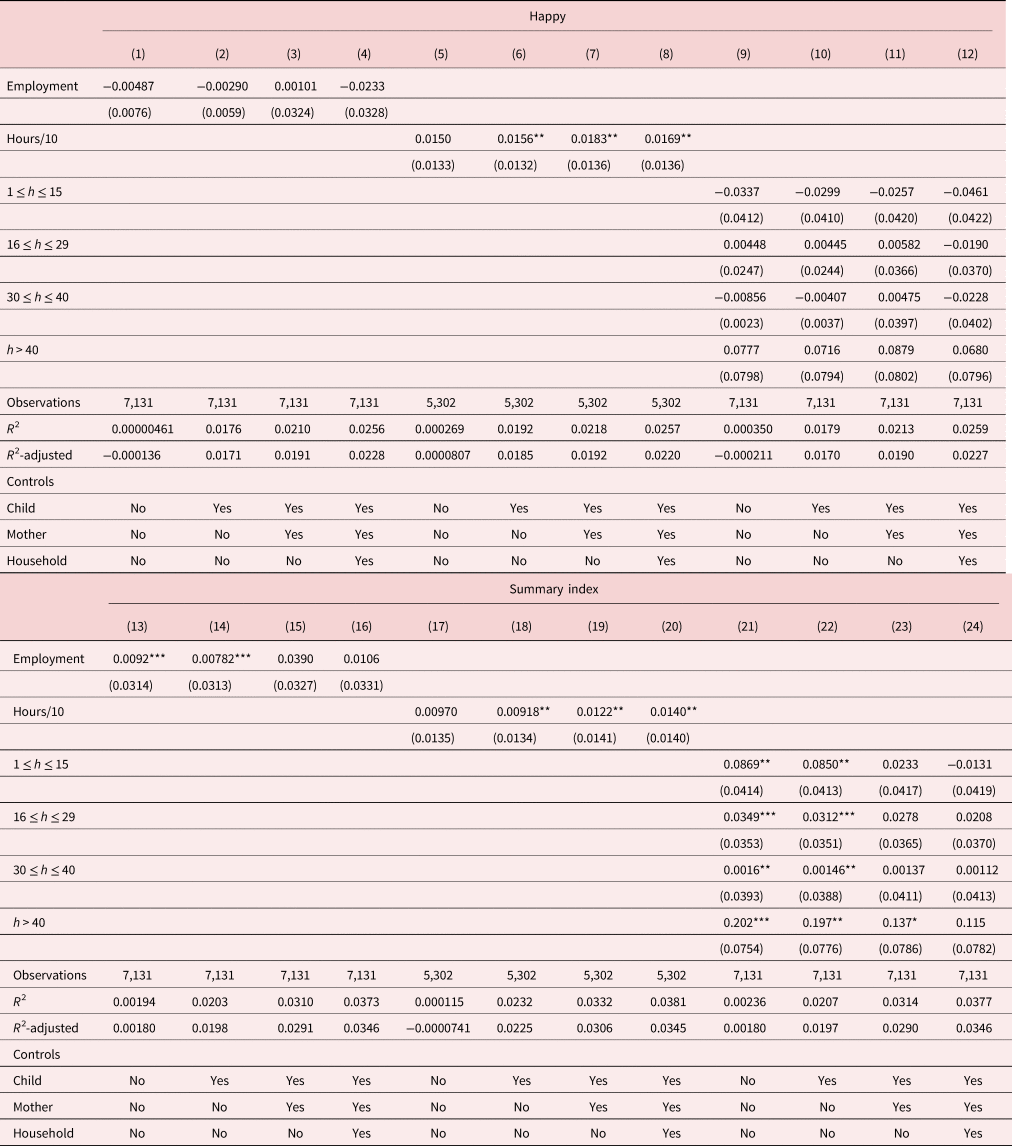
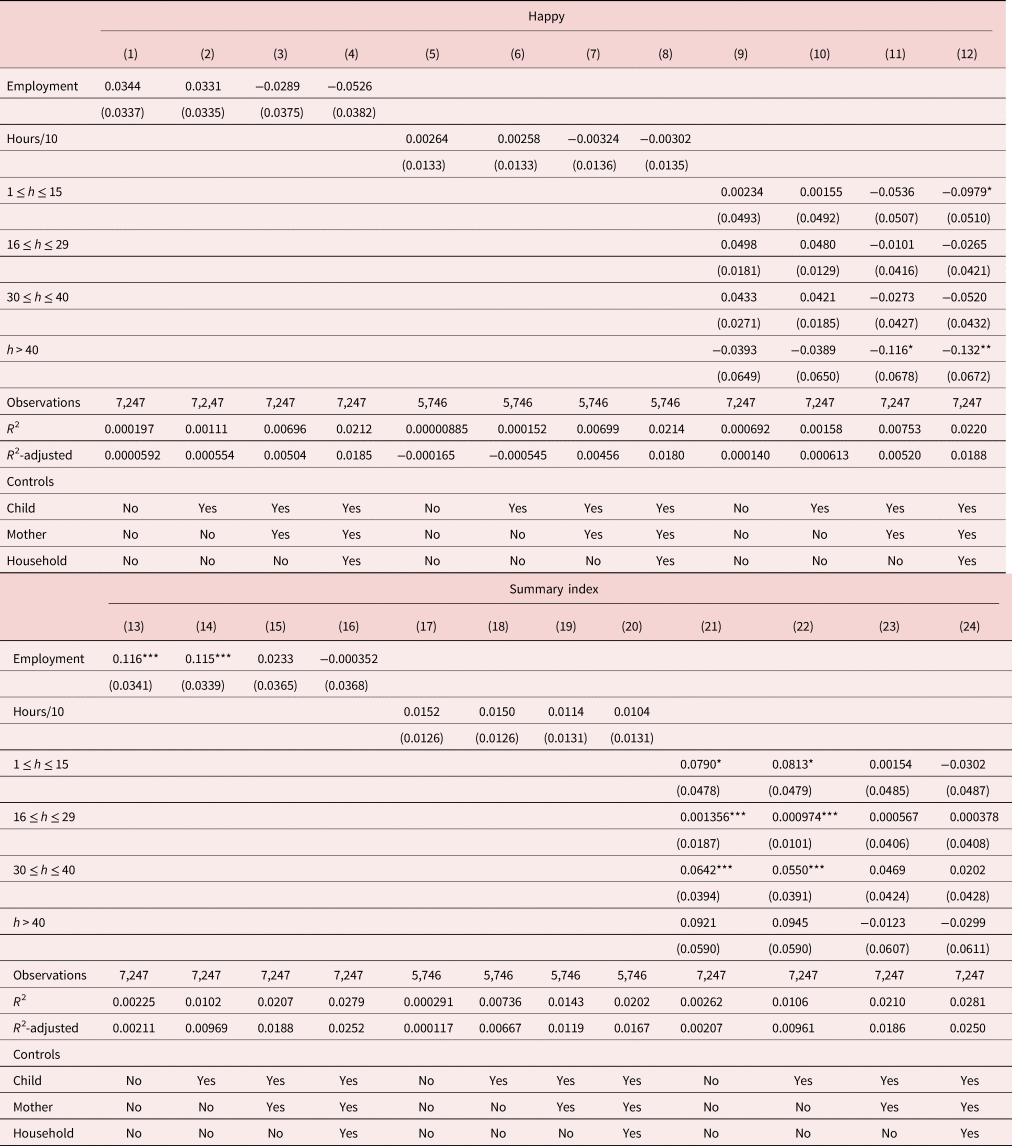
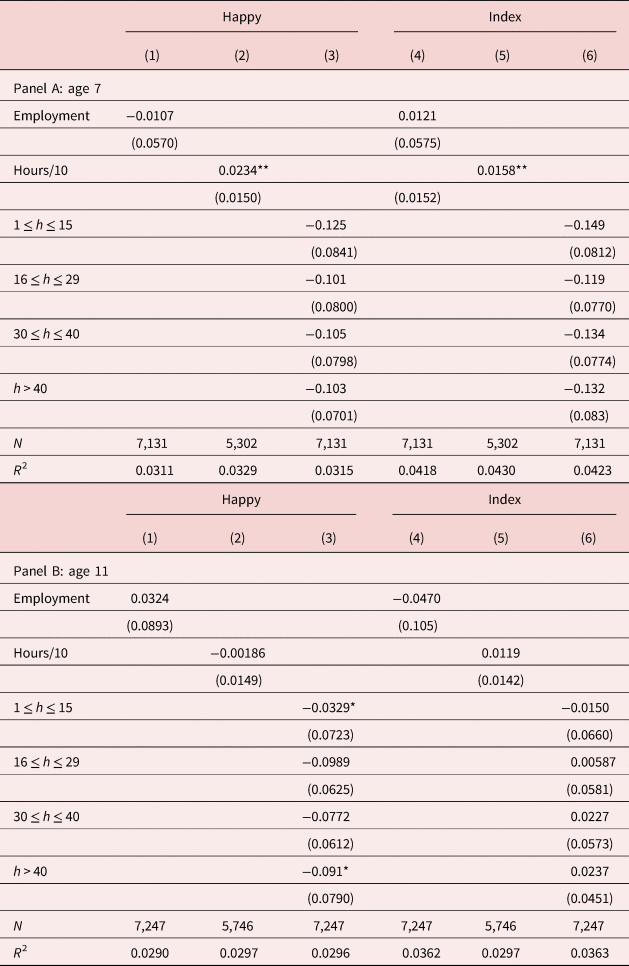
Table 3 presents the results of our base-case model for the association between a mother's labor participation and a child's well-being. The table presents the results for the happiness question and the summary index, using the three variables on maternal labor supply discussed above. Panel A shows the results at the age of 7 and panel B presents the results at the age of 11. All specifications in Table 3 were obtained controlling for child, maternal, and household characteristics. Tables A2 and A3 in the Appendix report the results when we follow a step-wise approach adding child, maternal, and household controls.
Base-case results

Notes: Weighted OLS regressions on child happiness in columns (1)–(3) and summary index for well-being in columns (4)–(6). All specifications control for the child's characteristics (cohort sex, low birth weight, and consistency in happiness response), maternal controls (age, smoking status, race and level of education) and household controls (number of siblings living in the household, number of rooms, housing tenure, family structure). The reference category for the categorical variable on hours worked is 0 h. Standard errors in parenthesis and clustered at the child level.
Significance levels: * p < 0.10, ** p < 0.05, *** p < 0.01.
The findings in Table 3 indicate that maternal employment is not associated with the child's happiness or the summary index of well-being at the age of 7. However, there is a positive and statistically significant association between weekly hours worked and both emotional well-being measures. When using the categorical variable on hours worked, there is no significant association between the various categories of working hours (reference category is zero hours) and happiness or the summary index. Panel B of Table 3 presents the estimated coefficients when the child is aged 11. There is no association between maternal labor supply at the extensive or intensive margin.Footnote 14 However, the coefficients for the hours-worked dummies indicate a negative and statistically significant association between maternal working hours and a child's happiness when the mother works fewer than 16 h or more than 40 h.
In Table 3, we control for all set of variables related to child, mother, and household characteristics. In Tables A2 and A3 in the Appendix, we include the results for the specifications with a step-wise inclusion of control variables. We observe that the addition of a set of control variables modifies the coefficients for maternal labor supply variables, which suggests a correction for omitted variable bias by including additional covariates. The rise in the adjusted R 2 indicates that the extended model yields a more reliable explanation of the variability in child well-being, improving the model's overall fitting.
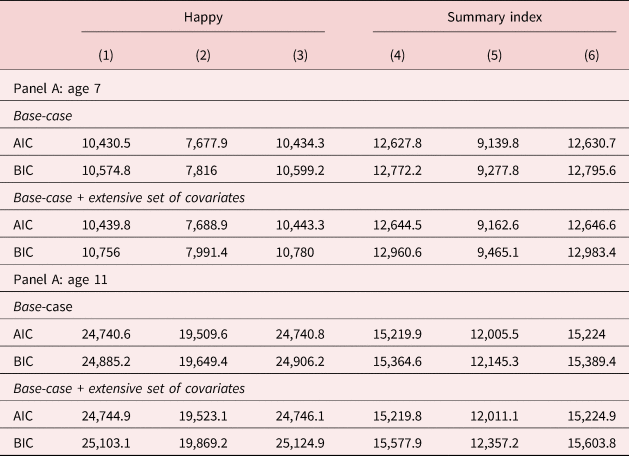
We examine the stability of the results by introducing a broader range of control variables. The additional controls include the rural/urban indicator, the mother's religion, and her subjective perception of the time spent with her child in previous waves.Footnote 15 The results in Table A4 are in line with those in Table 3 but have a worse fit in terms of the Akaike information criterion (AIC) and Bayesian information criterion (BIC) as displayed in Table A5. Therefore, as base-case, we select the shorter selection of covariates for parsimony.
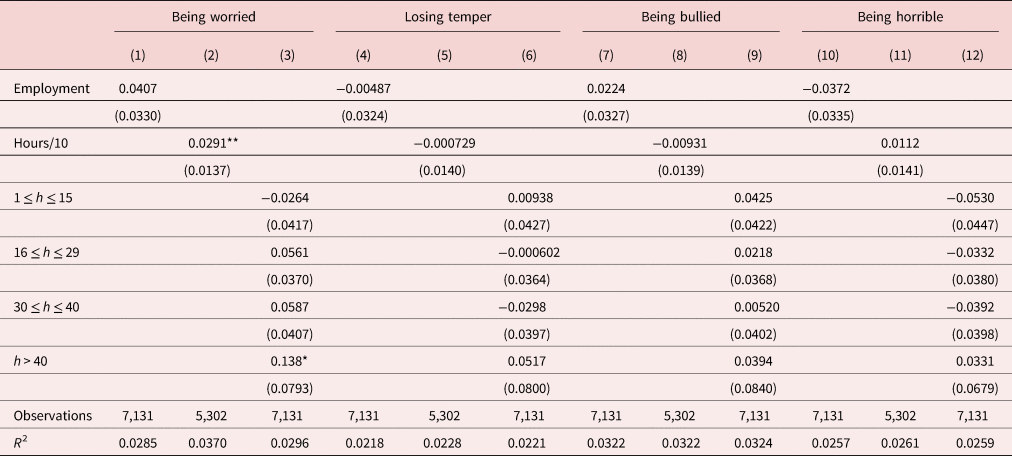
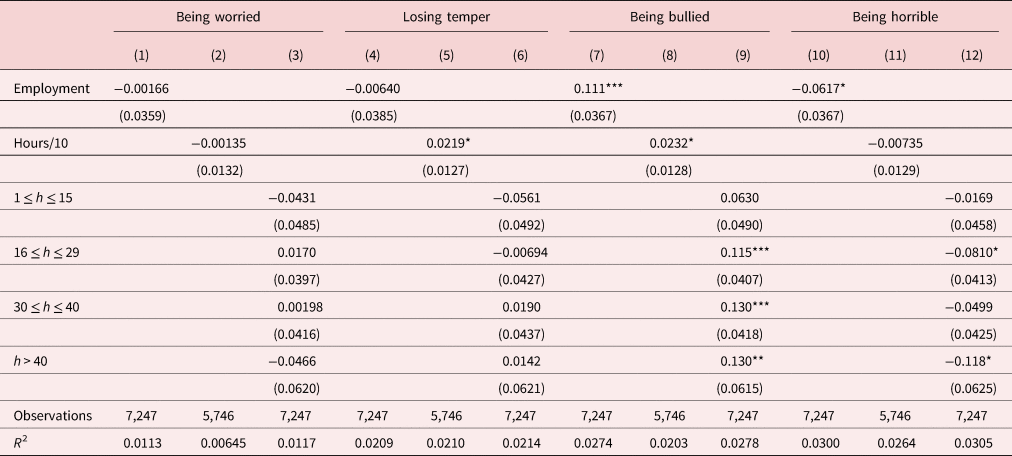
The results for the well-being summary index in Table 3 capture the joint contribution of four individual well-being measures, i.e., being worried, losing temper, being bullied, and being horrible. Next, we explore separately the association of maternal hours with each of the four well-being measures included in the summary index. The results are available in Tables A6 and A7 in the Appendix. As shown in Table A6, at age 7 the only statistically significant coefficient relates to the number of hours worked and for the category of hours for mothers that work more than 40 h per week. In both cases, there is a positive association between hours and an increased probability of feeling worried. Results in Table A7, when the child is 11 show maternal employment, increases the probability of being bullied but decreases the probability of being horrible to others. The number of hours worked has a significant positive association with losing temper and being bullied. As opposed to the base-case results, the distribution in hours worked reveals a clear pattern in that higher hours worked is linked to an increased probability of being bullied and a decreased probability of being horrible to others.
5.2. Test of coefficient stability
There may exist unobserved factors affecting a child's well-being not captured in our set of control variables, e.g., parental communication style with the child, which is a crucial aspect of family functioning that can impact various psychosocial outcomes (Zapf et al., Reference Zapf, Boettcher and Haukeland2023), or the quality of after-school childcare services. In this section, we assess the role of unobserved heterogeneity on our regression estimates for maternal employment following the testing procedure suggested by Oster (Reference Oster2019), which links the stability of the coefficients to changes in the observed R 2 under the assumption that the relationship between the variable of interest and the unobservables can be recovered from the relationship between the main variable and the observable. Oster (Reference Oster2019) shows that the bias-adjusted coefficient of the main variable of interest (β) is:

where $\tilde {\beta }$ is the estimated coefficient and $\tilde {R}$
 is the R 2 of the regression with controls; and $\mathring {\beta }$
 and $\mathring {R}$
 are obtained by running the regression without them. We assume that the selection on observables is proportional to the selection on unobservables so that δ = 1. We follow Oster (Reference Oster2019) to parameterize $R_{\max } = \min [ 1.3\tilde {R},\; \, 1]$
 . The bounding set for each of the specifications presented is $[ \tilde {\beta },\; \, \beta ^{\ast }]$
 , which indicates the interval where the true value of the maternal employment coefficient lies.
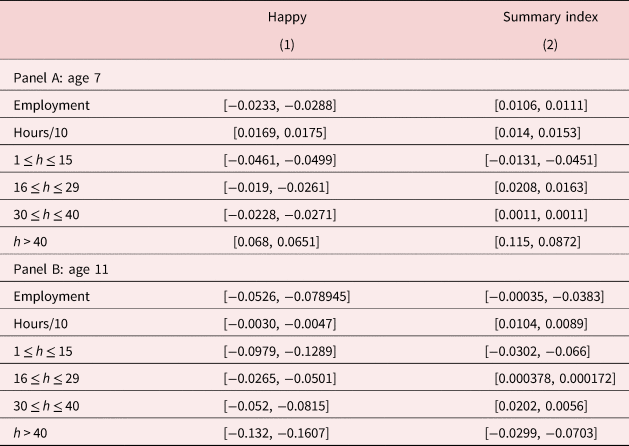
Results of the uncontrolled regressions (including only the employment variables and no controls) are presented in Tables A2 and A3 in the Appendix. Table 4 shows the bounding set for all specifications considered at the ages of 7 and 11 for the happiness and summary index variables. None of the bounding sets include zero, indicating that the presence of unobservables would not change the direction of the effect of maternal employment on the well-being indicators. Overall, the estimated coefficient $\tilde {\beta }$ is slightly higher than the biased-adjusted β*, suggesting that the presence of unobservables leads to marginally under-estimating the effect of maternal employment on well-being.
Oster identification test

Notes: This table shows the bounding set $[ \tilde {\beta },\; \, \beta ^{\ast }]$ , where $\tilde {\beta }$
 is the estimated coefficient when we include all controls and β* is the bias-adjusted coefficient for maternal employment. The controlled regression includes the following covariates: child's characteristics (cohort sex, low birth weight, and consistency on happiness response), maternal controls (age, smoking status, race, and level of education) and household controls (number of siblings living in the household, number of rooms, housing tenure, family structure).
5.3. Extensions
5.3.1. Factor analysis indices happiness based on responses from children, parents, and teachers
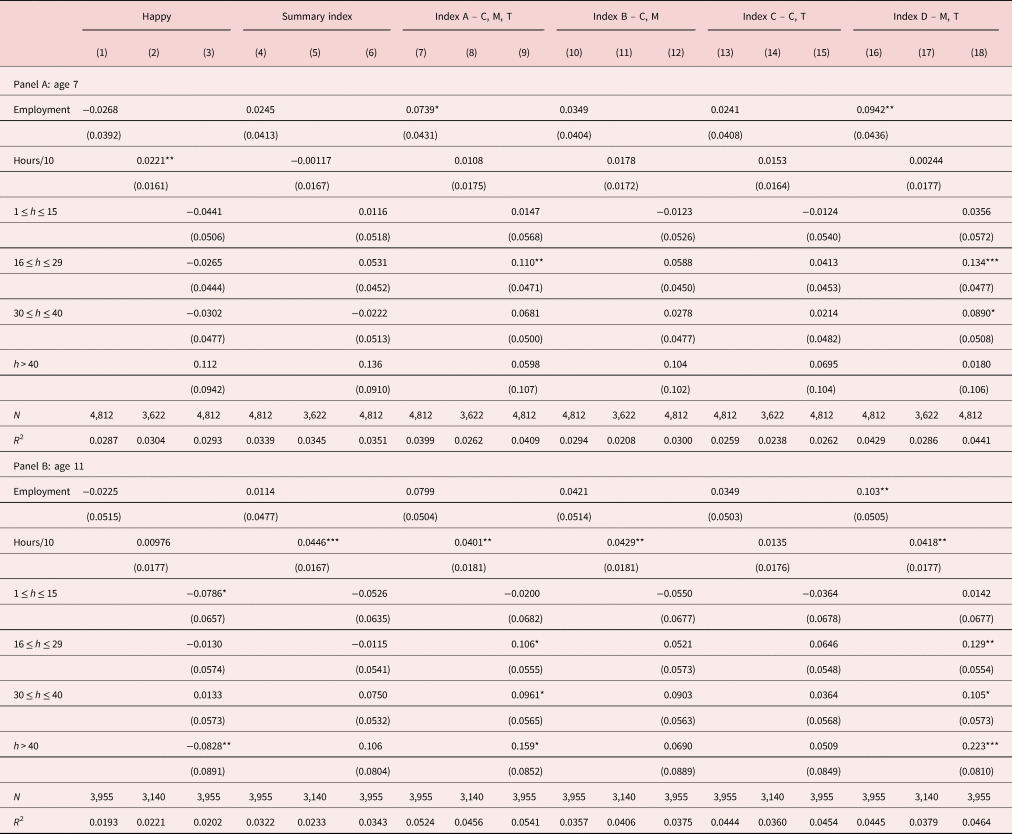
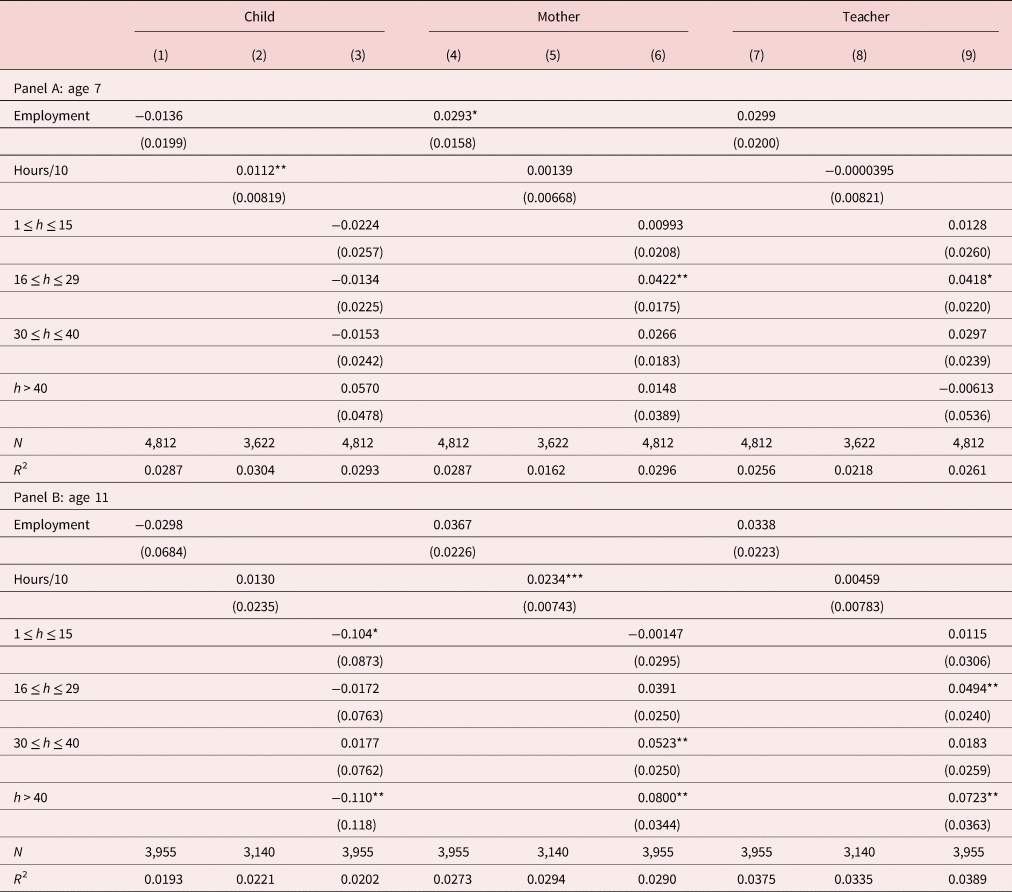
The base-case results use the child's response to the question on happiness. We next exploit the information available in the responses from mothers and teachers regarding children's happiness and create several indices using factor analysis, as discussed in section 4. Table 5 displays these findings. Index A amalgamates responses from the child, mother, and teacher. Index B combines the responses of the child and the mother, while index C incorporates responses from the child and teacher. Index D encompasses responses from both the mother and teacher. It is important to note that the number of observations in this sample is smaller than those presented in Table 3, as this sample is restricted to instances where responses from all three respondents are available. For comparative purposes, Table 3 also provides the estimates for the regressions on the child's happiness response as well as on the summary index, using the same sample as the one used to analyze the indices of happiness. Table A8 in the Appendix also includes the estimates for the regressions using the happiness questions for the child, mother, and teacher separately, again using the same data sample as in Table 3.Footnote 16
Factor analysis

Notes: Weighted OLS regressions were conducted on various indices related to the child's happiness. These indices were constructed using a factor analysis approach. In columns (7)–(9), index A was constructed by considering the responses of children, mothers, and teachers (C, M, T). In columns (10)–(12), index B was constructed using the responses of children and mothers (C, M). Columns (13)–(15) feature index C, which was constructed using the responses of children and teachers (C, T). Lastly, columns (16)–(18) include index D, which was constructed using the responses of mothers and teachers. In all model specifications, we controlled for several factors, including child characteristics (cohort sex, low birth weight, and consistency in happiness responses), maternal characteristics (age, smoking status, race, and level of education), and household characteristics (number of siblings living in the household, number of rooms, housing tenure, and family structure). The reference category for the categorical variable on hours worked is 0 h. Standard errors are reported in parentheses and were clustered at the child level.
Significance levels are indicated as follows: * p < 0.10, ** p < 0.05, *** p < 0.01.
The point estimate for the employment variable indicates a positive and statistically significant association when using indices A and D at age 7, though only the effect of index D remains significant at age 11. At the intensive margin, all indices suggest a positive link between increased working hours and happiness; however, this association is statistically significance only at age 11. When analyzing the categorical variable for hours worked, a positive and statistically significant relationship emerges between maternal working hours and happiness, with a pronounced and consistent effect across the range of hours worked at age 11. These findings are significant for indices A and D, where the involvement of both parent and teacher in assessing the child's happiness is considered. These results imply that children of employed mothers generally exhibit higher levels of happiness compared to their peers with non-employed mothers. Overall, the results when using these indices suggest there is more evidence of an association between employment and well-being when a combination of respondents is used, mainly mothers and teachers.
We have also analyzed the impact of a mother's labor supply on happiness as assessed by the child, mother, and teacher separately. Results can be found in Table A8 in the Appendix. The mother's assessment of the child's happiness positively correlates with employment both at the extensive margin at age 7 and at the intensive margin at age 11. At the intensive margin, working between 16 and 29 h per week is positively associated with happiness, a consistent finding across the responses from both the mother and teacher. Collectively, these outcomes highlight the significant role of the mother's response in linking labor supply to improved well-being.
5.3.2. Differences on well-being at the lower and upper ends of the income distribution
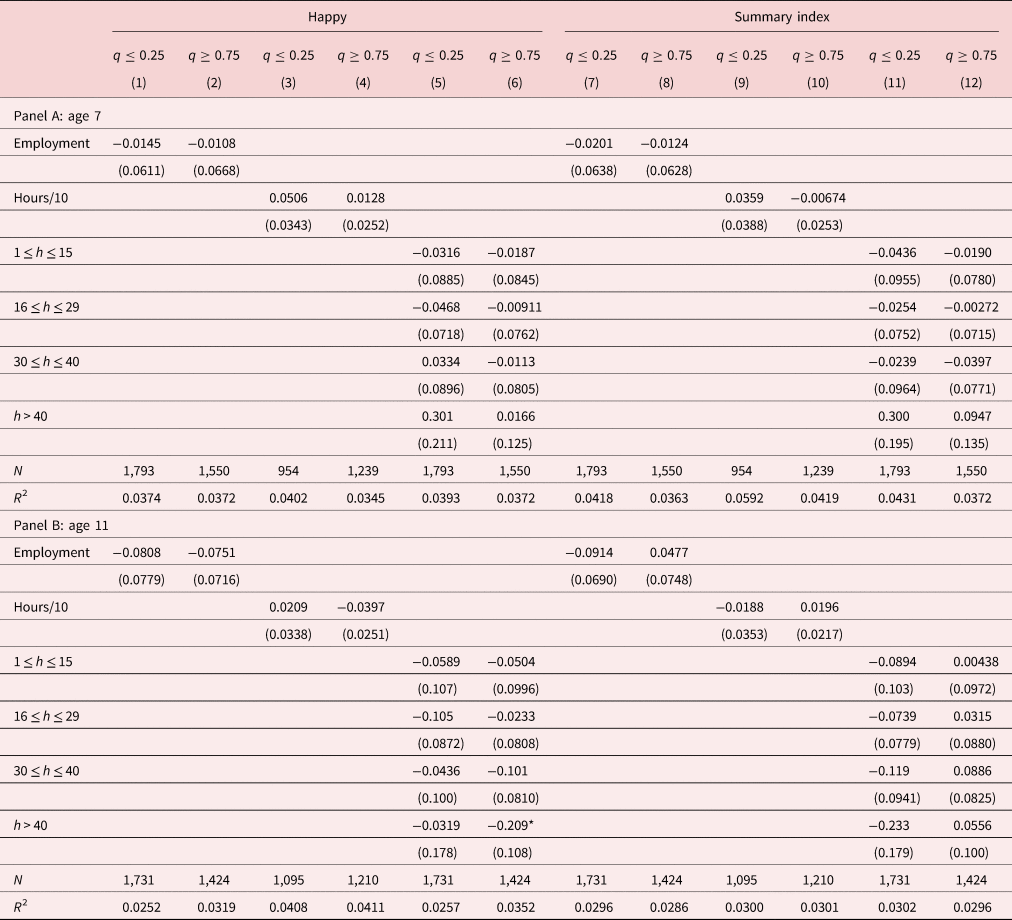
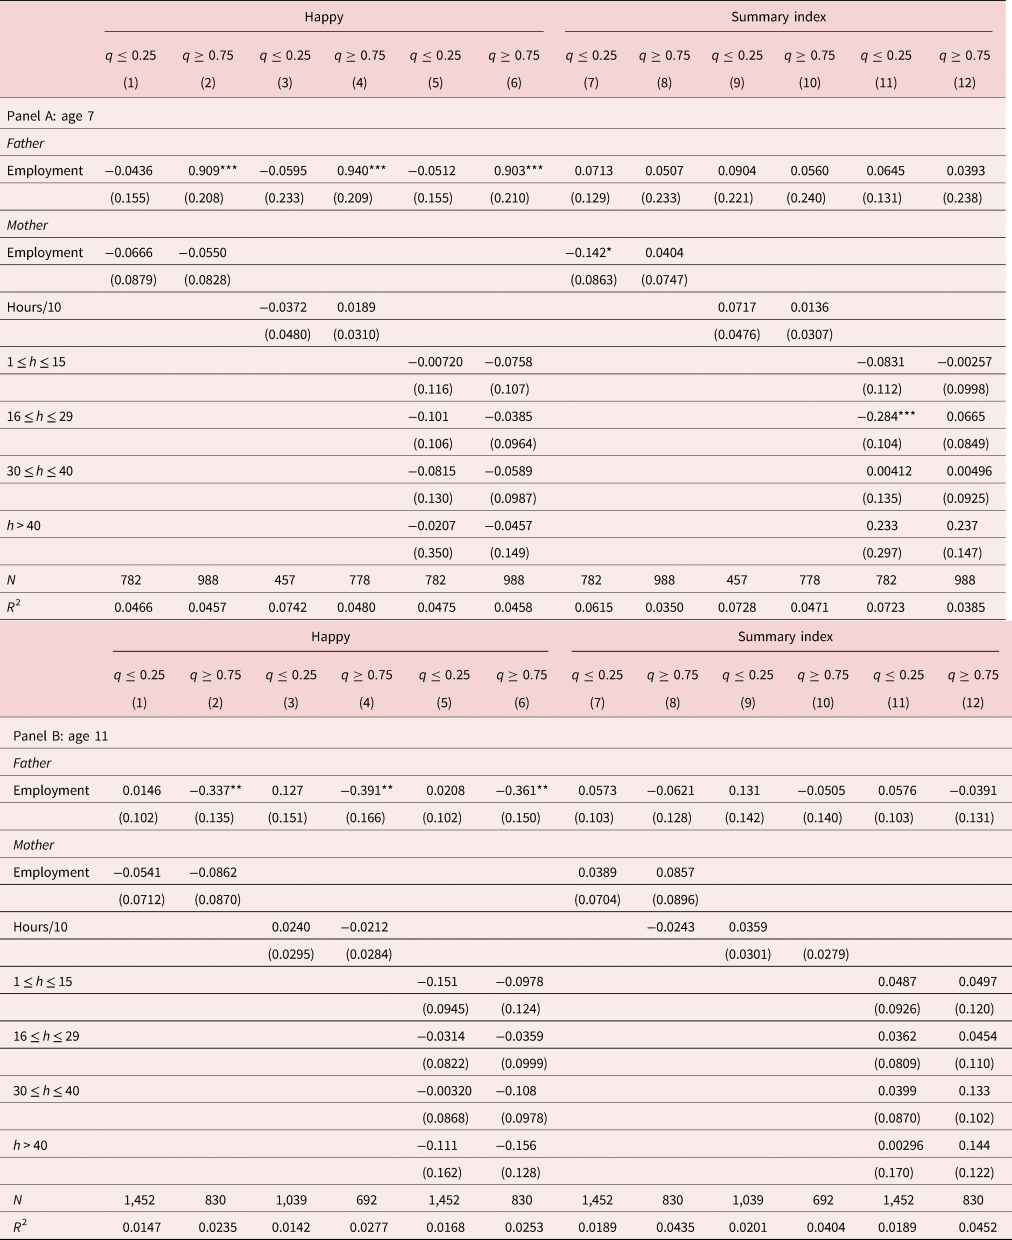
Results in Table 3 omit income as an explanatory variable in order to avoid colinearity with maternal labor force participation. In this section, we explore potential heterogeneous effects across the household income distribution. We use the same model specification as in the base-case but focus on two distinct subsamples: those in the lower- and upper quartiles of the income distribution.Footnote 17 Table 6 presents the results. There are no statistically significant coefficients for any of the well-being measures used, whether in the lower or upper-income quartile, regardless of the employment measures used or the child's age. The only exception is the negative and statistically significant effect of the indicator for more than 40 h, which indicates that working more reduces the happiness of children aged 11 at the top of the income distribution.
Results for the lower and upper quartiles of income distribution

Notes: Weighted OLS regressions were conducted on the outcome variable “Happy” in columns (1)–(6), while columns (7)–(12) featured the dependent variable Summary index. This table presents the results for N within the first quartile and the fourth quartiles of the “Income” variable. In all model specifications, we accounted for several factors, including child characteristics (cohort sex, low birth weight, and consistency in happiness responses), maternal characteristics (age, smoking status, race, and level of education), and household characteristics (number of siblings residing in the household, number of rooms, housing tenure, and family structure). The reference category for the categorical variable on hours worked is 0 h. Standard errors in parenthesis and clustered at the child level.
Significance levels: + p < 0.10, ** p < 0.05, *** p < 0.01.
5.3.3. Maternal commuting time and children's well-being
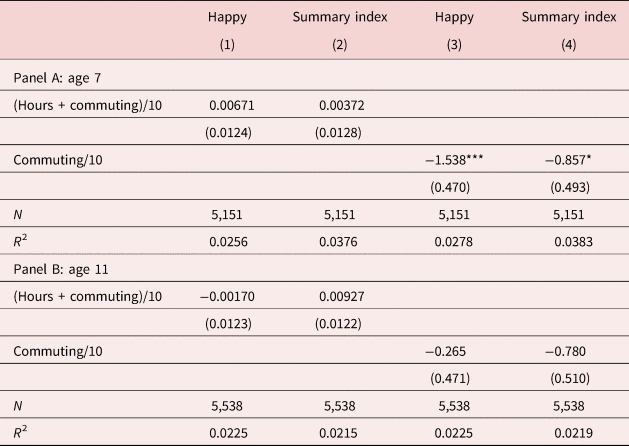
We now investigate whether a mother's commuting time affects the well-being of her children. For this purpose, we generate a variable that accounts for the total time away from home, which includes the number of hours worked and the commuting time, using information that is consistent across both waves. To examine this, we exploit the variable provided in waves 4 and 5 of the MCS on commuting. The question is as follows: “On a typical day, how long does it take you to commute from home to work, one way?”; it has eight different options ranging from working at home to commuting for two or more hours.Footnote 18 The question on commuting time does not specify the weekly frequency of the commute. Thus, we construct total time away from home using the following rule of thumb. We assign 1 day of commuting to mothers working 8 h or less per week; 2 days for those working more than 8 h but less than 17; 3 days for those working more than 16 h but less than 25; 4 days for those working more than 24 h but less than 32; and, 5 days for individuals working more than 32 h. If respondents indicated they were working from home most of the time, we do not add any commuting time. As above, we divide the number of hours away from home by 10.
Results in Table 7 show there is no association between total time away from home and the measures of happiness and the summary index, as shown in columns (1) and (2). This result holds both at ages 7 and 11 and suggests that adding commuting time as a measure of time away from home does not have a detrimental effect on the child. This could be explained by mothers accepting shorter commuting time for lower wages (Le Barbanchon et al., Reference Le Barbanchon, Rathelot and Roulet2021) to minimize time away from home. To better understand of the impact of commuting per se, we also examine the effect of travel time alone. Columns (3) and (4) show the results when excluding hours worked. At age 7, commuting is negatively associated with happiness and the summary index, but there is no effect at the age of 11.
Hours worked and commuting time

Notes: Weighted OLS regressions were conducted on the outcome variable “Happy” in columns (1) and (3), while columns (2) and (4) feature the dependent variable Summary index. In all model specifications, we accounted for several controls, including child characteristics (cohort sex, low birth weight, and consistency in happiness responses), maternal characteristics (age, smoking status, race, and level of education), and household characteristics (number of siblings residing in the household, number of rooms, housing tenure, and family structure). Standard errors in parenthesis and clustered at the child level.
Significance levels: + p < 0.10, ** p < 0.05, *** p < 0.01.
One plausible mechanism through which commuting time may negatively affect child happiness at age 7 is its effect on maternal well-being. This notion is consistent with the concept known as the “commuting paradox,” suggesting that individuals who engage in longer and more strenuous commutes tend to report lower levels of well-being, even though conventional economic theory would suggest that the disutility associated with commuting should be offset by higher wages and better housing opportunities. (Stutzer Frey, Reference Stutzer and Frey2008).Footnote 19 Our findings hint at a potential connection between commuting time and child happiness, and without claiming causality, the “commuting paradox” offers valuable insights into how commuting may adversely affect both maternal and, indirectly, child well-being.
5.3.4. Children living with both parents
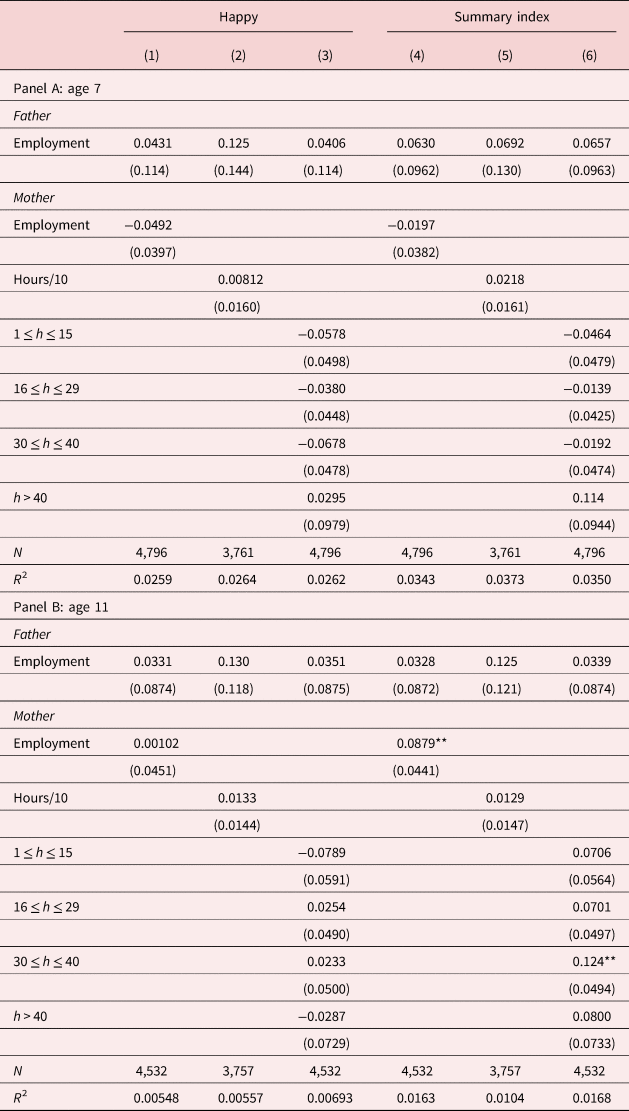
Our original sample included all children regardless of family structure. Previous literature had often been unable to control for father's employment due to missing information on paternal control variables. In studies where the labor supply of the father was accounted for, the effect of increasing maternal supply either remains detrimental or switches to improving the child's development (Phipps et al., Reference Phipps, Lethbridge and Burton2006; Greve, Reference Greve2011; Powdthavee Vernoit, Reference Powdthavee and Vernoit2013). In this section, we examine whether the effects of maternal employment differ when we restrict the sample to those children living in households where both natural parents cohabit. We are able to control for paternal employment (and other controls) using an indicator variable that captures whether he is in work. To address potential biases stemming from the influence of paternal employment on maternal work decisions, we employ whether or not the father works as a proxy (extensive margin) rather than the number of hours worked (intensive margin) in our analysis, recognizing that this adjustment may only partially mitigate biases related to simultaneity in our estimates.
Table 8 presents the results for families where both parents cohabitate. No statistically significant associations are observed at the age of 7. However, by the age of 11, a positive correlation emerges between maternal employment and the summary well-being index, particularly when the mother is employed full-time. Similar to the analysis of the effects across the income distribution presented in Table 6, we also examine the effect of parental employment on well-being for the lower and upper quartiles of the income distribution. Estimates are available in Table A9 in the Appendix. Results show that paternal employment is positively correlated with higher child happiness in the upper-income quartile at the age of 7, yet this association turns negative by the age of 11. In the lower-income quartile, the mother's employment is negatively associated with the summary well-being predominantly when the employment duration is between 16 and 29 h per week; however, this holds only at the age of 7. At age 11, maternal employment is not associated with the child's well-being, irrespective of the family's position within the income distribution.
Sub-sample of families where both parents cohabit

Notes: Weighted OLS regressions on happiness (1)–(3), and in columns (4)–(6) the dependent variable is the Summary index. In all columns, we include the dichotomous variable of parental employment. In all specifications, we control for the child's characteristics (cohort sex, low birth weight, and consistency in happiness response), maternal controls (age, smoking status, race, and level of education), and household controls (number of siblings living in the household, number of rooms, housing tenure, family structure). The specifications also include the father's education and age. The reference category for the categorical variable on hours worked is 0 h. Standard errors in parenthesis and clustered at the child level.
Significance levels: + p < 0.10, ** p < 0.05, *** p < 0.01.
The analysis of the impact of parental employment on child well-being presented in Tables 8 and A9 contrasts with the findings from Tables 3 and 6. At age 7 (11), there is only evidence of a positive (negative) correlation between the father's employment status and child happiness at the upper end of the income distribution. No statistically significant results are found for the summary index. This suggests that accounting for paternal employment mostly dissipates the impact of maternal employment on the child's emotional well-being. These results depart from those in Table 3, which show generally positive associations of maternal employment with child well-being at age 7. Differences are primarily driven by households headed by single mothers or where the mother's partner is not the biological father. Overall, this highlights the importance of considering family structure and parental roles in assessing the long-term impacts of parental employment on child development.
6. Conclusions
This study investigates the association between maternal working hours and the well-being of children aged 7 and 11, utilizing data from the UK MCS. Our primary measures of child well-being consist of the child's self-reported happiness and a summary index that also considers feelings related to worry, temper, bullying, and being horrible to others. Our baseline estimates provide some evidence that maternal employment is associated with child well-being, although the effects differ by age. this association is statistically significant at the intensive margin (hours) but not at the extensive margin (whether she is employed). The number of hours worked is important, and more hours worked is associated with higher happiness and better levels of well-being at the age of 7. However, at age 11 working more hours is negatively associated with a child's happiness only, with no effect on the summary index.
We recognize that omitted variables could be biasing the estimates if our regression models do not include unobserved factors that affect children's well-being and maternal employment. Given the difficulty of finding suitable instrumental variables to address the endogeneity problem, we test for the presence of omitted variable bias in our estimates by exploring the stability of the coefficients in the presence of controls. Following Oster (Reference Oster2019), we present the bias-adjusted coefficients and determine the bounding set within which the true value of the effect lies. The test indicates that the bias introduced by unobserved factors marginally underestimates the estimates and that our base case results are a good approximation of the association between maternal work and child well-being.
In our base-case, the measure of happiness is self-reported by the child. We further exploit responses to the happiness question for the child provided by the mother and teacher and use factor analysis to construct a set of composite indices. First, we construct a composite index that combines the three responses to the happiness question from the child, parent and teacher. Second, we construct three additional composite indices with all pair-wise combinations of responses from the child, mother, and teacher. Notably, our findings reveal statistically significant and positive associations between maternal labor supply and child well-being when we consider the composite index, which incorporates responses from all three parties. Similarly, we observe this positive relationship when examining responses from both mothers and teachers. These results hold at the age of 7 and 11. This suggests a noteworthy connection between mother's and teachers’ combined perceptions of the child's overall happiness.
The initial analysis excludes income as an explanatory variable to avoid its confounding effect on maternal labor supply. To gain a better understanding of differences by income, we next run the same model specifications for the lower and upper quartiles of the income distribution. The coefficients are not precisely estimated for any of the employment variables used, regardless of income quartile and age of the child. The only exception to this is when the mother works more than 40 h, which has a negative impact on happiness for children in the top quartile.
Our analysis also examines the potential relationship between maternal total time away from home when commuting is considered and child well-being, using information on commuting and working hours. We find no effect on the happiness and summary index. However, there exists an indirect negative effect of commuting time alone on the child's happiness. One plausible mechanism is the documented negative impact of commuting on maternal well-being aligned with the “commuting paradox” in the literature, where individuals with longer and more strenuous commutes tend to report lower well-being levels, despite economic expectations of compensation through higher wages and housing opportunities.
Finally, we explore whether child well-being's relationship with maternal employment differs in households with both biological parents cohabiting. While there is a positive association between paternal employment and happiness for children in the top quartile at the age of 7, this effect becomes negative at age 11. There is little evidence that maternal employment is associated with happiness when controlling for father's employment, having a negative impact on the summary index at the age of 7 for children in the bottom quartile and a positive impact on well-being at the age of 11.
Overall, the results show some indication of heterogeneous effects of maternal working hours on happiness and the summary index, mostly for the intensive margin. At age 7 working more hours improves well-being whereas at age 11 working more hours is detrimental for children. No significant differences exist across the income distribution. When using factors analysis to create indices that account for responses on the child's happiness elicited from the child, mother and teacher, maternal employment becomes statistically significant, indicating a positive association at the extensive margin. In sum, our results suggest modest but mostly positive effects of maternal labor supply on children's happiness.
Our study has several limitations. First, there exist challenges related to changes in the phrasing of well-being questions across different waves of the MCS. This variability prevents us from utilizing longitudinal data methods to control for time-fixed effects effectively. Additionally, we are unable to account for macroeconomic conditions that might have influenced the overall labor market. Notably, our initial data collection at age 7 coincided with the onset of the Great Recession, while subsequent data at age 11 was gathered during a period of economic recovery. These economic fluctuations may contribute to the observed differences between waves, potentially partially explaining the diminishing effect of maternal labor supply on child well-being from age 7 to 11, although child development might explain also this variation. Regardless of these challenges, our results provide further evidence of the associations of maternal work with child well-being, using children at a different age group of children and a different dataset than related studies, the MCS, which includes a rich set of measures of child emotional well-being (Powdthavee Vernoit, Reference Powdthavee and Vernoit2013; Mendolia, Reference Mendolia2016).
Data
This study uses retrospective de-identified public-use data collected by Centre for Longitudinal Studies-UCL. No ethical approval is required.
Competing interests
None.
Ethical standards
We declare that this study is original and has not been published before and is not currently being considered for publication elsewhere.
The conclusions of this paper solely mirror the author's analysis and should not be interpreted as representative of NHS England in any manner.
Appendix A:
Summary statistics – ages 7 and 11

Step-wise variable inclusion – age 7

Step-wise variable inclusion – age 11

Results using the extensive set of control variables

Model selection: base-case vs. extensive set of control variables

Individual index components – age 7

Individual index components – age 11

Factor analysis components

Sub-sample of families where both parents cohabit – first and fourth household income