


1 Introduction
The unsteady flow through an aperture separating two fluid domains, either closed (ducts, chambers, resonators) or open, is encountered in a large number of applications. This situation is also of fundamental importance in the design of musical instruments. A fundamental milestone in the study of such problems is the classical Rayleigh (Reference Rayleigh1945) solution of the inviscid, potential flow through a circular hole, in the absence of mean flow. This solution shows that the situation is globally equivalent to the simple assumption of a rigid plug of fluid with an ‘effective length’  $l_{eff}$ oscillating across the aperture. This Rayleigh solution is often invoked in simple models of acoustic devices and is, for instance, a key ingredient in the modelling of the so-called Helmholtz resonator.
In the case where the aperture is traversed by a mean flow, the fluid no longer behaves as an ideal, rigid plug but generally acts as an energy dissipator. This property is used in many industrial applications where one wants to suppress acoustic waves (see for instance the bibliography cited in Fabre et al. (Reference Fabre, Longobardi, Bonnefis and Luchini2019)). This energy dissipation is generally associated with a transfer of energy to the flow through the excitation of vortical structures along the shear layer bounding the jet. Howe (Reference Howe1979) investigated theoretically this situation and introduced a complex quantity called conductivity  $K_{R}$ which generalizes Rayleigh’s ‘effective length’. The knowledge of
 $K_{R}(\unicode[STIX]{x1D714})$ as function of the forcing frequency
 $\unicode[STIX]{x1D714}$, or of the closely related quantity
 $Z(\unicode[STIX]{x1D714})=-\text{i}\unicode[STIX]{x1D714}/K_{R}(\unicode[STIX]{x1D714})$ called the impedance, allows us to fully characterize the possible interaction of the flow with acoustic waves. In particular, the real part of the impedance (which is positive for a zero-thickness hole), is directly linked to the energy flux transferred from the waves to the flow. Howe subsequently derived a potential model predicting the conductivity (and impedance) in the case of a hole of zero thickness. Despite its mathematical rigor, Howe’s model starts from very simplified hypotheses regarding the shape and the location of the vortex sheet and its convective velocity. Recently, Fabre et al. (Reference Fabre, Longobardi, Bonnefis and Luchini2019) reviewed Howe’s problem using linearized Navier–Stokes equations in order to take into account the effect of the viscosity and the exact shape of the vortex sheet. They showed that, for
 $Re\gtrsim 1500$, results are quite independent of the Reynolds number but significantly deviate from Howe’s ones, above all for intermediate frequencies. Nevertheless, in both Howe’s model and Fabre et al.’s (Reference Fabre, Longobardi, Bonnefis and Luchini2019) improved solution, the behaviour of the hole remains dissipative (associated with a positive real part of the impedance), in accordance with experimental and numerical investigations.
The case where the thickness of the plate, in which the hole is drilled, is not small compared to its diameter leads to a completely different situation, as the jet flow can now act as a sound generator instead of a sound attenuator. The first observation of this property seems to have been made by Bouasse (Reference Bouasse1929), who reported that jets through thick plates could produce a well-reproducible whistling, with a frequency roughly proportional to the hole thickness. This observation remained unnoticed (as did many other findings of the rich experimental work of Bouasse), but was rediscovered in the 21st century by Jing & Sun (Reference Jing and Sun2000) and Su et al. (Reference Su, Rupp, Garmory and Carrotte2015) who, in an effort to improve the design of perforated plates used as sound dampers, reported that, in some circumstances, these devices could lose their ability to damp acoustic waves and lead to self-sustained whistling. Numerical simulations by Kierkegaard et al. (Reference Kierkegaard, Allam, Efraimsson and Åbom2012) showed that, in the range of parameters where such whistling occurs, the mean flow through the hole is characterized by a recirculation bubble, either trapped within the thickness of the plate, or fully detached. However, the precise role of this recirculation bubble in the sound-production phenomenon remains to be clarified.
The ability of the jet flow to provide acoustic energy is associated with a positive real part of the impedance, so computation or measurement of this quantity offers a convenient way to characterize these phenomena. A number of analytical and semi-empirical models (Jing & Sun Reference Jing and Sun2000; Bellucci et al. Reference Bellucci, Flohr, Paschereit and Magni2004) have been proposed to predict the impedance of such finite-length holes. Confrontation with experiments (Su et al. Reference Su, Rupp, Garmory and Carrotte2015) and numerical simulations (Eldredge, Bodony & Shoeybi Reference Eldredge, Bodony and Shoeybi2007) have revealed the lack of robustness of such models which all contain ad hoc parameters. Yang & Morgans (Reference Yang and Morgans2016) and Yang & Morgans (Reference Yang and Morgans2017) developed a more elaborate semi-analytical model based on the actual shape of the vortex sheet, including the effect of compressibility within the thickness of the hole. However, their approach remains potential and cannot account for the effect of viscosity within the thickness of the shear layer, nor for the dependence of the impedance on the Reynolds number.
Linearized Navier–Stokes equations (LNSE) offer a more satisfying framework to access the impedance of such holes, with a full incorporation of viscous effects. This approach has been carried out in Fabre et al. (Reference Fabre, Longobardi, Bonnefis and Luchini2019) for a zero-thickness hole, leading to notable improvements of Howe’s classical inviscid model. This approach has also been applied to the flow through a finite-thickness hole by Kierkegaard et al. (Reference Kierkegaard, Allam, Efraimsson and Åbom2012) in a range of parameters characterized by self-sustained whistling. However, Kierkegaard et al. (Reference Kierkegaard, Allam, Efraimsson and Åbom2012) considered a compressible, turbulent case in a specific configuration involving an acoustic pipe acting as a resonator. In our case, we wish to characterize the potential of the jet to lead to self-sustained oscillations regardless of the nature of the acoustic environment, and even in the case where there are no acoustic resonators at all. The situation we investigate is thus more generic, but by ruling out the geometry of the upstream and downstream domains and the Mach number parameter, we are able to conduct a full parametric study of the problem, an objective which was not achievable considering the choices of Kierkegaard et al. (Reference Kierkegaard, Allam, Efraimsson and Åbom2012).
The remainder of the paper is organized as follows:
(i) In § 2, after defining the geometry and the parameters of the study, we define the concept of impedance, and explain how, thanks to the use of Nyquist diagrams, this quantity can be used to predict the stability properties of the jet flow. We show that two kinds of instabilities are possible in this context: (i) a conditional instability corresponding to an over-reflexion of acoustic waves in some range of frequencies, leading to an effective instability only if the jet is coupled to a conveniently tuned acoustic resonator, and (ii) a purely hydrodynamic instability which manifests regardless of the existence of an acoustic resonator, and exists even in the case of a strictly incompressible flow.
(ii) In § 3, we present the linearized Navier–Stokes equations and the numerical method. We show how this formalism can be used to solve both a harmonically forced problem for real frequencies
 $\unicode[STIX]{x1D714}$, allowing us to compute the impedances, and a homogeneous eigenvalue problem allowing us to compute the complex frequencies $\unicode[STIX]{x1D714}_{r}+\text{i}\unicode[STIX]{x1D714}_{i}$ allowing us to characterize the purely hydrodynamic instabilities.
(iii) In § 4, we detail the structure of the base flow corresponding to the steady jet as a function of the Reynolds number
$Re$ and aspect ratio $\unicode[STIX]{x1D6FD}$ of the hole. We detail in particular the discharge coefficient characterizing the relationship between the mean pressure drop and mean flux through the hole, and the range of existence and spatial structure of the recirculation region occurring within the thickness of the hole.(iv) In § 5, we present results of the LNSE approach in the harmonically forced case. The computed impedances for selected values of
$Re$ and $\unicode[STIX]{x1D6FD}$ are reported. We document the structure of the linearly forced flows, in particular within the recirculation region. We eventually provide a parametric map allowing us to predict the ranges of existence of both conditional and hydrodynamic instabilities in the $Re-\unicode[STIX]{x1D6FD}$ parameter plane.(v) In § 6, we present results of the LNSE approach in the homogeneous regime. We confirm the existence of the purely hydrodynamic instability, in accordance with the impedance-based predictions. We further detail the structure of the eigenmodes, the adjoint eigenmodes and the adjoint-based structural sensitivity, allowing us to highlight once again the role of the recirculation region on the instability mechanism.
(vi) In § 7, we compare our results with a number of available experimental and numerical works with related geometries.
(vii) Finally, § 8 summarizes the findings and discusses a few perspectives opened by our work.


2 Problem definition
2.1 Geometry, parameters and modelling hypotheses
The geometrical configuration investigated in the present paper is sketched in figure 1. We consider a fluid of viscosity  $\unicode[STIX]{x1D708}$ and density
 $\unicode[STIX]{x1D70C}$ discharging through a circular aperture of radius
 $R_{h}$ in a planar thick plate with thickness
 $L_{h}$. The domains located upstream and downstream of the hole are supposed large compared to the dimensions of the hole, so that the geometry is characterized by a single dimensionless parameter, the aspect ratio
 $\unicode[STIX]{x1D6FD}$ defined as
 $$\begin{eqnarray}\displaystyle \unicode[STIX]{x1D6FD}=\frac{L_{h}}{2R_{h}}. & & \displaystyle\end{eqnarray}$$
The zero-thickness limit case ( $\unicode[STIX]{x1D6FD}=0$) is investigated in detail in Fabre et al. (Reference Fabre, Longobardi, Bonnefis and Luchini2019); in the present paper we consider holes with finite thickness in the range
 $\unicode[STIX]{x1D6FD}\in [0.1-2]$.
Sketch of the flow configuration (not to scale) representing the oscillating flow through a circular hole in a thick plate, with definition of the geometrical parameters, and indication of the global quantities describing the flow.

The pressure difference between the inlet and the outlet domain, namely  $\unicode[STIX]{x0394}P=[P_{in}-P_{out}]$, generates a net flow
 $Q=U_{M}A_{h}$ through the hole, where
 $A_{h}=\unicode[STIX]{x03C0}R_{h}^{2}$ is the area of the hole and
 $U_{M}$ is the mean velocity. This mean flow is characterized by a Reynolds number defined as:
 $$\begin{eqnarray}\displaystyle Re=\frac{2R_{h}U_{M}}{\unicode[STIX]{x1D708}}\equiv \frac{2Q}{\unicode[STIX]{x03C0}R_{h}\unicode[STIX]{x1D708}}. & & \displaystyle\end{eqnarray}$$
As in Fabre et al. (Reference Fabre, Longobardi, Bonnefis and Luchini2019), we will suppose that the Mach number is small, and that the dimensions of the hole are small compared to the acoustic wavelengths (acoustic compactness hypothesis). These hypotheses allow us to assume that the flow is locally incompressible in the region of the hole. An example of matching with an outer acoustic field is presented in appendix A.
2.2 Characterization of the unsteady regime and impedance definition
To characterize the behaviour of the jet in the unsteady regime, we assume that far away from the hole the pressure levels in the upstream and downstream regions tend to uniform values denoted as  $p_{in}(t)$ and
 $p_{out}(t)$. We will further assume that both the pressure drop
 $\unicode[STIX]{x0394}p(t)$ and the flow rate
 $q(t)$ are perturbed by small-amplitude deviations from the mean state characterized by a frequency
 $\unicode[STIX]{x1D714}$ (possibly complex),
 $$\begin{eqnarray}\displaystyle \left(\begin{array}{@{}c@{}}\unicode[STIX]{x0394}p(t)\\ q(t)\end{array}\right)=\left(\begin{array}{@{}c@{}}[P_{in}-P_{out}]\\ Q\end{array}\right)+\unicode[STIX]{x1D716}\left(\begin{array}{@{}c@{}}[p_{in}^{\prime }-p_{out}^{\prime }]\\ q^{\prime }\end{array}\right)\text{e}^{-\text{i}\unicode[STIX]{x1D714}t}+\text{c.c.}, & & \displaystyle\end{eqnarray}$$
where the amplitude  $\unicode[STIX]{x1D716}$ is assumed small. We can now define the hole impedance as
 $$\begin{eqnarray}\displaystyle Z_{h}(\unicode[STIX]{x1D714})=\frac{[p_{in}^{\prime }-p_{out}^{\prime }]}{q^{\prime }}. & & \displaystyle\end{eqnarray}$$
Note that with the present definition the impedance has physical units  $\text{kg}\cdot \text{s}^{-1}~\text{m}^{-4}$. We will also introduce a non-dimensional impedance defined as
 $$\begin{eqnarray}\displaystyle Z=\frac{R_{h}^{2}}{\unicode[STIX]{x1D70C}U_{M}}Z_{h}\equiv Z_{R}+iZ_{I}, & & \displaystyle\end{eqnarray}$$
where the real part  $Z_{R}$ is the dimensionless resistance while its imaginary part
 $Z_{I}$ is the reactance. In the presentation of the results, the frequency will be represented in a non-dimensional way by introducing the Strouhal number
 $\unicode[STIX]{x1D6FA}$ as follows:
 $$\begin{eqnarray}\displaystyle \unicode[STIX]{x1D6FA}=\frac{\unicode[STIX]{x1D714}R_{h}}{U_{M}}. & & \displaystyle\end{eqnarray}$$
2.3 Impedance-based instability criteria
We now explain the links between impedance and instabilities, and show how simple instability criteria can be formulated using Nyquist diagrams (namely representations of  $Z_{r}$ versus
 $Z_{i}$).
(i) First, the sign of the real part of the impedance
$Z_{R}(\unicode[STIX]{x1D714})$ (or resistance) as function of the real frequency $\unicode[STIX]{x1D714}$ is a direct indicator of a possible instability. However, one should insist that the condition $Z_{R}<0$ is a necessary but not sufficient condition for instability. In the context of electrical circuits (Conciauro & Puglisi Reference Conciauro and Puglisi1981), a system with negative resistance is said to be active in the sense that it effectively leads to an instability if connected to a reactive circuit allowing oscillations in the right range of frequencies. In the present context, this situation is referred as conditional instability and requires the presence of a correctly tuned acoustic oscillator (a cavity and/or a pipe) connected upstream (or downstream) of the aperture.The demonstration that
$Z_{R}<0$ is a necessary condition for conditional instability can be explicated in two ways. First, $Z_{R}$ is directly linked to the energy flux transferred from acoustic waves to the jet. The demonstration of this property can be found in Howe (Reference Howe1979), and is also reproduced in Fabre et al. (Reference Fabre, Longobardi, Bonnefis and Luchini2019). Thus, if $Z_{R}>0$ the jet behaves as an energy sink, while if $Z_{R}<0$ it acts as an energy source. Secondly, one can also establish this link by studying the reflection of acoustic waves onto the hole. This argument is carried out in appendix A, where we conduct an asymptotic matching between the locally incompressible solution in the vicinity of the hole and an outer solution of the acoustic problem. The conclusion of this analysis is that, in the limit of small Mach number, an incident acoustic wave coming from the upstream domain is over-reflected if and only if $Z_{R}<0$.A situation leading to conditional instability is illustrated in figure 2(a,b). Panel (a) shows the real and imaginary parts of the impedance in a situation where
$Z_{R}$ is negative in an interval $[\unicode[STIX]{x1D714}_{1},\unicode[STIX]{x1D714}_{2}]$, and $Z_{i}$ does not change sign. When represented in a Nyquist diagram, the criterion can be formulated as follows: the system is conditionally unstable if the Nyquist curves enter the half-plane $Z_{R}<0$.(ii) Second, when considered as an analytical function of the complex frequency
$\unicode[STIX]{x1D714}=\unicode[STIX]{x1D714}_{r}+\text{i}\unicode[STIX]{x1D714}_{i}$, the impedance can be used to formulate a second instability criterion, namely: the system is unstable, regardless of the properties of its environment, if there exists a complex zero of the impedance function such that $\unicode[STIX]{x1D714}_{i}>0$. Indeed, for complex values of $\unicode[STIX]{x1D714}$ the modal dependence reads $\text{e}^{-\text{i}\unicode[STIX]{x1D714}t}=\text{e}^{-\text{i}\unicode[STIX]{x1D714}_{r}t}\text{e}^{\unicode[STIX]{x1D714}_{i}t}$, thus solutions with the form (2.3) are exponentially growing if $\unicode[STIX]{x1D714}_{i}>0$. In the context of electrical circuits, this situation is referred to as absolute instability in opposition to the conditional instability discussed above. Since the term ‘absolute’ has a different meaning in the hydrodynamic stability community (as opposed to convective instabilities, see e.g. Huerre & Monkewitz (Reference Huerre and Monkewitz1990)), we prefer to adopt the term purely hydrodynamic instabilities to describe this case, emphasizing the fact that they can occur in a strictly incompressible framework.Figure 2.Illustration of the Nyquist-based instability criteria. (a,b) Example of situations leading to conditional instability. (c,d) Example of situations leading to hydrodynamic instability. The regions of conditional and hydrodynamic instabilities are represented by yellow and orange areas, respectively. Left: plot of
$Z_{R}$ (solid line) and $Z_{I}$ (dashed line) as a function of the real frequency $\unicode[STIX]{x1D714}$. Right: Nyquist diagrams.Physically, the condition
$Z_{h}(\unicode[STIX]{x1D714})=0$ implies that there exist modal solutions of the linearized problem in which pressure jump $[p_{in}^{\prime }-p_{out}^{\prime }]$ is exactly zero. In other terms, the total pressure jump across the hole is imposed as a constant (i.e. $[p_{in}(t)-p_{out}(t)]=[P_{in}-P_{out}]$) but the flow rate $q(t)$ is allowed to vary. This kind of boundary condition is a bit uncommon for incompressible flow problems. However, one must keep in mind that the incompressible solution is only valid locally in the vicinity of the hole. In appendix A, we conduct an asymptotic matching with an outer acoustic solution and show that, in the limit of small Mach number, the condition $Z_{h}(\unicode[STIX]{x1D714})=0$ with complex $\unicode[STIX]{x1D714}$ and $\unicode[STIX]{x1D714}_{i}>0$ corresponds to a spontaneous self-oscillation of the flow across the hole associated with the radiation of acoustic waves in both the upstream and downstream domains.In practice, the number of complex zeros of the analytically continued impedance
$Z_{h}(\unicode[STIX]{x1D714})$ and their location in the complex plane can be deduced from the representation of $Z_{h}(\unicode[STIX]{x1D714})$ for real values $\unicode[STIX]{x1D714}$ using the classical Nyquist criterion, which states that there exists an unstable zero of the impedance if and only if the Nyquist curve encircles the origin in the anticlockwise direction. A weaker but practically equivalent version of this criterion can be formulated as follows: the system is unstable in a purely hydrodynamic way if the Nyquist curve enters the quarter-plane defined by $Z_{R}<0$; $Z_{I}>0$. We refer the reader to Kopitz & Polifke (Reference Kopitz and Polifke2008) for the theoretical background on the use of Nyquist criteria in acoustic applications. Note that the second ‘weak’ form of the criterion used here is not rigorous as it may happen that the Nyquist contour enters the quarter-plane and leaves it by the same side without encircling the origin, in which case the criterion would erroneously predict instability. We carefully checked that such behaviour does not occur in the computed cases. (A situation leading to purely hydrodynamic instability is illustrated in figure 2(c,d).)In addition to providing an instability criterion, the knowledge of the impedance for real
$\unicode[STIX]{x1D714}$ can also be used to predict an approximation of the complex zeros in the case where $\unicode[STIX]{x1D714}_{i}$ is small. For this sake, let us suppose that the Nyquist curve passes close to the origin, and let us denote $\unicode[STIX]{x1D714}_{0}$ the value for which the norm of the complex impedance $|Z(\unicode[STIX]{x1D714})|$ is smallest. The location of this point is illustrated in figure 2(c,d). Searching for the complex zero as $\unicode[STIX]{x1D714}=\unicode[STIX]{x1D714}_{0}+\unicode[STIX]{x1D6FF}\unicode[STIX]{x1D714}$ and working with a Taylor series around $\unicode[STIX]{x1D714}_{0}$ leads to (2.7)hence providing an estimation as follows:$$\begin{eqnarray}\displaystyle Z(\unicode[STIX]{x1D714}_{0})+(\unicode[STIX]{x2202}Z/\unicode[STIX]{x2202}\unicode[STIX]{x1D714})_{\unicode[STIX]{x1D714}_{0}}\unicode[STIX]{x1D6FF}\unicode[STIX]{x1D714}=0, & & \displaystyle\end{eqnarray}$$(2.8)It can be shown that$$\begin{eqnarray}\displaystyle \unicode[STIX]{x1D714}\approx \unicode[STIX]{x1D714}_{0}-\frac{Z(\unicode[STIX]{x1D714}_{0})\overline{(\unicode[STIX]{x2202}Z/\unicode[STIX]{x2202}\unicode[STIX]{x1D714})}_{\unicode[STIX]{x1D714}_{0}}}{|(\unicode[STIX]{x2202}Z/\unicode[STIX]{x2202}\unicode[STIX]{x1D714})_{\unicode[STIX]{x1D714}_{0}}|^{2}}. & & \displaystyle\end{eqnarray}$$$Z(\unicode[STIX]{x1D714}_{0})\overline{(\unicode[STIX]{x2202}Z/\unicode[STIX]{x2202}\unicode[STIX]{x1D714})}_{\unicode[STIX]{x1D714}_{0}}$ is purely imaginary (a simple geometrical interpretation being that the line joining the point $Z(\unicode[STIX]{x1D714}_{0})$ to the origin and the line tangent to the Nyquist curve at $\unicode[STIX]{x1D714}_{0}$ are orthogonal to each other). Hence, the correction appearing in (2.8) directly provides an estimation of the amplification rate $\unicode[STIX]{x1D714}_{i}$.


3 Linearized Navier–Stokes equations and numerical methods
In the previous section, the linearly perturbed flow across a hole was considered from a general point of view, focusing on the impedance and its link with possible instabilities. In the present section, we introduce the LNSE framework, and show how this framework can be used both to compute the impedance through solution of a forced problem and to directly address the instability problem through solution of an autonomous problem.
3.1 Starting equations
The fluid motion is governed by the Navier–Stokes equations,
 $$\begin{eqnarray}\displaystyle \frac{\unicode[STIX]{x2202}}{\unicode[STIX]{x2202}t}\left[\begin{array}{@{}c@{}}\boldsymbol{u}\\ 0\end{array}\right]={\mathcal{N}}{\mathcal{S}}\left(\left[\begin{array}{@{}c@{}}\boldsymbol{u}\\ p\end{array}\right]\right)=\left[\begin{array}{@{}c@{}}-\boldsymbol{u}\boldsymbol{\cdot }\unicode[STIX]{x1D735}\boldsymbol{u}-\unicode[STIX]{x1D735}p+Re^{-1}\unicode[STIX]{x1D6FB}^{2}\boldsymbol{u}\\ \unicode[STIX]{x1D735}\boldsymbol{\cdot }\boldsymbol{u}\end{array}\right], & & \displaystyle\end{eqnarray}$$
where  $\boldsymbol{u}$ and
 $p$ are the velocity and pressure fields.
The linearized Navier–Stokes framework consists of expanding the flow as a steady base flow plus a small-amplitude modal perturbation as follows:
 $$\begin{eqnarray}\displaystyle \left[\begin{array}{@{}c@{}}\boldsymbol{u}\\ p\end{array}\right]=\left[\begin{array}{@{}c@{}}\boldsymbol{u}_{\mathbf{0}}\\ p_{0}\end{array}\right]+\unicode[STIX]{x1D716}\left(\left[\begin{array}{@{}c@{}}\boldsymbol{u}^{\prime }\\ p^{\prime }\end{array}\right]\text{e}^{-\text{i}\unicode[STIX]{x1D714}t}+\text{c.c.}\right), & & \displaystyle\end{eqnarray}$$
where c.c. denotes the complex conjugate.
Structure of the mesh  $\mathbb{M}_{1}$ obtained using complex mapping and mesh adaptation for
 $\unicode[STIX]{x1D6FD}=1$, and nomenclature of the boundaries (see appendix B for details on mesh generation and validation). A zoom of the mesh is reported in the range
 $X\in [-2.5;0.5]R_{h}$ and
 $R\in [0.1;1.8]R_{h}$.

In practice, the base flow  $[\boldsymbol{u}_{\mathbf{0}},p_{0}]$ and perturbation
 $[\boldsymbol{u}^{\prime },p^{\prime }]$ will be computed in a computational domain of finite size with boundaries denoted
 $\unicode[STIX]{x1D6E4}_{in},\unicode[STIX]{x1D6E4}_{out},\unicode[STIX]{x1D6E4}_{wall},\unicode[STIX]{x1D6E4}_{lat},\unicode[STIX]{x1D6E4}_{axis}$ (see figure 3). The matching with the global quantities
 $P_{in},P_{out}$ etc. will be done through the boundary conditions on
 $\unicode[STIX]{x1D6E4}_{in}$ and
 $\unicode[STIX]{x1D6E4}_{out}$. This matching procedure involves a number of caveats, which were discussed at length in Fabre et al. (Reference Fabre, Longobardi, Bonnefis and Luchini2019). We refer to this work for full details, but restrict ourselves in this paragraph to a simple exposition of the procedure.
3.2 Base-flow equations
The base flow is the solution of the steady version of the Navier–Stokes equations,
 $$\begin{eqnarray}\displaystyle {\mathcal{N}}{\mathcal{S}}[\boldsymbol{u}_{\mathbf{0}};p_{0}]=0, & & \displaystyle\end{eqnarray}$$
with the following set of boundary conditions:
 $$\begin{eqnarray}\displaystyle & \displaystyle \int _{\unicode[STIX]{x1D6E4}_{in}}\boldsymbol{u}_{\mathbf{0}}\boldsymbol{\cdot }\boldsymbol{n}\,\text{d}S=Q_{0} & \displaystyle\end{eqnarray}$$
 $$\begin{eqnarray}\displaystyle & \displaystyle p_{0}=P_{in}\quad \text{on}~\unicode[STIX]{x1D6E4}_{in}, & \displaystyle\end{eqnarray}$$
 $$\begin{eqnarray}\displaystyle & \displaystyle p_{0}=P_{out}\quad \text{on}~\unicode[STIX]{x1D6E4}_{out}. & \displaystyle\end{eqnarray}$$
In practice, (3.4) is enforced as a Dirichlet boundary condition by prescribing a constant value of the axial velocity component, i.e.  $u_{0,x}=Q_{0}/(\int _{\unicode[STIX]{x1D6E4}_{in}}\,\text{d}S)$. Noting that the pressure reference can be arbitrarily chosen such that
 $P_{out}=0$ and that the viscous stress is negligible along the outlet plane, (3.6) is enforced as a no-stress condition. This problem is solved iteratively using Newton’s method, exactly as done in Fabre et al. (Reference Fabre, Citro, Sabino, Bonnefis, Sierra, Giannetti and Pigou2018). Eventually, (3.5) is used to extract
 $P_{in}$ as the average value of
 $p_{0}$ along the inlet plane, allowing us to deduce the discharge coefficient
 $\unicode[STIX]{x1D6FC}$ (see § 4).
3.3 Linear equations
The linear perturbation obeys the following equations:
 $$\begin{eqnarray}\displaystyle -\text{i}\unicode[STIX]{x1D714}{\mathcal{B}}[\boldsymbol{u}^{\prime };p^{\prime }]={\mathcal{L}}{\mathcal{N}}{\mathcal{S}}_{0}[\boldsymbol{u}^{\prime };p^{\prime }], & & \displaystyle\end{eqnarray}$$
where  ${\mathcal{L}}{\mathcal{N}}{\mathcal{S}}_{0}$ is the linearized Navier–Stokes operator around the base flow and
 ${\mathcal{B}}$ is a weight operator defined as follows:
 $$\begin{eqnarray}\displaystyle {\mathcal{L}}{\mathcal{N}}{\mathcal{S}}_{0}\left[\begin{array}{@{}c@{}}\boldsymbol{u}^{\prime }\\ p^{\prime }\end{array}\right]=\left[\begin{array}{@{}c@{}}-(\boldsymbol{u}_{0}\boldsymbol{\cdot }\unicode[STIX]{x1D735}\boldsymbol{u}^{\prime }+\boldsymbol{u}^{\prime }\boldsymbol{\cdot }\unicode[STIX]{x1D735}\boldsymbol{u}_{0})-\unicode[STIX]{x1D735}p^{\prime }+Re^{-1}\unicode[STIX]{x1D6FB}^{2}\boldsymbol{u}^{\prime }\\ \unicode[STIX]{x1D735}\boldsymbol{\cdot }\boldsymbol{u}^{\prime }\end{array}\right];\quad {\mathcal{B}}=\left[\begin{array}{@{}cc@{}}1 & 0\\ 0 & 0\end{array}\right].\qquad & & \displaystyle\end{eqnarray}$$
This set of equations is complemented by the following boundary conditions:
 $$\begin{eqnarray}\displaystyle & \displaystyle \int _{\unicode[STIX]{x1D6E4}_{in}}\boldsymbol{u}^{\prime }\boldsymbol{\cdot }\boldsymbol{n}\,\text{d}S=q^{\prime }, & \displaystyle\end{eqnarray}$$
 $$\begin{eqnarray}\displaystyle & \displaystyle p^{\prime }(x,r)=p_{in}^{\prime }\quad \text{on }\unicode[STIX]{x1D6E4}_{in}, & \displaystyle\end{eqnarray}$$
 $$\begin{eqnarray}\displaystyle & \displaystyle p^{\prime }(x,r)=p_{out}^{\prime }\quad \text{on }\unicode[STIX]{x1D6E4}_{out}. & \displaystyle\end{eqnarray}$$
This system governs the evolution of the perturbations and is relevant to both the forced problem and the autonomous problem. The difference is in the possible dependence with respect to the azimuthal coordinate  $\unicode[STIX]{x1D703}$ and in the handling of the boundary conditions:
(i) For the forced problem, the forcing being axisymmetric, the perturbation is expected to respect this symmetry and is thus searched under the form
$[\boldsymbol{u}^{\prime };p^{\prime }]=[u_{r}^{\prime }(r,z),u_{x}^{\prime }(r,z),;p^{\prime }(r,z)]$. Furthermore, a non-zero $q^{\prime }$ is imposed (fixed arbitrarily to $q^{\prime }=1$). Equation (3.9) thus leads to a non-homogeneous Dirichlet boundary condition at the inlet plane treated by imposing a constant axial velocity $u_{x}^{\prime }$. For the same reasons as for the base-flow equations, (3.11) can be replaced by a no-stress boundary condition on $\unicode[STIX]{x1D6E4}_{out}$. The problem can be symbolically written as (3.12)where the definition of$$\begin{eqnarray}\displaystyle [{\mathcal{L}}{\mathcal{N}}{\mathcal{S}}_{0}-\text{i}\unicode[STIX]{x1D714}{\mathcal{B}}][\boldsymbol{u}^{\prime };p^{\prime }]={\mathcal{F}}, & & \displaystyle\end{eqnarray}$$${\mathcal{L}}{\mathcal{N}}{\mathcal{S}}_{0}$ implicitly contains the homogeneous boundary condition at the outlet, and ${\mathcal{F}}$ represents symbolically the non-homogeneous boundary condition at the inlet. This problem is non-singular and readily solved. The pressure $p_{in}^{\prime }$ is subsequently deduced from (3.10) by extracting the mean value of the $p^{\prime }$ component along the inlet boundary $\unicode[STIX]{x1D6E4}_{in}$ of the computational domain, eventually allowing us to compute the impedance.(ii) For the homogeneous problem, on the other hand, there is no a priori reason to assume axisymmetry, hence the perturbation may be assumed to have azimuthal dependence with a wavenumber
$m$, namely $[\boldsymbol{u}^{\prime },p^{\prime }]=[\hat{\boldsymbol{u}},\hat{p}]\text{e}^{\text{i}m\unicode[STIX]{x1D703}}$. For axisymmetric modes ($m=0$), as discussed in § 2 and appendix A, the relevant boundary conditions arising from a matching with an outer acoustic solution are $\hat{p}_{in}=\hat{p}_{out}=0$, which can be practically enforced as no-stress conditions at both the inlet and the outlet. When looking for non-axisymmetric modes ($m\neq 0$), on the other hand, it makes more sense to impose $u_{x}^{\prime }=0$ on the inlet (as there is no net flux $q^{\prime }$ through the hole in such cases) and no stress at the outlet. The problem can be symbolically written in the form (3.13)where the operator$$\begin{eqnarray}\displaystyle [{\mathcal{L}}{\mathcal{N}}{\mathcal{S}}_{0}^{\ast }-\text{i}\unicode[STIX]{x1D714}{\mathcal{B}}][\hat{\boldsymbol{u}};\hat{p}]=0, & & \displaystyle\end{eqnarray}$$${\mathcal{L}}{\mathcal{N}}{\mathcal{S}}_{0}^{\ast }$ implicitly contains the homogeneous conditions at both upstream and downstream boundaries. For $m=0$, the flow rate $\hat{q}$ associated with the eigenmodes through (3.9) is generally non-zero, so the eigenmodes can be rescaled such that $\hat{q}=1$.After discretization of the operators
${\mathcal{L}}{\mathcal{N}}{\mathcal{S}}_{0}^{\ast }$ and ${\mathcal{B}}$ as large matrices, we are led to a generalized eigenvalue problem, which admits a discrete set of complex eigenvalues $\unicode[STIX]{x1D714}=\unicode[STIX]{x1D714}_{r}+\text{i}\unicode[STIX]{x1D714}_{i}$. As usual in stability analysis of open flows, only a small number of these eigenvalues correspond to physically relevant global eigenmodes. The remainder, often referred to as ‘artificial modes’, include both a discretized version of the continuous spectrum and spurious modes induced by the truncation of the domain to a finite size (Lesshafft Reference Lesshafft2018). Appendix B details how to sort ‘physical modes’ from ‘artificial modes’ and details the effect of the complex mapping technique used here on the latter set of modes.


Aside from the determinations of the (direct) eigenmodes  $[\hat{\boldsymbol{u}},\hat{p}]$, it is also useful to study the structure of the adjoint eigenmodes
 $[\hat{\boldsymbol{u}}^{\dagger },\hat{p}^{\dagger }]$, namely the eigenmodes of the adjoint operator
 ${\mathcal{L}}{\mathcal{N}}{\mathcal{S}}_{0}^{\ast \dagger }$. We refer to Luchini & Bottaro (Reference Luchini and Bottaro2014) for a detailed discussion of the topic. In the present paper we adopt a discrete adjoint approach.
The structural sensitivity (Giannetti & Luchini Reference Giannetti and Luchini2007) of a hydrodynamic oscillator is also used in the present manuscript to identify the flow region where the mechanism of instability acts. In particular, we follow Giannetti & Luchini (Reference Giannetti and Luchini2007) to build a spatial sensitivity map by computing the spectral norm of the sensitivity tensor:
 $$\begin{eqnarray}\displaystyle \unicode[STIX]{x1D64E}(x,r)=\frac{\hat{\boldsymbol{u}}^{\dagger }(x,r)\otimes \hat{\boldsymbol{u}}(x,r)}{\displaystyle \int _{D}\hat{\boldsymbol{u}}^{\dagger }(x,r)\hat{\boldsymbol{u}}(x,r)\,\text{d}D}, & & \displaystyle\end{eqnarray}$$
where  $D$ is the computational domain.
3.4 Numerical method
The results presented here are obtained with the same numerical method as used in Fabre et al. (Reference Fabre, Longobardi, Bonnefis and Luchini2019). The mesh construction and adaptation, computation of the base flow and of the linear problems are implemented using the open-source finite element software FreeFem++. The main originalities of the present implementation are the use of complex mapping in the axial direction to overcome problems associated with the large convective amplification of structures in the downstream direction (see Fabre et al. Reference Fabre, Longobardi, Bonnefis and Luchini2019), and the systematic use of mesh adaptation to substantially reduce the required number of degrees of freedom (following a methodology described in Fabre et al. (Reference Fabre, Citro, Sabino, Bonnefis, Sierra, Giannetti and Pigou2018) and previously used for the zero-thickness hole in Fabre et al. (Reference Fabre, Longobardi, Bonnefis and Luchini2019)). An example of an unstructured grid obtained in this way is displayed in figure 3. Note that the downstream dimension  $L_{out}$ in numerical coordinates seems rather short; however, as the coordinate mapping used in this case involves a stretching, the actual dimension in physical coordinates is much larger.
The loops over parameters and generation of the figures are performed using Octave/Matlab thanks to the generic drivers of the StabFem project (see a presentation of these functionalities in Fabre et al. (Reference Fabre, Citro, Sabino, Bonnefis, Sierra, Giannetti and Pigou2018)). According to the philosophy of this project, all the codes used in the present paper are available from the StabFem website (gitlab.com/stabfem/StabFem), and a simple script reproducing the main results of the present paper is provided (gitlab.com/stabfem/StabFem/STABLE_CASES/WHISTLE/SCRIPT_chi1.m.). On a standard laptop, all the computations discussed below can be obtained in a few hours. Numerical convergence issues are discussed in appendix B by comparing results obtained with four different meshes, with variable domain dimension and grid density (controlled by using several mesh adaptation strategies).
4 Base flow: study of the recirculation region
A typical base flow is depicted in figure 4 for a Reynolds number  $Re=1500$ and
 $\unicode[STIX]{x1D6FD}=1$. The flow is characterized by an upstream radially converging flow turning into an almost parallel jet. However, an important feature is the occurrence of a recirculation region within the thickness of the hole. The vorticity field reaches its maximum near the leading edge, namely the left edge of the hole, and is highly concentrated in the region of maximum shear stress. Figure 5 illustrates the structure of the flow in the close vicinity of the aperture, for
 $\unicode[STIX]{x1D6FD}=1$. The recirculation region at
 $Re=800$ takes the form of a narrow bubble trapped close to the upstream corner. As the Reynolds is increased, this recirculation region expands towards the lower corner, eventually becoming an open recirculation region.
Contour plot of (a) axial velocity of the base flow and (b) vorticity field computed at  $Re=1500$ and
 $\unicode[STIX]{x1D6FD}=1$.

Contour plot of the axial component of the base flow for  $\unicode[STIX]{x1D6FD}=1$ at: (a)
 $Re=800$, (b)
 $Re=1200$, (c)
 $Re=1600$, (d)
 $Re=2000$. The structure of the recirculation region is highlighted using streamlines.

(a) Intensity of the recirculation flow inside the hole and (b) discharge coefficient as functions of  $Re$. Solid line (——):
 $\unicode[STIX]{x1D6FD}=0.3$; dashes (– – –):
 $\unicode[STIX]{x1D6FD}=0.6$; dash-dotted line (— ⋅ —):
 $\unicode[STIX]{x1D6FD}=1$.

The intensity of the recirculation region can be characterized by the maximum level of negative velocity within the thickness of the hole, namely  $U_{max}=max(-u_{x0})$. This quantity is plotted in figure 6(a) as a function of the Reynolds number for
 $\unicode[STIX]{x1D6FD}=0.3,0.6$ and
 $1$. It is observed that, in all cases, the recirculation region shows up for
 $Re\approx 400$. The intensity of the recirculation region first grows as the trapped bubble extends to reach the downstream corner, and then decreases as it turns into a fully open one. Not surprisingly, the intensity is larger in the case of a thicker hole, as the bubble is able to extend over a longer region.
The steady flow is characterized by the so-called discharge coefficient  $\unicode[STIX]{x1D6FC}$, defined as
 $$\begin{eqnarray}\displaystyle \unicode[STIX]{x1D6FC}=\sqrt{\frac{\unicode[STIX]{x1D70C}U_{M}^{2}}{2(P_{in}-P_{out})}}. & & \displaystyle\end{eqnarray}$$
This coefficient can be thought of as a measure of the vena contracta phenomenon: assuming that the jet contracts to a top-hat jet with constant velocity  $U_{J}$ and radius
 $R_{J}$ (see figure 1) and using the Bernoulli law, one classically shows that
 $\unicode[STIX]{x1D6FC}=U_{M}/U_{J}=(\unicode[STIX]{x03C0}R_{J}^{2})/(\unicode[STIX]{x03C0}R_{h}^{2})$, so it can be interpreted as an area contraction ratio of the jet.
We document in figure 6(b) the discharge coefficient  $\unicode[STIX]{x1D6FC}$ deduced from the pressure drop computed from the base flows. It is found that for
 $Re\approx 10^{4}$ the discharge coefficient reaches a value close to 0.61 in all cases. Note that for the thicker case (
 $\unicode[STIX]{x1D6FD}=1$)
 $\unicode[STIX]{x1D6FC}$ is lower than in the other cases for
 $Re\lesssim 100$, meaning that the pressure drop is weaker, but it is maximal for
 $Re\approx 2000$, a value corresponding approximately to the transition from a closed to an open recirculation region.
There exist several estimations of this coefficient. For instance, the hodograph method leads to  $\unicode[STIX]{x1D6FC}\approx 0.61$ (Gilbarg Reference Gilbarg1960) which is consistent with the large-
 $Re$ limit of our computations. Note that Blevins (Reference Blevins1984) reports that, for
 $\unicode[STIX]{x1D6FD}=0.3$, the discharge coefficient decreases from 0.70 to 0.61 as
 $Re$ increases from
 $10^{3}$ to
 $10^{4}$. This is consistent with our findings. The literature generally attributes this decrease of
 $\unicode[STIX]{x1D6FC}$ to the laminar–turbulent transition. Since our base-flow solution is strictly laminar, we can rule out this argument. It seems more relevant to attribute the decrease of
 $\unicode[STIX]{x1D6FC}$ to the transition of the recirculation region from an attached state to a fully detached state.
5 Linear results for the forced problem
We turn now to analysing the results obtained by the numerical solution of the forced problem. We chose two different cases characterized by  $\unicode[STIX]{x1D6FD}=0.3$ and
 $\unicode[STIX]{x1D6FD}=1$.
5.1 Case $\unicode[STIX]{x1D6FD}=0.3$

As previously introduced, the most important quantity associated with the unsteady flow is the impedance  $Z=Z_{R}+iZ_{I}$. This quantity is plotted as function of the frequency in figure 7 for Reynolds numbers ranging from
 $800$ to
 $2000$. The plots in the left column display
 $Z_{R}$ and
 $Z_{I}$ as functions of
 $\unicode[STIX]{x1D6FA}$ (note that as
 $Z_{I}$ is generally negative and decreasing with
 $\unicode[STIX]{x1D6FA}$, it is convenient to plot
 $-Z_{I}/\unicode[STIX]{x1D6FA}$). The right column displays the corresponding Nyquist diagrams.
Impedance of the flow through a circular aperture with aspect ratio  $\unicode[STIX]{x1D6FD}=0.3$. (a,c,e,g) Plot of
 $Z_{R}$ (solid line) and
 $Z_{I}$ (dashed line) as a function of the perturbation frequency
 $\unicode[STIX]{x1D6FA}$; (b,d,f,h) Nyquist diagrams for (a,b),
 $Re=800$, (c,d),
 $Re=1200$, (e,f),
 $Re=1600$, (g,h),
 $Re=2000$. Points (C1), (S1) and (C2) indicate the locations corresponding to the structures shown in figures 8 and 9. Point ‘O’ indicates the starting point (
 $\unicode[STIX]{x1D6FA}=0$) of the Nyquist curves.

For  $Re=800$ (a,b), the system presents a small frequency interval near
 $\unicode[STIX]{x1D6FA}\approx 2.2$ with negative values of the real part of the impedance
 $Z_{R}$. As explained in § 2.3, this property is directly related to a possible instability. On the other hand, the imaginary part
 $Z_{I}$ is always negative in the range of frequencies considered.
As the Reynolds number is increased further, one observes that the region of negative  $Z_{R}$ gets larger and reaches larger values. Note also that the negative, minimum value of
 $Z_{R}$ is associated with a maximum of
 $-Z_{I}/\unicode[STIX]{x1D6FA}$. Increasing the Reynolds number enlarges the range of
 $\unicode[STIX]{x1D714}$ where the system has negative values of
 $Z_{R}$. The cases (e,g) associated with
 $Re=1600,2000$ show a second region of conditional instability for higher frequencies in the range near
 $\unicode[STIX]{x1D6FA}\approx 8.5$. This is again associated with a maximum of
 $-Z_{I}/\unicode[STIX]{x1D6FA}$. Note that for Reynolds numbers up to
 $2000$ we do not find a hydrodynamic instability. We recall that the number of unstable modes (absolute instability) is associated with the number of times the contour of the complex impedance
 $Z_{h}$ encircles the origin. This condition is never satisfied in figure 7.
Structure of the unsteady flow for  $\unicode[STIX]{x1D6FD}=0.3$ and
 $Re=1600$. (a,c,e) Real part of the pressure component; (b,d,f) imaginary part of the pressure component. First row (C1):
 $\unicode[STIX]{x1D6FA}=2.6$ (conditionally unstable case with
 $Z_{r}<0$); second row (S1)
 $\unicode[STIX]{x1D6FA}=5.45$ (stable case with
 $Z_{r}>0$); third row (C2)
 $\unicode[STIX]{x1D6FA}=8.25$ (conditionally unstable case with
 $Z_{r}<0$).

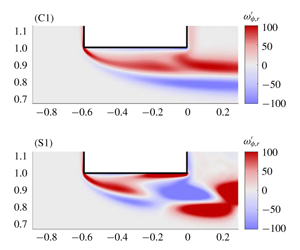
To explain these trends, and in particular the possibility of negative  $Z_{R}$, we now depict in figure 8 the structure of the flow perturbation for three values of the frequency, corresponding to points C1, S1 and C2, as indicated in figure 7(f). The cases C1 and C2 correspond to the two first negative minima of
 $Z_{R}$, hence to conditionally unstable cases, while case S1 corresponds to a positive maximum of
 $Z_{R}(\unicode[STIX]{x1D6FA})$, hence to a maximally stable case. The plot shows the real and imaginary part of the pressure component
 $p^{\prime }$, which correspond respectively to the components in phase with the oscillating flow rate and a quarter period after (at the instant when the oscillating flow reverses). The figure shows that the harmonic forcing generates alternating high and low pressure regions which propagate along the shear layer and are amplified downstream. Note that the plots use a logarithmically stretched colour scale, allowing us to visualize the structure despite the very strong spatial amplification.
Thanks to the normalization of the oscillating flow by  $q^{\prime }=1$ and the pressure reference taken as
 $p_{out}^{\prime }=0$, the impedance
 $Z=[p_{in}^{\prime }-p_{out}^{\prime }]/q^{\prime }$ can be directly read on the figures from the uniform value of the pressure in the upstream domain. Accordingly, for the conditionally unstable cases, C1 and C2, one can see that the real part of
 $p_{in}^{\prime }$ is negative, while for the stable case (
 $c$) it is positive. On the other hand, the imaginary part of
 $p_{in}^{\prime }$ is negative in the three cases (see the plots in the right column of the figure), consistently with the fact that
 $Z_{I}$ is always negative for
 $\unicode[STIX]{x1D6FD}=0.3$.
Left: vorticity component  $\unicode[STIX]{x1D714}_{r}^{\prime }$ (real part) of the perturbation. Right: reconstruction of the structure of the perturbed shear layer (
 $\text{base flow}+\text{perturbation}$) at the instant corresponding to maximum flow rate through the hole for
 $\unicode[STIX]{x1D6FD}=0.3$ and
 $Re=1600$. Cases (C1), (S1), (C2) as in figure 8.

Figure 9 complements the description of the structure of the perturbation for the same three values of the frequency, by analysing the dynamics of the shear layer. For this we focus on the real part of the vorticity component  $\unicode[STIX]{x1D714}_{r}^{\prime }$ corresponding to the instant of the cycle where the flow rate through the hole is maximum. For case (C1) (first row), at this instant the vorticity perturbation consists of two layers of vorticity of opposite sign, with positive sign in the region closest to the hole. When superposing this perturbation onto the base flow, which consists of a shear layer of positive vorticity (see e.g. the lower half of figure 4), the result is to shift the shear layer towards the walls, as schematically represented in the plot on the right. The section of the jet is thus locally enlarged in the outlet section, hence the velocity is reduced, and according to the Bernoulli law the pressure
 $p_{s}^{\prime }$ at the outlet section (which may be identified with the real part of
 $p_{out}^{\prime }$) at this location is increased. This simple argument allows us to explain why the fluctuating pressure jump at the considered instant of the cycle
 $\text{Re}[p_{in}^{\prime }-p_{out}^{\prime }]$ is negative.
For the case C2 with  $\unicode[STIX]{x1D6FA}=8.25$ (third row), the structure of the vorticity perturbation is more complex and changes sign twice between the upstream and downstream sides of the holes. Superposing this onto a base flow leads to a situation where the shear layer is first displaced towards the wall, then away from it and again towards it. The simple Bernoulli argument thus leads to the same conclusion, namely an increase of the pressure
 $p_{s}^{\prime }$ in the outlet plane.
On the other hand, for the stable case (S1) with  $\unicode[STIX]{x1D6FA}=5.45$ the structure of the vorticity perturbation changes sign only once. The result is that the shear layer is displaced away from the wall in the outlet plane. The simple Bernoulli argument leads, in this case, to a decrease of the pressure
 $p_{s}^{\prime }$ in the outlet plane.
The explanation presented here is not fully rigorous, in particular because the impedance is based on the pressure  $p_{out}^{\prime }$ far downstream and not the one
 $p_{s}^{\prime }$ at the outlet of the hole. The validity of the Bernoulli law is also questionable in such unsteady regimes. Eventually, the argument assumes a fully detached shear layer and does not explain why instability is also possible in ranges of Reynolds numbers where the recirculation bubble is closed. Still, we believe this reasoning gives a simple explanation to the fact that minima of
 $Z_{R}$ (potentially unstable situations) are associated with an odd number of structures within the thickness while maxima of
 $Z_{R}$ (most stable situations) are associated with an even number of structures within the thickness of the hole.
Impedance results for  $\unicode[STIX]{x1D6FD}=1$. (a,c,e,g) Plot of
 $Z_{R}$ (solid line) and
 $Z_{I}$ (dashed line) as functions of the perturbation frequency
 $\unicode[STIX]{x1D6FA}$. (b,d,f,h) Nyquist diagrams for (a,b),
 $Re=800$, (c,d),
 $Re=1200$, (e,f),
 $Re=1600$, (g,h),
 $Re=2000$. Points (C1), (S1), (H2), (C2) and (S2) indicate the locations corresponding to the structures shown in figures 11 and 12. Point ‘O’ indicates the starting point (
 $\unicode[STIX]{x1D6FA}=0$) of the Nyquist curves.

5.2 Case $\unicode[STIX]{x1D6FD}=1$

We now consider the case of a thicker hole with aspect ratio  $\unicode[STIX]{x1D6FD}=1$. Figure 10 plots the impedance for
 $Re$ from
 $800$ to
 $2000$. As in the previous case detailed in § 5.1, one can see the existence of several frequency intervals where
 $Z_{R}$ becomes negative.
The real and imaginary parts of the impedance  $Z_{h}$ are always positive for
 $Re=800$ (see figure 10a). As a consequence, the associated Nyquist curve plotted in figure 10(b) does not cross the
 $Z_{R}=0$ axis. The system displays two intervals of conditional instability at
 $Re=1200$, around
 $\unicode[STIX]{x1D6FA}\approx 2.5$ and
 $\unicode[STIX]{x1D6FA}\approx 4.7$, respectively. Note that the real part
 $Z_{R}$ presents larger oscillations than in the corresponding case at
 $\unicode[STIX]{x1D6FD}=0.3$.
When the Reynolds number is increased, both real and imaginary parts of the impedance reach very large values. Figure 10(e) plots  $Z_{R}$ and
 $-Z_{I}/\unicode[STIX]{x1D6FA}$ for
 $Re=1600$ and reveals four intervals of conditional instability and one interval of hydrodynamic instability. Another important result which can be seen in this figure is the existence of true zeros of the impedance. This happens in particular at
 $\unicode[STIX]{x1D6FA}\approx 2.07$. This property reveals the existence of a purely hydrodynamic instability, as discussed in § 3. This point will be further confirmed in § 6. Further increasing the Reynolds number to
 $Re=2000$ produces a second interval of hydrodynamic instability around
 $\unicode[STIX]{x1D6FA}=4.4$.
Structure of the unsteady flows for  $\unicode[STIX]{x1D6FD}=1$ and
 $Re=2000$. Real (a,c,e) and imaginary (b,d,f) parts of the pressure component: (C1) conditionally unstable case with
 $\unicode[STIX]{x1D6FA}=0.95$; (S1) stable case with
 $\unicode[STIX]{x1D6FA}=1.85$; (H2) unconditionally unstable case with
 $\unicode[STIX]{x1D6FA}=2.5$; (C2) conditionally unstable case with
 $\unicode[STIX]{x1D6FA}=2.7$; (S2) stable case with
 $\unicode[STIX]{x1D6FA}=3.8$.

In figures 11 and 12, we represent the pressure and vorticity components of the perturbations for  $Re=2000$ for five selected values of
 $\unicode[STIX]{x1D6FA}$ corresponding to points C1, S1, H2, C2, S2 as indicated in figure 10(h). Cases (C1, C2) and (S1, S2) correspond to minima and maxima of
 $Z_{R}$, while case (H2) correspond to the first positive maximum of
 $Z_{I}$.
In the pressure plots (figure 11), the same observations can be made as previously for  $\unicode[STIX]{x1D6FD}=0.3$, namely the real part of the pressure in the upstream domain is negative for conditionally unstable cases (C1) and (C2) and positive for stable cases ((S1) and (S2)). The case (H2) (third row) differs from all other cases by one property: the imaginary part of the upstream pressure is positive (see right plot).
Inspecting the real part of the vorticity perturbation (left column in figure 12) allows us to draw the same conclusions as in the previous section, namely conditionally unstable cases display an odd number of structures within the thickness and stable ones display an even number of structures. We may thus conclude that the simple argument explained in the previous paragraph and illustrated in the right column of figure 9 is also valid for  $\unicode[STIX]{x1D6FD}=1$.
For the unconditionally unstable case H2, the real part of the vorticity is quite similar to the conditionally unstable case (C2) and allows us to justify that  $Z_{R}$ is also negative in this case. On the other hand, inspecting the imaginary part of the vorticity perturbation (plot in the right column) does not easily allow us to justify that
 $Z_{I}$ is positive for case (H2), unlike all the other cases. It does not seem possible to give a simple explanation of the unconditional instability in terms of oscillations of the shear layer. We assume that the mechanism is more complex and includes some feedback mechanism occurring within the recirculation region.
Structure of the unsteady flows for  $\unicode[STIX]{x1D6FD}=1$ and
 $Re=2000$. Real (a,c,e) and imaginary (b,d,f) parts of the vorticity component, for the same values of
 $\unicode[STIX]{x1D6FA}$ as in figure 11.

5.3 Parametric study
In the previous sections, we documented the impedance results for  $\unicode[STIX]{x1D6FD}=0.3$ and
 $\unicode[STIX]{x1D6FD}=1$. In both cases, when increasing the Reynolds number, we observed the emergence of an increasing number of intervals of conditional instability, associated with the crossing of the real axis in the Nyquist diagram by successive ‘loops’ of the Nyquist curve. In addition, but only for
 $\unicode[STIX]{x1D6FD}=1$, we observed the emergence of an increasing number of purely hydrodynamic instabilities associated with the encircling of the origin by successive loops of the same curve. In this section, we present the results of a parametric study which allowed us to identify the regions of the conditional and hydrodynamic instabilities in the range
 $\unicode[STIX]{x1D6FD}=[0.1-2]$;
 $Re=[500-2000]$.
Thresholds for the onset of conditional instability (C1 to C4) and of hydrodynamic instability (H2 and H3).

Frequencies corresponding to conditional instability (C1 to C4) and hydrodynamic instability (H2 and H3).

Figure 13 shows the critical Reynolds number associated with each instability branch as a function of the aspect ratio  $\unicode[STIX]{x1D6FD}$. In this figure, curves labelled C1 to C4 correspond to the first four branches of the conditional instabilities, while branches H2 and H3 correspond to the first two branches of the hydrodynamic instabilities. We adopted this labelling because these instabilities are associated with the same ‘loops’ in the Nyquist curve as modes C2 and C3. Note that no crossing of the origin was ever observed along the first loop; this is why the figure does not display any H1 branch.
For short holes, branch C1 is the first to become unstable and branches C2, C3 etc. are only encountered at substantially larger  $Re$. This is compatible with the results of figure 7 for
 $\unicode[STIX]{x1D6FD}=0.3$, which indicates that branch C1 becomes unstable slightly below
 $Re=800$ and branch C2 between 1200 and 1600. The situation is different for longer holes as branches C2, C3 successively become the most unstable ones. For instance, for
 $\unicode[STIX]{x1D6FD}=1$, conditional instability first happens along branch C2 just above
 $Re=800$, and, as
 $Re$ is further increased, branches C3, C4 and C1 are then encountered in this order. This is again fully compatible with the Nyquist diagrams of figure 10.
Hydrodynamic instabilities generally occur at larger Reynolds numbers than conditional instabilities, and are encountered only for sufficiently thick holes ( $\unicode[STIX]{x1D6FD}>0.5$). For
 $\unicode[STIX]{x1D6FD}=1$, branch H2 becomes unstable for
 $Re\approx 1500$ and branch H3 for
 $Re\approx 1700$. This is again fully compatible with the Nyquist representations in figure 10.
We finally notice that for  $\unicode[STIX]{x1D6FD}<0.1$ no instability is found in the range investigated. This suggests that the limiting case of zero thickness is unconditionally stable, in accordance with the classical model of Howe and our previous investigation of this case (Fabre et al. Reference Fabre, Longobardi, Bonnefis and Luchini2019).
The frequencies associated with each of the instability branches are plotted in figure 14. We start by plotting the Strouhal number based on the hole radius  $R_{h}$ as a function of the aspect ratio
 $\unicode[STIX]{x1D6FD}$. Note that the frequencies associated with hydrodynamic instabilities H2 and H3 closely follow those associated with conditional instabilities C2 and C3, thus confirming our nomenclature choice.
It is interesting to note that all branches indicate that the frequency is inversely proportional to the aspect ratio of the hole. This suggests that, instead of the definition  $\unicode[STIX]{x1D6FA}$ used up to now, it may be better to define a Strouhal number based on the thickness of the hole as follows:
 $$\begin{eqnarray}\displaystyle St_{L}=\frac{f\,L}{U_{M}}\equiv \frac{\unicode[STIX]{x1D6FA}\unicode[STIX]{x1D6FD}}{\unicode[STIX]{x03C0}}. & & \displaystyle\end{eqnarray}$$
Plotting results using this definition leads to figure 14(b), which confirms that the Strouhal number is almost independent of the aspect ratio for all branches.
6 Linear stability results
We now present the results of the global stability approach to the problem. Before presenting the results, we stress two important points. First, in the whole range of parameters considered, non-axisymmetric perturbations  $(m\neq 0)$ were found to be always stable. Secondly, for axisymmetric modes
 $(m=0)$, unstable eigenmodes could only be found using stress-free conditions both upstream and downstream (
 $\hat{p}_{in}=\hat{p}_{out}=0;\hat{q}\neq 0$). On the other hand, changing the upstream condition to the more standard ‘inlet’ condition (
 $\hat{q}=0;\hat{p}_{in}-\hat{p}_{out}\neq 0$) yielded no unstable mode at all. Note that both choices of boundary conditions are perfectly relevant but correspond to different physical situations. Using a strictly incompressible liquid, these two cases could be realized in an experimental set-up where the upstream domain is of finite dimension and supplied by either a perfect pressure-imposing pump or a perfect volumetric pump. The choice
 $\hat{p}_{in}=\hat{p}_{out}=0$ considered in the following is also justified for a compressible gas in the case that both upstream and downstream domains are considered of large dimension (see appendix A).
(a) Non-dimensional growth rates  $\unicode[STIX]{x1D6FA}_{i}=(R_{h}/U_{M})\unicode[STIX]{x1D714}_{i}$ and (b) non-dimensional oscillation rates
 $\unicode[STIX]{x1D6FA}_{r}=(R_{h}/U_{M})\unicode[STIX]{x1D714}_{r}$ as functions of
 $Re$, computed through the linear stability approach (lines) and the order-one expansion based on impedance predictions (symbols).

6.1 Eigenvalues
The stability characteristics of the base flow are assessed by monitoring the evolution of the leading global modes. Figure 15(a) shows the growth rate  $\unicode[STIX]{x1D714}_{i}$ for the three least stable modes for
 $\unicode[STIX]{x1D6FD}=1$. Two of them become unstable in the plotted range of
 $Re$. The first branch becomes unstable at
 $Re\approx 1500$ while the second one presents a critical Reynolds number equal to
 $Re\approx 1700$. This is fully compatible with the impedance predictions corresponding to branches H2 and H3 discussed in the previous section.
Figure 15(b) displays the oscillation rate  $\unicode[STIX]{x1D714}_{r}$ for the same three modes. The three branches display an almost constant value of the radius-based Strouhal number
 $\unicode[STIX]{x1D6FA}$. The values for the unstable modes are
 $\unicode[STIX]{x1D6FA}\approx 2.1$ and
 $\unicode[STIX]{x1D6FA}\approx 4.2$, in perfect accordance with the expected values for modes H2 and H3.
Note that figure 15(a,b) displays the existence of a third branch of eigenvalues which is always stable. The corresponding frequency is observed for  $\unicode[STIX]{x1D6FA}\approx 0.5$, which corresponds to a value for which the first ‘loop’ of the Nyquist curve comes close to zero, but does not encircle it. This allows us to identify this mode with the ‘H1’ mode which was missing in figure 13. This mode actually exists as a global mode but remains stable for all values of
 $Re$ and
 $\unicode[STIX]{x1D6FD}$ in the investigated range.
As discussed in § 2, in addition to providing an instability criterion, knowledge of the impedance for real  $\unicode[STIX]{x1D714}$ also provides an estimation of the eigenvalues associated with the purely hydrodynamic instability valid in the case where
 $\unicode[STIX]{x1D714}_{i}$ is small. To demonstrate this, we have plotted with symbols in figure 15(a) the prediction of the asymptotic formula (2.8). As can be seen, this formula coincides very well with the numerically computed eigenvalues, but deviations are observed as soon as the dimensionless growth rate exceeds a value of about 0.1.
6.2 Eigenmodes and adjoint-based sensitivity
We now depict in the upper part of figure 16 the structure of the unstable modes computed for  $Re=1500$ and
 $Re=1700$, respectively. We display the pressure component (a,e) and the axial velocity component (b,f) using the same representation as for the forced structures in figure 11.
Structure of the unstable eigenmodes H2 for  $\unicode[STIX]{x1D6FD}=1;Re=1500$ (a,b) and H3 for
 $\unicode[STIX]{x1D6FD}=1;Re=1570$ (c,d). (a,c) Pressure component; (b,d) axial velocity component.

Structure of the adjoint eigenmodes (a,c) and structural sensitivity fields (b,d) associated with the eigenmodes plotted in figure 16.

The structure of the modes are dominated by axially extended streamwise velocity disturbances located downstream of the aperture and is indeed very similar to the structures obtained in the linearly forced problem. Note that the levels of the pressure components are now tending to zero both upstream and downstream, in accordance with the boundary conditions expected for the purely hydrodynamic instabilities. Apart from this, the eigenmode H2 has strong similarities to the corresponding mode in the forced case previously plotted in figures 11 and 12.
Finally, figure 17 completes the description of the eigenmodes by a plot of their associated adjoint fields and structural sensitivities. The adjoint modes (a,b) show that the region of maximum receptivity to momentum forcing is localized near the leading edge of the hole. The spatial oscillations develop in the upstream region. The distribution of the adjoint fields are also preserved over the range of Reynolds numbers investigated here.
The sensitivity is displayed by plotting the quantity  $S_{w}$ corresponding to the norm of the structural sensitivity tensor defined by (3.14). The sensitivity for both eigenmodes is essentially localized along the shear layer detaching from the upstream corner of the hole. This confirms that the region responsible for the instability mechanism is the boundary of the recirculation bubble formed within the thickness of the plate.
The fact that recirculation regions can lead to global instabilities is not surprising, and has actually been observed in a number of related studies considering recirculation bubbles along a flat wall (Hammond & Redekopp Reference Hammond and Redekopp1998; Rist & Maucher Reference Rist and Maucher2002; Avanci, Rodríguez & Alves Reference Avanci, Rodríguez and Alves2019) or after a bump (Ehrenstein & Gallaire Reference Ehrenstein and Gallaire2008) or a backward-facing step (Lanzerstorfer & Kuhlmann Reference Lanzerstorfer and Kuhlmann2012). In the cases where the bubble has a long extension, the instability mechanism can be explained by inspecting the local velocity profile, which indicates the presence of a region of inflectional absolute instability (in the sense of Huerre & Monkewitz (Reference Huerre and Monkewitz1990)). The studies cited above all indicate that this kind of instability is expected when the recirculation velocity  $U_{max}$ is approximately 0.15 times the outer velocity, which is in good agreement with our findings (see figure 6a). Recent works have also identified that separation bubbles can sustain several unstable modes (Ehrenstein & Gallaire Reference Ehrenstein and Gallaire2008) quantified by the number of vortical structures within the recirculation bubble, again in agreement with our findings. These arguments suggest that the present purely hydrodynamic instability belongs to the same class of global self-sustained instabilities. However, local arguments based on the inspection of the velocity profiles and identification of an absolute region cannot explain an important feature, namely the fact that the instability only exists with boundary conditions
 $p_{in}^{\prime }=p_{out}^{\prime }$ and disappears when the condition is changed to
 $q^{\prime }=0$.
Interestingly, the structural sensitivity also reaches significant levels in a second region located downstream of the aperture, especially for the mode H3. Note that a similar feature was also observed for instabilities of co-flowing jets (Canton, Auteri & Carini Reference Canton, Auteri and Carini2017). This result indicates that a positive instability feedback enhancing the instability mechanism may also come from the downstream region. This finding may be linked to the role of wavepackets propagating along the shear layer bounding the jet in the emergence of self-sustained oscillations (Schmidt et al. Reference Schmidt, Towne, Colonius, Cavalieri, Jordan and Brès2017).
7 Comparison with previous studies
In this section we review existing results obtained experimentally or numerically for configurations approaching the one investigated here. Compared to the large amount of literature devoted to the related situation of grazing flow over a perforated plate (a situation directly relevant to acoustic liners, see the literature cited in the introduction of Fabre et al. (Reference Fabre, Longobardi, Bonnefis and Luchini2019)), a much more limited number of studies have considered the flow through apertures (bias flow) and among them, most have considered either a large plate perforated by an array of apertures, or a single constriction in a long pipe with a constriction ratio  $d/D$ (where
 $d=2R_{h}$ is the constriction diameter and
 $D$ the pipe diameter) in the range
 $[0.5,0.8]$. Due to these different geometries, direct comparisons of impedances with our results are not possible, but a comparison of the range of frequencies leading to unstable behaviour leads to very good agreement.
Among the studies considering a multiply perforated plate, Jing & Sun (Reference Jing and Sun2000) measured experimentally the impedances for several configurations with variable hole thickness parameter  $\unicode[STIX]{x1D6FD}=L_{h}/(2R_{h})$. Their results for the case
 $\unicode[STIX]{x1D6FD}=1.2$ (see their figure 10) indicate negative impedances in a range of Mach number
 $M\in [0.18,0.22]$ which corresponds to
 $St_{L}\in [0.24,0.3]$. This range of frequencies is in good accordance with the value
 $St_{L}\approx 0.25$ associated with the conditional instability C1 found in our study. Note that their experiments correspond to a value of the Reynolds number
 $Re\approx 2000$, in the same range as our study.
The experiment by Su et al. (Reference Su, Rupp, Garmory and Carrotte2015) also reports, for  $\unicode[STIX]{x1D6FD}=0.5$, (see their figure 12) substantially negative impedances for values of the Strouhal number (based on diameter) larger than 2.8. When translated into our set of parameters, this corresponds to
 $\unicode[STIX]{x1D6FA}\approx 1.4$ or
 $St_{L}\approx 0.23$. This is again in good agreement with the C1 conditional instability frequency range.
Next, Moussou et al. (Reference Moussou, Testud, Auregan and Hirschberg2007) investigated experimentally a long pipe fitted with a constriction for a number of values of the constriction ratio and the thickness ratio  $\unicode[STIX]{x1D6FD}$. They observe that the conditional instability criterion
 $Z_{R}>0$ (or
 $arg(B)>\unicode[STIX]{x03C0}/2$ using their notation) is verified in a range
 $St_{L}\approx [0.2,0.25]$, again in good agreement with the C1 conditional instability frequency range. Furthermore, in several cases (especially
 $\unicode[STIX]{x1D6FD}=0.4$ and
 $0.5$) they observe a second range of frequencies
 $St_{L}\approx 0.7$ where the instability criterion is met. This second range is in good accordance with the C2 conditional instability frequency range.
Apart from impedance measurements in a forced case, a number of experimental works have observed spontaneous whistling in an unforced case and reported the corresponding Strouhal numbers. Testud et al. (Reference Testud, Auregan, Moussou and Hirschberg2009) report values in the range [0.2–0.3], while Anderson (Reference Anderson1954) recorded values in the range [0.26, 0.29]. All these values are again in good agreement with our own results.
A next highly relevant work, considering again the configuration of a pipe with a single constriction, is the numerical study of Kierkegaard et al. (Reference Kierkegaard, Allam, Efraimsson and Åbom2012) based on LNSE. As discussed in the introduction, despite the similar approach, a number of differences in the staring hypotheses make a direct comparison with our own study difficult. However, it must be emphasized that their results (presented in terms of the scattering matrix formalism instead of the impedance) predict an energy amplification for  $St_{L}\in [0.26,0.29]$ (see their figure 9), again in excellent agreement with our results. They further elaborate a Nyquist-based instability criterion incorporating the properties of the whole system (including acoustic reflexion at the pipe extremities). This criterion shows that, for given dimensions of the hole (namely
 $d/D=0.63$ and
 $\unicode[STIX]{x1D6FD}=0.27$), the dimension of the downstream pipes may render the whole system instable (case A) or stable (cases B and C). This conclusion is fully consistent with our characterization of the instability as a conditional instability.
Finally, the branch H2 indicates the existence of a purely hydrodynamic instability associated with an almost constant value of the Strouhal number  $St_{L}\approx 0.65$ in the whole range
 $\unicode[STIX]{x1D6FD}\in [0.4,1.5]$. This implies that a jet through a hole joining two open domains would spontaneously whistle at such frequencies, even in the absence of any acoustic resonator. We are not aware in the recent literature of such an observation, as in all the cited works the hole was fitted at the outlet of a long pipe which played the role of the acoustic resonator needed for conditional instability. To our knowledge, the only observation of the whistling flow through a large plate is the work of Bouasse (Reference Bouasse1929). This author indeed reported that the whistling frequency is proportional to the hole thickness, but unfortunately did not express this result in terms of a Strouhal number.
8 Conclusions and perspectives
In this paper, we investigated the unsteady behaviour of a laminar viscous jet through a circular aperture in a thick plate, using linearized Navier–Stokes equations. This method allows us to compute the impedance of the flow, which provides useful information on the coupling between the flow and the acoustic waves, and on the prediction of the stability or instability of the system. Impedance calculations allowed us to map the regime of existence of two kinds of possible instability: (i) a conditional instability associated with an over-reflection of acoustic waves, and (ii) a purely hydrodynamic instability associated with the spontaneous self-oscillation existing in the absence of any incoming acoustic wave. Both of these instabilities can be predicted in a simple way by plotting the impedance on a Nyquist diagram.
The main outcome of our study is the parametric study of § 5.3, providing a cartography of the regions of instability as functions of the Reynolds number and the aspect ratio  $\unicode[STIX]{x1D6FD}$ of the hole. The zero-thickness case (
 $\unicode[STIX]{x1D6FD}=0$) is stable in accordance with previous studies. For
 $\unicode[STIX]{x1D6FD}\gtrsim 0.1$ we observe conditional instabilities in several frequency intervals, the preferred mode of conditional instability (C1) for short holes corresponds to a Strouhal number
 $St\approx 0.25$, a value for which experimental observations confirm the existence of an instability mechanism coupling the jet to its acoustic environment. The purely hydrodynamic instability, on the other hand, is observed for longer holes (
 $\unicode[STIX]{x1D6FD}\gtrsim 0.5$) and higher Reynolds numbers (
 $Re\gtrsim 1500$). The preferred mode for
 $\unicode[STIX]{x1D6FD}\approx 1$ is associated with a higher value of the Strouhal number, namely
 $St\approx 0.65$.
In addition to the characterization of both types of instability through impedance calculations, we conducted a standard linear stability analysis (based on the computation of eigenvalues) which confirmed the range of existence of the purely hydrodynamic instability and allowed us to characterize the spatial structure of the eigenmodes. Downstream of the aperture, the eigenmodes are characterized by a strong spatial amplification due to the convectively unstable nature of the jet. The instability mechanism is better revealed by inspecting the adjoint eigenmodes and the adjoint-based structural sensitivity, which reveal that the core of the instability mechanism lies in the shear layer detaching from the upstream edge of the hole. This observation suggests that the recirculation region existing within the thickness of the hole plays a key role.
By considering a locally incompressible flow and an idealized geometry corresponding to a circular hole with sharp corners connecting two domains of large extension, we have been able to focus on the hydrodynamic aspects of the whistling jet phenomenon, and characterize them without any precise reference to the acoustic environment. However, the study shows that the first to emerge is the conditional one. We thus plan to continue this study considering more realistic situations involving a resonator. Three configurations are particularly interesting. The first is the case where the upstream domain is a closed cavity acting as a Helmholtz resonator. The second is the case where the hole is fitted at the outlet of a long pipe. This configuration is called the Pfeifenton and was made the object of investigations in the 1950s (see Anderson Reference Anderson1954) which have to be reconsidered in view of the present model. The last one is the hole-tone configuration corresponding to a jet passing through two successive holes. NLSE has been recently applied to this case (Longobardi et al. Reference Longobardi, Fabre, Bonnefis, Citro, Giannetti and Luchini2018) considering both a fully compressible approach and an ‘augmented incompressible approach’ in which resonators are modelled by equivalent impedances. Such an approach is a promising one for the whole class of problems considered here, and more generally for the study of musical instruments (Fabre et al. Reference Fabre, Bonnefis, Charru, Russo, Citro, Giannetti and Luchini2014).
Aside from the characterization of the conditional instability in more realistic geometries, future works should be conducted to confirm the existence of the purely hydrodynamic instability in the absence of acoustic resonators. To our knowledge, the only report of a whistling jet in the case of a hole connecting two open domains of large dimensions is the work by Bouasse in the 1920s. Experiments and numerical simulations should be conducted in this range to confirm our predictions.
Finally, since our study points out the important role of the shear layer formed at the upstream corner of the hole, future experimental and numerical studies should pay special attention to the sharpness of this corner. A preliminary study using LNSE and considering rounded corners indeed reveals that even a very small radius of curvature notably delays the onset of instabilities.
Declaration of interests
The authors report no conflict of interest.
Appendix A. Link between impedance and reflection coefficient
The objective of this appendix is to establish the link between the impedance of the aperture and the reflection coefficient of an acoustic wave. For this purpose, we will perform an asymptotic matching between the incompressible ‘inner’ solution investigated in the main part of the paper and a compressible ‘outer solution’ expressed in terms of spherical acoustic waves.
We thus consider an outer solution composed in the upstream domain of an incident convergent spherical wave of amplitude  $A$ and a reflected divergent spherical wave of amplitude
 $B$, and in the downstream region of a transmitted spherical diverging wave of amplitude
 $C$. We use spherical coordinates and assume a pressure field
 $p^{\prime }(r_{s},t)$ and a velocity field
 $\boldsymbol{u}^{\prime }=u_{rs}^{\prime }(r_{s},t)\boldsymbol{e}_{rs}$ where
 $r_{s}=\sqrt{r^{2}+x^{2}}$ is the spherical radial coordinate and
 $\boldsymbol{e}_{rs}$ is the unit vector in the radial direction. The pressure and axial velocity fields have the classical expressions,
 $$\begin{eqnarray}\displaystyle & \displaystyle p^{\prime }(r_{s},t)=\left\{\begin{array}{@{}ll@{}}\displaystyle \frac{A}{r_{s}}\text{e}^{-\text{i}(kr_{s}+\unicode[STIX]{x1D714}t)}+\frac{B}{r_{s}}\text{e}^{\text{i}(kr_{s}-\unicode[STIX]{x1D714}t)} & x<0;\\[12.0pt] \displaystyle \frac{C}{r_{s}}\text{e}^{\text{i}(kr_{s}-\unicode[STIX]{x1D714}t)} & x>0,\end{array}\right. & \displaystyle\end{eqnarray}$$
 $$\begin{eqnarray}\displaystyle & \displaystyle u_{rs}^{\prime }(r_{s},t)=\left\{\begin{array}{@{}ll@{}}\displaystyle \frac{A}{\text{i}\unicode[STIX]{x1D70C}\unicode[STIX]{x1D714}}\left(\frac{1}{r_{s}^{2}}-\frac{\text{i}k}{r_{s}}\right)\text{e}^{-\text{i}(kr_{s}+\unicode[STIX]{x1D714}t)}+\frac{B}{\text{i}\unicode[STIX]{x1D70C}\unicode[STIX]{x1D714}}\left(\frac{1}{r_{s}^{2}}+\frac{\text{i}k}{r_{s}}\right)\text{e}^{\text{i}(kr_{s}-\unicode[STIX]{x1D714}t)} & x<0;\\[12.0pt] \displaystyle \frac{C}{\text{i}\unicode[STIX]{x1D70C}\unicode[STIX]{x1D714}}\left(\frac{1}{r_{s}^{2}}+\frac{\text{i}k}{r_{s}}\right)\text{e}^{\text{i}(kr_{s}-\unicode[STIX]{x1D714}t)} & x>0,\end{array}\right.\quad & \displaystyle\end{eqnarray}$$
where  $k=\unicode[STIX]{x1D714}c_{0}$ is the acoustic wavenumber and
 $c_{0}$ is the speed of sound. The inner limit (
 $r_{s}\rightarrow 0$) of this outer solution can be expressed as follows:
 $$\begin{eqnarray}\displaystyle & \displaystyle p^{\prime }(r_{s},t)\approx \left\{\begin{array}{@{}ll@{}}\displaystyle \left(\frac{(A+B)}{r_{s}}+\text{i}k(B-A)\right)\text{e}^{-\text{i}\unicode[STIX]{x1D714}t} & x<0;\\[10.0pt] \displaystyle \left(\frac{C}{r_{s}}+\text{i}kC\right)\text{e}^{-\text{i}\unicode[STIX]{x1D714}} & x>0,\end{array}\right. & \displaystyle\end{eqnarray}$$
 $$\begin{eqnarray}\displaystyle & \displaystyle u_{rs}^{\prime }(r_{s},t)\approx \left\{\begin{array}{@{}ll@{}}\displaystyle \frac{(A+B)}{\unicode[STIX]{x1D70C}\text{i}\unicode[STIX]{x1D714}r_{s}^{2}}\text{e}^{-\text{i}\unicode[STIX]{x1D714}t} & x<0;\\[12.0pt] \displaystyle \frac{C}{\unicode[STIX]{x1D70C}\text{i}\unicode[STIX]{x1D714}r_{s}^{2}}\text{e}^{-\text{i}\unicode[STIX]{x1D714}t} & x>0.\end{array}\right. & \displaystyle\end{eqnarray}$$
The outer limit of the inner solution (i.e. the incompressible solution considered in the main part of the paper) is a spherical source (respectively sink) of flow rate  $q^{\prime }$ in the downstream (respectively upstream) domain and reads,
 $$\begin{eqnarray}\displaystyle & \displaystyle u_{rs}^{\prime }(r_{s},t)\approx \left\{\begin{array}{@{}ll@{}}\displaystyle \frac{-q^{\prime }}{2\unicode[STIX]{x03C0}r_{s}^{2}}\text{e}^{-\text{i}\unicode[STIX]{x1D714}t} & x<0;\\[12.0pt] \displaystyle \frac{q^{\prime }}{2\unicode[STIX]{x03C0}r_{s}^{2}}\text{e}^{-\text{i}\unicode[STIX]{x1D714}t} & x>0,\end{array}\right. & \displaystyle\end{eqnarray}$$
 $$\begin{eqnarray}\displaystyle & \displaystyle p^{\prime }(r_{s},t)\approx \left\{\begin{array}{@{}ll@{}}\displaystyle \left(p_{in}^{\prime }+\frac{\unicode[STIX]{x1D70C}\text{i}\unicode[STIX]{x1D714}q^{\prime }}{2\unicode[STIX]{x03C0}r_{s}}\right)\text{e}^{-\text{i}\unicode[STIX]{x1D714}t} & x<0;\\[10.0pt] \displaystyle \left(p_{out}^{\prime }-\frac{\unicode[STIX]{x1D70C}\text{i}\unicode[STIX]{x1D714}q^{\prime }}{2\unicode[STIX]{x03C0}r_{s}}\right)\text{e}^{-\text{i}\unicode[STIX]{x1D714}} & x>0.\end{array}\right. & \displaystyle\end{eqnarray}$$
Note that the latter expressions comprise both the constant levels  $p_{out}^{\prime }$,
 $p_{in}^{\prime }$ and a subdominant term proportional to
 $1/r_{s}$ which was not mentioned in the main part of the paper. The latter corresponds to the pressure field associated with an unsteady incompressible source/sink.
The matching is done by identifying the coefficients of similar terms in (A 3), (A 4), (A 5), (A 6). This leads to,
 $$\begin{eqnarray}\displaystyle & \displaystyle (A+B)=\frac{-\unicode[STIX]{x1D70C}\text{i}\unicode[STIX]{x1D714}q^{\prime }}{2\unicode[STIX]{x03C0}}, & \displaystyle\end{eqnarray}$$
 $$\begin{eqnarray}\displaystyle & \displaystyle \text{i}k(B-A)=p_{in}^{\prime }, & \displaystyle\end{eqnarray}$$
 $$\begin{eqnarray}\displaystyle & \displaystyle C=\frac{-\unicode[STIX]{x1D70C}\text{i}\unicode[STIX]{x1D714}q^{\prime }}{2\unicode[STIX]{x03C0}}, & \displaystyle\end{eqnarray}$$
 $$\begin{eqnarray}\displaystyle & \displaystyle \text{i}kC=p_{out}^{\prime }. & \displaystyle\end{eqnarray}$$
The two latter relations can be combined with the introduction of the radiation impedance  $Z_{rad}$,
 $$\begin{eqnarray}\displaystyle Z_{rad}=\frac{p_{out}^{\prime }}{q^{\prime }}=\frac{\unicode[STIX]{x1D70C}\unicode[STIX]{x1D714}^{2}}{2\unicode[STIX]{x03C0}c_{0}}. & & \displaystyle\end{eqnarray}$$
The expressions can be eventually combined to express the amplitude reflection coefficient  $B/A$ in terms of the hole impedance
 $Z_{h}$ and the radiation impedance just introduced,
 $$\begin{eqnarray}\displaystyle \frac{B}{A}=\frac{-Z_{h}}{Z_{h}+2Z_{rad}}. & & \displaystyle\end{eqnarray}$$
The energy reflection coefficient  $R$ is eventually deduced as:
 $$\begin{eqnarray}\displaystyle R=\frac{|B|^{2}}{|A|^{2}}=\frac{|Z_{h}|^{2}}{|Z_{h}|^{2}+4Z_{rad}(Re(Z_{h})+Z_{rad})}. & & \displaystyle\end{eqnarray}$$
These expressions yield the following conclusions:
(i) The energy reflection
$R$ is larger than 1 (over-reflexion condition) if and only if $Re(Z_{h})+Z_{rad}<0$. In dimensionless terms, this leads to (A 14)(where$$\begin{eqnarray}\displaystyle Z_{R}+\frac{M\unicode[STIX]{x1D6FA}^{2}}{2\unicode[STIX]{x03C0}}<0 & & \displaystyle\end{eqnarray}$$$M$ is the Mach number), which reduces to the simpler condition $Z_{R}<0$ given in § 2 in the limit $M\ll 1$.(ii)
$B/A$ is infinite if and only if $Re(Z_{h})+2Z_{rad}=0$. The situation $B/A=\infty$ corresponds to a situation where a wave is emitted upstream ($B\neq 0$) in the absence of an incident wave ($A=0$), hence to a spontaneous self-oscillation associated with emission of sound both upstream and downstream. We recognize the definition of the purely hydrodynamic instability described in § 2. In dimensionless terms, the condition leads to (A 15)which reduces to the simpler condition$$\begin{eqnarray}\displaystyle Z+\frac{M\unicode[STIX]{x1D6FA}^{2}}{\unicode[STIX]{x03C0}}=0, & & \displaystyle\end{eqnarray}$$$Z_{R}=Z_{I}=0$ given in § 2 in the limit $M\ll 1$.


Note that the assumption of an incident converging spherical wave coming from a semi-infinite space adopted here is questionable; clearly, other choices are possible for modelling the upper domain. For instance, the case where the upper domain is a long pipe of radius  $R_{p}\gg R_{h}$ and the incident wave is a plane wave can also be considered, and the analysis leads to practically identical conclusions.
Appendix B. Details on the complex mapping technique and mesh validations
As identified in Fabre et al. (Reference Fabre, Longobardi, Bonnefis and Luchini2019), a severe numerical difficulty arises in the solution of the LNSE equations (for both forced and autonomous problems) due to the strong spatial amplification of linear perturbations. In this previous paper, use of a complex coordinate mapping was proposed as an efficient way to overcome this difficulty. Fabre et al. (Reference Fabre, Longobardi, Bonnefis and Luchini2019) demonstrated that, in conjunction with mesh adaptation, this method allows us both to significantly reduce the required number of mesh points and to extend the range of application of the LNSE up to  $Re\approx 3000$.
In this appendix we give some details about the implementation and efficiency of this technique for the present study. The technique has been used for both forced (impedance) and autonomous (eigenvalues) computations, but we only document its performance for the autonomous problem, restricting ourselves to the case  $\unicode[STIX]{x1D6FD}=1$.
In the present paper, the mappings from numerical coordinates ( $X,R$) to physical coordinates (
 $x,r$) are slightly different from the ones used in Fabre et al. (Reference Fabre, Longobardi, Bonnefis and Luchini2019), and defined as follows:
 $$\begin{eqnarray}\displaystyle & \displaystyle \begin{array}{@{}rcll@{}}x={\mathcal{G}}_{x}(X)\; & =\; & L_{M}+\frac{X-L_{M}}{\left[1-\left(\displaystyle \frac{X-L_{M}}{L_{A}-L_{M}}\right)^{2}\right]^{2}}\left[1+i\unicode[STIX]{x1D6FE}_{c}\tanh \left(\frac{X-L_{M}}{2L_{C}}\right)^{2}\right] & \text{for }X<L_{M},\\ \; & =\; & X & \text{for }L_{M}<X<L_{out}.\end{array} & \displaystyle\end{eqnarray}$$
 $$\begin{eqnarray}\displaystyle & \displaystyle \begin{array}{@{}rcll@{}}r={\mathcal{G}}_{r}(R)\; & =\; & R_{M}+\displaystyle \frac{R-R_{M}}{\left[1-\left(\displaystyle \frac{R-R_{M}}{R_{A}-R_{M}}\right)^{2}\right]^{2}} & \text{for }X>0\text{ and }R_{A}<R<R_{out},\\[8.0pt] \; & =\; & R & \text{otherwise}.\end{array} & \displaystyle\end{eqnarray}$$
Note that the mapping of the  $x$-direction involves both an imaginary part (controlled by the parameter
 $\unicode[STIX]{x1D6FE}_{c}$) and a stretching (controlled by the parameter
 $L_{A}$). The difference from Fabre et al. (Reference Fabre, Longobardi, Bonnefis and Luchini2019) is the presence of an additional parameter
 $L_{m}$ such that the complex mapping only applies for
 $x>L_{m}$.
Description of meshes  $\mathbb{M}_{1}$–
 $\mathbb{M}_{4}$ built for
 $\unicode[STIX]{x1D6FD}=1$ following four different strategies.
 $[L_{M},L_{C},L_{A},\unicode[STIX]{x1D6FE}_{c},R_{M},R_{A}]$: parameters defining the coordinate mapping.
 $[x_{max},r_{max}]$: effective dimensions in physical coordinates.
 $\unicode[STIX]{x1D6FF}_{M}$: prescribed value of the maximum grid step. Adapt.: mesh adaptation strategy (see text).
 $N_{v}$: number of vertices of the mesh obtained at the outcome of the adaptation process.

The set of parameters used and the corresponding dimension of the domain in complex coordinates are reported in table 1.
For validation of the method it is essential to demonstrate that the results are effectively independent of the values of the parameters. In the present study we have mainly used two kinds of meshes involving complex mapping, with properties detailed in table 1. The first one, named  $\mathbb{M}_{1}$, and already plotted in figure 3, is very similar to the one used in Fabre et al. (Reference Fabre, Longobardi, Bonnefis and Luchini2019) for the case of the zero-thickness hole. This kind of mesh has been used for the impedance-based parametric study of § 5.3. On the other hand, since the coordinate mappings applies for
 $x>L_{M}=0$, it is not suited to representing the linear forced flow and eigenmode structures. The second kind of mesh, named
 $\mathbb{M}_{2}$, has no stretching (thus parameters
 $L_{A}$ and
 $R_{A}$ are not relevant) but only complex mapping. This kind of mesh has been used to plot the structures (figures 8, 10 and 14) since complex mapping only applies for
 $x>L_{M}=5$, outside of the chosen range of these figures. The two meshes also differ in the mesh adaptation strategy: mesh
 $\mathbb{M}_{1}$ is adapted to the base flow (BF) for
 $Re=2000$ and two forced flow (F) structures computed for two values of
 $\unicode[STIX]{x1D6FA}$ spanning the range of the parametric study, namely
 $\unicode[STIX]{x1D6FA}=0.5$ and
 $\unicode[STIX]{x1D6FA}=4.5$, following the same strategy as in Fabre et al. (Reference Fabre, Longobardi, Bonnefis and Luchini2019). For this mesh a maximum grid step
 $\unicode[STIX]{x1D6FF}_{M}=1$ is prescribed. Mesh
 $\mathbb{M}_{2}$ is designed in the same way but a variable
 $\unicode[STIX]{x1D6FF}_{M}$ is prescribed using the ‘Adaptation masks’ (m) strategy, as described in the documentation of StabFem (available on the website of the project). Namely, we impose
 $\unicode[STIX]{x1D6FF}_{M}=0.1$ in an inner box defined by
 $(x,r)\in [-1,3]\times [0,1.5]$,
 $\unicode[STIX]{x1D6FF}_{M}=0.3$ in an intermediate box defined by
 $(x,r)\in [0,20]\times [0,3]$, and
 $\unicode[STIX]{x1D6FF}_{M}=4$ outside.
For validation purposes, we have also designed two meshes,  $\mathbb{M}_{3}$ and
 $\mathbb{M}_{4}$, which do not involve coordinate mapping. These meshes are designed with a longer axial dimension
 $L_{out}$, and are characterized by a larger number of vertices. For
 $\mathbb{M}_{3}$, mesh adaptation is performed using the base flow and the two leading eigenmodes H1 and H2 using both direct and adjoint modes (
 $\text{M}+\text{A}$), following the same strategy as in Fabre et al. (Reference Fabre, Citro, Sabino, Bonnefis, Sierra, Giannetti and Pigou2018).
Figure 18(a) displays the structure of meshes  $\mathbb{M}_{2}$ and
 $\mathbb{M}_{4}$. It is found that the mesh adaptation strategy used for mesh
 $\mathbb{M}_{2}$ is most efficient to concentrate the grid points in the most significant regions of the flow (inside the hole) while
 $\mathbb{M}_{4}$ concentrates a much larger number of points in the far downstream regions.
(a) Structure of meshes  $\mathbb{M}_{2}$ (upper) and
 $\mathbb{M}_{4}$ (lower); (b) pressure component of the eigenmode H3 for
 $Re=1600$, as computed using mesh
 $\mathbb{M}_{2}$ (upper) and
 $\mathbb{M}_{4}$ (lower).

Spectra computed with three different meshes:  $\times$ (red online): mesh
 $\mathbb{M}_{1}$ (complex mapping);
 $\ast$ (green online): mesh
 $\mathbb{M}_{3}$ (no mapping,
 $X_{max}=30$);
 $+$ (blue online): mesh
 $\mathbb{M}_{4}$ (no mapping,
 $X_{max}=60$). (a)
 $\unicode[STIX]{x1D6FD}=1;Re=1700$; (b)
 $\unicode[STIX]{x1D6FD}=1;Re=2000$.

Figure 19 superposes the numerically computed spectra using meshes  $\mathbb{M}_{1}$,
 $\mathbb{M}_{3}$ and
 $\mathbb{M}_{4}$ for
 $Re=1700$ and
 $2000$. As usual, along with the eigenvalues of the proper global eigenmodes H1, H2, H3, the spectra display a large number of so-called ‘artificial eigenvalues’. As can be seen, both meshes
 $\mathbb{M}_{3}$ and
 $\mathbb{M}_{4}$ lead to the presence of artificial modes in the unstable part (
 $\unicode[STIX]{x1D714}_{i}>0$) of the complex plane, and as the Reynolds number is increased they come dangerously close to the physical eigenvalues. On the other hand, the complex mapping used for mesh
 $\mathbb{M}_{1}$ results in a good separation between the physical eigenvalues and the artificial ones, which are substantially shifted in the stable part
 $(\unicode[STIX]{x1D714}_{i}<0)$ of the complex plane. Note, however, that use of the complex mapping does not allow us to compute the complex conjugates of modes H1, H2, H3 located in the
 $\unicode[STIX]{x1D714}_{r}<0$ half-plane. For reasons discussed in Fabre et al. (Reference Fabre, Longobardi, Bonnefis and Luchini2019), using a complex mapping with
 $\unicode[STIX]{x1D6FE}_{c}>0$ only allows us to suppress the spatial amplification of linear forced structures (or eigenmodes) with
 $\unicode[STIX]{x1D714}_{r}>0$. Instead, choosing
 $\unicode[STIX]{x1D6FE}_{c}<0$ would give access to the other half of the spectrum.
Eigenvalues computed with four different meshes for  $Re=1600$ and
 $Re=2000$ (
 $\unicode[STIX]{x1D6FD}=1$).

Table 2 displays the eigenvalues associated with H1, H2, H3 computed for $Re=1600$ and 2000 using all meshes considered here. The table confirms that the results obtained using complex mapping are independent of the values of the parameters (value for
 $\mathbb{M}_{1}$ and
 $\mathbb{M}_{2}$ are very close to each other despite the fact that the parameters are very different). They also show that the meshes
 $\mathbb{M}_{3}$ and
 $\mathbb{M}_{4}$ are less reliable, despite the fact that they contain a larger number of vertices.
Finally, figure 18(b) depicts the structure of the eigenmode H2 computed using meshes  $\mathbb{M}_{2}$ and
 $\mathbb{M}_{4}$ for
 $Re=1600$. As the complex mapping for mesh
 $\mathbb{M}_{2}$ only applies for
 $x>L_{m}=5$, the structure for
 $x<L_{m}$ is expected to be identical as when computed without this method. The figure confirms that this is effectively the case. On the other hand, for
 $x>L_{m}$ the eigenmode computed in physical coordinates still displays a spatial amplification up to a very large downstream distance. On the other hand, the complex mapping results in a suppression of this spatial amplification.
Note that figure 18(b) makes use of a non-uniform colour map. Without this trick, it would be impossible to give a good representation of the structure, as the maximum values  $p^{\prime }$ are of order
 $1.6\times 10^{3}$ and
 $5.8\times 10^{4}$ for
 $\mathbb{M}_{2}$ and
 $\mathbb{M}_{4}$, respectively. Hence use of the complex mapping limits the round-off errors due to the very large maximal levels reached far downstream. Note that, on the other hand, this visualization method enhances the numerical imprecision in the external parts of the flow where the mesh is less refined (but where mesh refinement is not necessary for accurate computation of the eigenvalues).



