Many high-risk, high-consequence technical environments, including air traffic control, hydroelectric power generation, and emergency services, are characterized by time pressure, uncertainty, and dynamic relationships between components (Orasanu & Connolly, Reference Orasanu, Connolly, Klein, Orasanu, Calderwood and Zsambok1993). The safe and efficient management of these environments is reliant upon effective communication between operators, where any communication error has the potential for a significant loss (Australian Transport Safety Bureau, 2007). The process of communication within such domains is inherently a joint activity between communicative partners (Clark, Reference Clark1994; Clark & Schaefer, Reference Clark and Schaefer1989).
Models of dialogue structure, such as the collaborative model (Clark, Reference Clark1994; Clark & Brennan, Reference Clark, Brennan, Resnick, Levine and Teasley1991; Clark & Schaefer, Reference Clark and Schaefer1987, Reference Clark and Schaefer1989; Clark & Wilkes-Gibbs, Reference Clark and Wilkes-Gibbs1986), emphasize that both communicative partners have a shared responsibility to ensure that information exchanged has been appropriately heard and understood before the conversation proceeds. A communicative exchange involves two distinct stages: the presentation of information and the grounding of that information (Clark & Schaefer, Reference Clark and Schaefer1987).
During the presentation stage, the sender will provide information for the receiver to interpret and from which meaning can be derived. During the grounding stage, the sender and receiver collaborate to ensure that the receiver has understood the sender's intended message (Clark & Brennan, Reference Clark, Brennan, Resnick, Levine and Teasley1991; Clark & Schaefer, Reference Clark and Schaefer1987). For grounding to take place, the receiver must demonstrate evidence of understanding to the sender, and the sender must accept the evidence as true. When the process of grounding is successful, the utterance from the sender is referred to as “common ground” between the two communicative participants (Clark & Schaefer, Reference Clark and Schaefer1987, p. 19).
MISCOMMUNICATION
Although the objective of any communicative transaction is to ensure mutual understanding between all participants (Dascal & Berenstein, Reference Dascal and Berenstein1987), communication has been identified as a contributing factor in a significant proportion of errors within many high-risk industries (Kim, Park, Han, & Kim, Reference Kim, Park, Han and Kim2010). For example, Billings and Cheaney (Reference Billings, Cheaney, Billings and Cheaney1981) noted that information transfer difficulties were a primary factor in over 70% of cases reported to the National Aeronautics and Space Administration Aviation Safety Reporting System. Similarly, Greenberg et al. (Reference Greenberg, Regenbogen, Studdert, Lipsitz, Rogers, Zinner and Gawande2007) reported that miscommunication contributed to almost a quarter of surgical malpractice claims that led to patient harm.
Miscommunication is the broad term used to encompass the various types of communicative problems that can occur in discourse (Skantze, Reference Skantze2005). There are two main types of miscommunication: misunderstandings and nonunderstandings (Hirst, McRoy, Heeman, Edmonds, & Horton, Reference Hirst, McRoy, Heeman, Edmonds and Horton1994). In a misunderstanding, receivers are under the incorrect assumption that they have understood the instruction and thus remain unaware that an error in discourse has occurred (Hirst et al., Reference Hirst, McRoy, Heeman, Edmonds and Horton1994; Skantze, Reference Skantze2005).
In contrast, a nonunderstanding refers to instances where a receiver does not obtain any meaningful interpretation of a message or is unable to select from two or more interpretations of a message (Skantze, Reference Skantze2005). A nonunderstanding involves conscious awareness of a partial or complete lack of understanding and can be disclosed or concealed (Weigand, Reference Weigand1999). A disclosed nonunderstanding occurs when a receiver fails to understand a message and alerts the sender that the message has not been understood. In contrast, a concealed nonunderstanding occurs when the receiver fails to understand a message, but deceptively conceals this state of nonunderstanding from the sender (Weigand, Reference Weigand1999).
THE READBACK/HEARBACK COMMUNICATIVE PROTOCOL
While nonunderstandings can occur in many different types of communicative exchanges, they can also threaten the effectiveness of the readback/hearback protocol. This is a communications procedure that specifies how verbal instructions are to be delivered and confirmed over the radio/telephone (Prinzo & Britton, Reference Prinzo and Britton1993). Used in many different high-risk operational environments, including aviation, electricity transmission control, hydroelectric power generation, and more recently, in some healthcare settings, this protocol is used to reduce operator error and maintain the integrity of communication processes (Prabhakar et al., Reference Prabhakar, Cooper, Sabel, Weckbach, Mehler and Stahel2012; Prinzo & Britton, Reference Prinzo and Britton1993).
This four-step protocol is initiated when a sender transmits a verbal message to a receiver (Federal Aviation Administration, 2015, Section 2-4-3). For example, an air traffic controller might send the following instruction to a pilot; “Aircraft X, turn left to a heading of zero three zero” (Barshi & Farris, Reference Barshi and Farris2013, p. 2). The receiver is then required to actively listen to the instruction before repeating the instruction verbatim back to the sender (known as the readback). In the aviation context, a pilot would respond to the air traffic controller with “Turning left to a heading of zero three zero, Aircraft X.” The sender is then expected to listen to the readback to ensure that it has been repeated correctly, which is referred to as the hearback portion of the exchange (Cushing, Reference Cushing1995; Prinzo & Britton, Reference Prinzo and Britton1993; Prinzo, Hendrix, & Hendrix, Reference Prinzo, Hendrix and Hendrix2006).
The main purpose of the readback/hearback loop is to ensure that the receiver has accurately heard the instruction as the sender is able to identify and correct any errors made in the readback during the hearback portion of the exchange (Prinzo & Britton, Reference Prinzo and Britton1993; Prinzo et al., Reference Prinzo, Hendrix and Hendrix2006). For example, if the sender hears the pilot incorrectly read back the instruction as “Turning left to a heading of zero three three, Aircraft X” during the hearback, the sender is expected to correct the misheard heading on the part of the pilot and reinitiate the readback/hearback loop until the correct instruction has been heard. If a receiver is given an instruction that is not understood, this can be indicated to the sender in lieu of a readback (i.e., disclosed nonunderstanding), allowing the information to be recommunicated until the instruction becomes common ground between the communicative participants (Streitenberger, Breen-Reid, & Harris, Reference Streitenberger, Breen-Reid and Harris2006).
Readback/hearback protocol limitation
Although the readback/hearback protocol is an effective strategy for the identification of misunderstandings and disclosed nonunderstandings, it does not necessarily protect against concealed nonunderstandings, because a nonunderstanding can be concealed, despite an accurate readback (Jones, Reference Jones2003). Concealed nonunderstandings on the part of the receiver in a readback/hearback exchange may also go undetected by a sender for various reasons. For example, senders (of any communicative exchange) have a tendency to overestimate the extent to which they have successfully communicated the intended meaning of a message and, therefore, may not anticipate a lack of understanding (Fay, Page, & Serfaty, Reference Fay, Page and Serfaty2010; Keysar & Henly, Reference Keysar and Henly2002). Further, receivers may prefer to conceal a lack of understanding to “save face,” especially in those situations where there is an expectation that the instruction would normally be understood (Chiang & Pepper, Reference Chiang and Pepper2006).
There is also an explicit expectation in many high-risk environments, including aviation, that the receipt of an accurate readback provides evidence to the sender that the message has been understood by the receiver (Federal Aviation Administration, 2014; Morrow, Rodvold, & Lee, Reference Morrow, Rodvold and Lee1994). Nevertheless, nonunderstandings, in spite of an accurate readback, do occur (Air Accidents Investigation Branch, 2008; Billings & Cheaney, Reference Billings, Cheaney, Billings and Cheaney1981; Morrow et al., Reference Morrow, Rodvold and Lee1994). This suggests that the delivery of an accurate readback from a receiver does not necessarily provide the sender with adequate evidence during the grounding process to indicate that mutual understanding has taken place.
Reliance on auditory cues to gauge understanding
The identification of effective strategies that could improve the detection of nonunderstandings during the grounding process of readback/hearback exchanges is an important step in improving the integrity of this communication system. For grounding to take place within a communicative exchange, the collaborative model suggests that the sender will rely on evidence from the receiver's utterance to gauge whether or not the message has been understood as intended (Clark & Brennan, Reference Clark, Brennan, Resnick, Levine and Teasley1991). Because the readback/hearback protocol takes place primarily over the radio/telephone, this evidence can only be derived from auditory cues, including the linguistic cues within the speech (the syllables, words, or phrases of an utterance) and the prosodic cues inherent in vocal communication (Drummond & Hopper, Reference Drummond, Hopper, Coupland, Giles and Wiemann1991; Kanki & Smith, Reference Kanki, Smith, Salas, Bowers and Edens2001; Nygaard, Herold, & Namy, Reference Nygaard, Herold and Namy2009; Soskin, Reference Soskin1953). Prosodic cues refer to the range of paralinguistic characteristics of the voice, such as tempo and intonation, that influence how something is said (Bolinger, Reference Bolinger1985). In the absence of visual cues, operators working in domains that rely on radio communication are exclusively dependent on linguistic and prosodic cues to determine levels of understanding.
Auton, Wiggins, Searle, Loveday, and Xu Rattanasone (Reference Auton, Wiggins, Searle, Loveday and Xu Rattanasone2013) were the first to investigate whether particular prosodic cues, when contained within a full readback spoken by a receiver, were salient to a sender (i.e., listener of a readback) to gauge the extent to which the receiver had understood the instruction during the grounding process. Using electricity transmission control as a context, Auton et al. (Reference Auton, Wiggins, Searle, Loveday and Xu Rattanasone2013) asked network operators to listen to a series of auditory-only, simulated readback/hearback communicative exchanges. During each exchange, participants heard a sender delivering an instruction to a receiver, followed by the receiver delivering an accurate readback to the sender. Auton et al. systematically manipulated three prosodic cues contained within the readback (specifically, final intonation, filler, and interturn delay), to determine whether these cues signalled to a participant (i.e., “listener”), the extent to which a receiver (i.e., “speaker”) had understood an instruction. These specific prosodic cues were derived from Brennan and Williams (Reference Brennan and Williams1995) who examined the role of prosody during perceptions of uncertainty. After listening to each exchange, participants were asked to rate the extent to which they perceived the receiver had understood the instruction based on the way the readback had been spoken.
Intonation is generally understood as the pitch patterns of a spoken utterance or the “melody” of speech, where there is a basic division between tunes falling in pitch (i.e., falling intonation) and those rising in pitch (i.e., rising intonation; Bolinger, Reference Bolinger1985; Cruttenden, Reference Cruttenden1981; Denes & Milton-William, Reference Denes and Milton-William1962; Hunter, Reference Hunter and Turney2004; O'Connor & Arnold, Reference O'Connor and Arnold1961). Interturn delay refers to the duration of silence between the end of one speaker's utterance and the beginning of the other speaker's response (Roberts, Francis, & Morgan, Reference Roberts, Francis and Morgan2006). An unfilled interturn delay refers to a delay that only contains silence, whereas a filled interturn delay refers to a delay that contains a filler (a speech interjection, such as uh or um; Clark & Fox Tree, Reference Clark and Fox Tree2002; Goldman-Eisler, Reference Goldman-Eisler1961).
Auton et al. (Reference Auton, Wiggins, Searle, Loveday and Xu Rattanasone2013) observed that the prosodic cues of final intonation and filler, when contained within the readback portion of the exchange, had the capacity to signal to a listener a receiver's state of understanding. In final intonation, participants perceived that the receiver had a lower level of understanding of the instruction when the readback ended with rising intonation in comparison to falling intonation. For filler, participants perceived readbacks that were preceded by the filler um as signaling a relatively lower level of understanding on the part of the receiver, compared to readbacks that were not preceded by a filler. Even though the duration of interturn delay had been found to be a useful cue during perceptions of uncertainty (Brennan & Williams, Reference Brennan and Williams1995), no association between perceptions of nonunderstanding and the duration of interturn delays was evident.
Utility of the linguistic content of the readback response to gauge understanding
Although Auton et al. (Reference Auton, Wiggins, Searle, Loveday and Xu Rattanasone2013) demonstrated that particular prosodic cues were useful to network operators in detecting varying levels of understanding on the part of the receiver when a full readback was articulated, they did not consider whether such cues would be relied upon when a receiver responded with a partial readback. In a partial readback response, the receiver does not repeat all the information in the instruction provided by the sender and, therefore, provides the sender with less linguistic evidence that an instruction has been understood (Barshi & Farris, Reference Barshi and Farris2013). It is unclear from Auton et al. (Reference Auton, Wiggins, Searle, Loveday and Xu Rattanasone2013) whether the utility of final intonation, filler, and less so interturn delay, only exists when the precondition of a full readback is met. Evidence from Brennan and Williams’ (Reference Brennan and Williams1995) investigation into the usefulness of prosodic cues during perceptions of uncertainty suggest that these cues are still used by listeners to gauge a speaker's level of certainty, even when the listener does not have evidence that the speaker's linguistic response is accurate. However, this proposition has not been tested empirically within the framework of nonunderstandings and the readback/hearback protocol.
Although there is an explicit expectation in many high-risk environments that operators provide a full readback to an issued instruction (i.e., a receiver is to repeat the message back to the sender in full), procedural variations occur frequently. For example, Morrow, Lee, and Rodvold (Reference Morrow, Lee and Rodvold1993) observed that up to 13% of the routine pilot communication they analyzed contained partial, rather than full, readbacks. Other investigators have reported similar figures (Cardosi, Reference Cardosi1993; Prinzo et al., Reference Prinzo, Hendrix and Hendrix2006). If prosodic cues, such as final intonation, filler, and interturn delay, have the potential to be used as a training tool to improve operator detection of nonunderstandings, it is important to establish whether the use of such cues can be generalized across nonroutine responses to instructions (i.e., during partial readback responses).
In addition to examining the potential interaction between prosodic cues and the linguistic content within a readback response during judgements of understanding, it is also important to assess whether the contrast between full and partial readback responses to an instruction affects perceptions of understanding. Within many technical environments, there is an assumption that the receipt of a full readback from a receiver is necessary evidence to infer understanding on the part of the receiver (International Civil Aviation Organization, 2007). Evidence from the conversation analytic literature supports this notion with partial repeats, especially those that end in rising intonation (partial questioning repeats), constituting repair initiations on the part of the speaker who uttered the repeat (Kim, Reference Kim2002; Robinson, Reference Robinson, Hayashi, Raymond and Sidnell2013; Schegloff, Reference Schegloff2007).
Recovering from, or repairing, difficulties in communication can be either self-initiated (executed by the communicator of the “trouble source”) or other initiated (executed by the communicator who is the recipient of the trouble source; Schegloff, Reference Schegloff2000; Schegloff, Jefferson, & Sacks, Reference Schegloff, Jefferson and Sacks1977). In cases where a sender presents a message for a receiver to understand and the receiver responds with a partial questioning repeat, this “other-initiated repair” could be perceived by the sender as an index of the receiver's nonunderstanding of the instruction. However, repetitions of speech tokens are not infrequent in everyday conversations (Schegloff, Reference Schegloff, Button and Lee1987) and partial questioning repeats are not used to exclusively convey insufficient understanding of repeated items in context.
Partial questioning repeats can be used to convey (and are perceived to convey) a range of different social actions, such as emphasis, humor, hearing issues, stalling, disagreement with repeated tokens, imitation, and are also used to indicate receipt of a message (Kim, Reference Kim2002; Norrick, Reference Norrick1987; Robinson, Reference Robinson, Hayashi, Raymond and Sidnell2013; Schegloff, Reference Schegloff1997; Tannen; Reference Tannen1987). Therefore, while there may be an assumption, within technical domains, that a partial readback reflects insufficient or inadequate understanding of the repeated tokens, the conversation analytic literature suggests partial readback can be a manifestation of many other issues in technical environments (such as excessive workload or simply a lack of adherenece to protocol on the part of the receiver). It is important to test this assumption empirically, as the readback procedure (i.e., the requirement of a full readback response) has been criticized as unnecessary and time consuming (Schneider, Healy, & Barshi, Reference Schneider, Healy and Barshi2004). If it is evident that a full readback does not provide a listener with evidence that the receiver has understood the instruction, additional supporting evidence may need to be considered in particular circumstances.
THE PRESENT STUDY
This study extended the relatively limited literature examining the relationship between auditory cues and perceptions of nonunderstanding within a readback/hearback context. Specifically, it capitalized on Auton et al. (Reference Auton, Wiggins, Searle, Loveday and Xu Rattanasone2013) in three critical ways. While Auton et al. used electricity transmission control as a context, this study assessed the utility of auditory cues during perceptions of nonunderstanding within the allied domain of hydroelectric power generation. This is a high-risk, high-consequence environment in which the force of falling or flowing water is used to generate electricity.
This study also differed from Auton et al. (Reference Auton, Wiggins, Searle, Loveday and Xu Rattanasone2013) by including an examination of the association between the amount of linguistic information contained within the readback response (full vs. partial readback) and perceptions of nonunderstanding. Of perhaps more theoretical and practical importance, the utility of prosodic cues during assessments of nonunderstanding was examined contingent upon the amount of linguistic content within the readback response.
Finally, this study incorporated a task whereby participants were asked concurrently to listen to communicative exchanges and read and recall a series of numeric digits. The addition of the concurrent task was designed to better reflect the cognitive demands in the operational environment. Referred to as the numeric digit span recall task, it was designed to impose a cognitive demand on participants, thereby restricting the cognitive resources available during assessments of nonunderstanding.
Research aim and hypotheses
The aim of the present study was to examine how both linguistic and prosodic cues embodied within a receiver's response to an instruction influenced perceptions of the extent to which a receiver had understood an instruction. It was hypothesized that full readback responses to instructions would receive higher ratings of understanding compared to partial readback responses according to Hypothesis 1 (H1). It was also predicted that full readback responses ending in rising intonation would attract lower ratings of understanding of the instruction, compared to readback responses ending in falling intonation Hypothesis 2a (H2a). Similarly, it was hypothesized that partial readback responses ending in rising intonation would receive lower ratings of understanding of the instruction compared to partial readback responses ending in falling intonation Hypothesis 2b (H2b).
For the prosodic cue “filler,” hypotheses were specified for the two durations of interturn delay to identify any interaction between delay and filler. It was hypothesized that full readback responses preceded by a filled delay of 600 ms would attract lower ratings of understanding of the instruction compared to full readbacks that were preceded by an unfilled delay of the same duration (H3a). Similarly, full readback responses preceded by a filled delay of 1200 ms were expected to attract lower ratings of understanding compared to full readbacks that were preceded by an unfilled delay of the same duration (H3b).
Partial readback responses preceded by a filled delay of 600 ms were expected to attract lower ratings of understanding of the instruction compared to partial readbacks that were preceded by an unfilled delay of 600 ms (H3c). Similarly, partial readback responses preceded by a filled delay of 1200 ms were predicted to attract lower ratings of understanding of the instruction compared to partial readbacks that were preceded by an unfilled delay of 1200 ms (H3d).
Although Auton et al. (Reference Auton, Wiggins, Searle, Loveday and Xu Rattanasone2013) failed to identify interturn delay as a salient cue used by network operators during perceptions of nonunderstanding of full readback responses, it was unclear whether interturn delay would be useful in a different domain and/or when the linguistic cue associated with a full readback was unavailable (i.e., during partial readback responses). Therefore, it was hypothesized that full readback responses that commenced after a longer (1200 ms) interturn delay would attract lower ratings of understanding of the instruction compared to full readback responses that commenced after a shorter (600 ms) interturn delay (H4a). Finally, it was predicted that partial readback responses that commenced after a longer (1200 ms) inteturn delay would attract lower ratings of understanding of the instruction compared to partial readback responses commencing after a shorter (600 ms) interturn delay (H4b).
Overview of methodology
This study was undertaken within the domain of hydroelectric power generation. The participants comprised hydroelectric power generation operators whose role is to monitor and diagnose system events through supervisory control and data acquisition visual interfaces and intervene where necessary to safeguard the supply of electricity. These operators were selected as they generally follow the readback/hearback procedure when communicating over the radio/telephone, and therefore, they represented a sample in which the utilization of linguistic and prosodic cues during perceptions of nonunderstanding could be examined with a degree of ecological validity.
In comparison to environments like aviation, where the readback protocol is adhered to consistently, adherence to full readbacks within hydroelectric power generation varies between organizations. In the hydroelectric domain, the communication process tends to be less formal and less structured, involving a combination of full and partial readbacks, depending upon organizational and task-specific circumstances.
Participants in this study were asked to listen to a series of scripted audio communicative exchanges through an online experimental platform. Each exchange included a sender delivering an instruction and a receiver responding with either a full or a partial readback. The readbacks varied systematically in the type of intonation heard at the end of the response, the presence of a filler before the commencement of the response, and the duration of the interturn delay between speakers. After listening to each exchange, participants were asked to indicate the extent to which they perceived that the receiver (who delivered the full or partial readback) had understood the instruction.
METHOD
Participants
The participants were recruited from either online advertisements within a major US power generation magazine that has subscribers worldwide or through direct contact using a major hydroelectric power generation company in New Zealand. A total of 34 operators completed the study, although 6 were subsequently excluded because they were not currently working within the field of hydroelectric power generation nor had they reported any experience within this specialized field. As this study was completed online and in participants’ own time, all of the demographic data was provided via self-report.
Twenty-eight hydroelectric power generation operators from companies worldwide participated in the study. Overall, an equal proportion of participants were from the United States (35.7%) and New Zealand (35.7%), with the remaining participants residing in various countries including England, Australia, Italy, and Croatia. The sample was predominantly male (92.9%), ranged in age from 29 to 74 years (M = 51.96, SD = 8.89), and had accumulated between 4 and 44 years of experience within power generation (M = 25.13, SD = 11.02). Within the specialized field of hydroelectric power generation, participants had accumulated between 2 and 44 years of experience (M = 20.32, SD = 11.34).
Before participants commenced the online study, they were advised in writing that only proficient English speakers should complete the study due to the challenging nature of the tasks. Participants were asked to self-report their native language and the number of years they had been speaking English. The majority of the sample identified as native English speakers (85.7%). Of the four participants who identified as nonnative English speakers, the least experienced nonnative English speaker had been speaking English for 43.48% of his life, and the most experienced nonnative English speaker had been speaking English for 75.47% of his life. Participants received a US $25 Amazon eVoucher in exchange for their completion of the study.
Materials
The auditory readback task, incorporating the numeric digit span recall task, was created to assess the extent to which particular prosodic and linguistic cues influenced participants’ perceptions of nonunderstandings while listening to a series of readback/hearback exchanges.
Auditory readback task
DESIGN
The auditory readback task comprised a 2 × 2 × 2 × 2 × 2 (Communicative Exchange [1, 2] × Instruction Response Type [full readback, partial readback] × Final Intonation [rising, falling] × Filler [present, absent] × Interturn Delay [shorter, longer]) repeated measures, within-subjects design. This resulted in 32 distinct communicative exchange conditions to which participants listened in random order.
After listening to each exchange, participants were asked to rate, on a 7-point Likert scale from 1 (did not understand at all) to 7 (understood completely), the extent to which they perceived that the receiver, who uttered the readback response, had understood the meaning of the instruction. This type of scale was consistent with Brennan and Williams’ (Reference Brennan and Williams1995) measure of perceptions of uncertainty and Auton et al.’s (Reference Auton, Wiggins, Searle, Loveday and Xu Rattanasone2013) measure of perceptions of nonunderstanding. These ratings represented the dependent variable.
The design incorporated two, semantically distinct communicative exchanges to ensure that the semantic content of the exchanges did not influence prosodic cue use, and thus, were used as replicates of the other auditory cue conditions to ensure a more robust design. Each communicative exchange consisted of a sender delivering an operational instruction to a receiver and a receiver responding to the instruction. These two communicative exchanges differed in the type of operational tasks that the sender requested the receiver to execute.
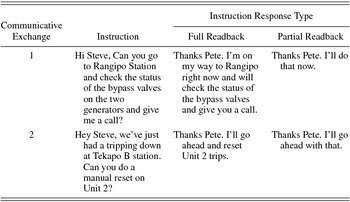
“Instruction response type” referred to the nature of the response to the operational instruction in each of the two communicative exchanges, where the receiver responded with either a full readback (i.e., the entire message was repeated back to the sender) or a partial readback (i.e., the receipt of the instruction was acknowledged but the operational steps were not repeated). “Final intonation” referred to whether the receiver's readback response ended in either a rising intonation or a falling intonation. “Filler” referred to the presence of a verbal interjection (i.e., um) prior to the commencement of the response. Finally, “interturn delay” referred to whether the delay between the sender delivering the instruction and the receiver responding was shorter (600 ms) or longer (1200 ms).
Stimuli development
COMMUNICATIVE EXCHANGES
The semantic content of the two communicative exchanges was developed in consultation with two subject matter experts from a major hydroelectric power generation company in New Zealand. Each exchange consisted of an instruction that was likely to occur within the hydroelectric power generation industry, specifying the operational steps to be executed by the receiver, together with a response (either a full readback or a partial readback; see Table 1).
Semantic content of the communicative exchanges

The auditory versions of the communicative exchanges were recorded by two Australian English male speakers using a digital audio editor program (GarageBand™) on a MacBook laptop. One speaker assumed the role of the sender, who delivered the instruction in both exchanges, and the other speaker assumed the role of the receiver, who delivered the instruction responses associated with both exchanges. Speakers maintained their allocated roles as either sender or receiver across both exchanges to prevent differences in voice timbre from influencing perceptions of nonunderstanding. The duration of the communicative exchanges (including both the instruction and response) ranged from 10 to 13 s.
Prosodic manipulation of instruction response types
The instruction response portion of each communicative exchange was manipulated to vary systematically the type of intonation at the end of the response, whether the receiver used a filler (i.e., um) before responding to the instruction, and the duration of the interturn delay between the offset of the sender's instruction and the onset of the receiver's readback response.
Final intonation
To generate responses that ended with either rising or falling intonation, the speaker who played the role of the receiver was instructed to end the response token with either rising or falling intonation. A manipulation check was conducted to validate that the intonation contours produced by the male speaker were perceived as intended (i.e., ending with either rising or falling intonation). The participants included 11 postgraduate students from an Australian University who were all native English speakers, predominantly female (81.82%), and ranged in age from 23 to 49 years (M = 32.09, SD = 8.37).
The participants accessed the study through an online survey, where they were asked to listen to the instruction response tokens of each exchange and decide whether the receiver used rising or falling intonation at the end of each response token. The participants listened and responded to a total of 16 instruction response tokens; 8 full readbacks (4 × Communicative Exchange 1, 4 × Communicative Exchange 2) and 8 partial readbacks (4 × Communicative Exchange 1, 4 × Communicative Exchange 2). Half of the instruction responses ended in rising intonation and half in falling intonation. The results indicated that participants were able to correctly identify rising and falling intonation at the end of full readback response tokens with 100% accuracy. For partial readback response tokens, participants were able to correctly identify rising and falling intonation with an accuracy rate of 97.7% and 95.45%, respectively.
Filler
The receiver's response was preceded by either a filled interturn delay (i.e., the duration between the sender's instruction and receiver's response contained silence as well as the filler um) or an unfilled interturn delay (i.e., the duration between the sender's instruction and the receiver's response was silent). The male speaker who played the role of the receiver was recorded several times producing the filler um. One instance of the filler um was selected based on its duration (400 ms) and timbre, and was used across all filled interturn delays to maintain consistency. The filler was then digitally inserted within an interturn delay of 600 ms (100 ms silence, um [400 ms], 100 ms silence) and 1200 ms (700 ms silence, um [400 ms], 100 ms silence).
Interturn delay
Although Auton et al. (Reference Auton, Wiggins, Searle, Loveday and Xu Rattanasone2013) examined whether the prosodic cues reportedly perceived as useful during perceptions of uncertainty by Brennan and Williams (Reference Brennan and Williams1995) were also useful during perceptions of nonunderstanding in a readback context, they did not incorporate the same interturn delay durations used by Brennan and Williams. While Brennan and Williams used delays of 1000 ms (“short” delay) and 5000 ms (“long” delay) between speakers, Auton et al. argued that these durations would be perceptually unrealistic within technical domains and threaten the ecological validity of their study. Instead, Auton et al. examined the role of interturn delay on perceptions of nonunderstanding using four distinct delay durations: –300 ms (i.e., a 300 ms portion of overlapping speech between the end of the instruction and the beginning of the readback), 300 ms, 600 ms, and 1200 ms. These durations had been shown to be perceptually relevant to listeners during problematic everyday communication (Roberts et al., Reference Roberts, Francis and Morgan2006; Shimojima, Katagiri, Koiso, & Swerts, Reference Shimojima, Katagiri, Koiso and Swerts2002).
Auton et al. (Reference Auton, Wiggins, Searle, Loveday and Xu Rattanasone2013) found no relationship between interturn delay durations and perceptions of nonunderstanding and suggested that this could be due to one of two reasons: (a) the interturn delay durations tested were not long enough to signal difficulty during communicative exchanges within the electricity transmission domain or (b) any type of interturn delay is not perceptually relevant in technical environments due to other attributable causes of delay (e.g., technical difficulties or air congestion). Although it may be that tolerance for interturn delay is greater within operational environments compared to everyday social interactions (where a delay of approximately 1 s, sometimes even less, is needed to signal problematic communication to listeners; Davidson, Reference Davidson, Atkinson and Heritage1984; Jefferson, Reference Jefferson, Roger and Bull1989, Kendrick & Torreira, Reference Kendrick and Torreira2015; Nevile & Walker, Reference Nevile and Walker2005), relatively conservative interturn delay intervals of 600 and 1200 ms were maintained in the present study.
The selection of these two interturn delay durations for this study was twofold. First, even though Auton et al. (Reference Auton, Wiggins, Searle, Loveday and Xu Rattanasone2013) suggested that future studies should test longer interturn delay durations in technical environments, their study was designed to examine the effect of interturn delay durations only within full readback responses. It may be that salient interturn delay durations demonstrated within social interactions (>1000 ms) only become important within technical environments when linguistic evidence of understanding is absent (i.e., during partial readback responses). Second, the work by Roberts and colleagues suggest that the incremental increase of a 600 and 1200 ms interturn delay between speakers affects perceptions of willingness to comply with friendly requests (Roberts & Francis, Reference Roberts and Francis2013; Roberts et al., Reference Roberts, Francis and Morgan2006; Roberts, Margutti, & Takano, Reference Roberts, Margutti and Takano2011).
As the contrast between the interturn durations of 600 ms and 1200 ms appears to affect perceptions of willingness to comply with a request, it was hypothesized that the same durations could also affect perceptions of nonunderstanding within a more operational context where the instruction involved a request. To create interturn delays of either a shorter (600 ms) or a longer (1200 ms) duration, artificial silences of the two durations were electronically inserted, using the digital audio editor program GarageBand, between the offset of the sender delivering the instruction and the onset of the receiver's response.
Numeric digit span recall task
The auditory readback task was designed to assess associations that operators have developed between auditory cues and the extent to which they perceive that a speaker has understood an instruction. Operators who have developed refined associations between auditory cues and instances of nonunderstanding are presumed to access these associations, even when cognitive resources are limited. In contrast, operators who have not developed such associations in long-term memory rely more heavily on working-memory processing to determine the meaning of the auditory cues and are more hindered when cognitive resources are limited (Coderre, Mandin, Harasym, & Fick, Reference Coderre, Mandin, Harasym and Fick2003; Sweller, Reference Sweller1988).
It was important to devise a task that would restrict participants’ cognitive resources while listening to the communicative exchanges, as this is typical of the real-life operational context. However, it was also important to ensure that it did not impose such a load that it prevented participants from attending to the exchanges altogether. The numeric digit span recall task was incorporated into the auditory readback task, and required participants to remember a series of eight single numeric digits that were visually displayed for the duration of each communicative exchange (see Figure 1). Each series of numeric digits included numerals from one to nine in a randomized order for each exchange, with no repetition of digits. After each communicative exchange was completed, the series of numeric digits disappeared, and participants were asked to type in the digits in an open response box. They were then asked to rate the perceived level of nonunderstanding on the subsequent page.
The visual presentation of the auditory readback task and the numeric digit span recall task.

Because working memory is capacity limited (Miller, Reference Miller1956), a manipulation check was conducted with postgraduate students from an Australian University to ensure that a string of eight numeric digits (compared to a string of four or six numeric digits) would restrict cognitive resources but not to an extent that it would deprive participants of the resources necessary to attend to the communicative exchanges. The results of the manipulation check confirmed such a hypothesis. In total, the auditory readback task required participants to listen and respond to 34 communicative exchanges presented in randomized order: 2 practice items and 32 communicative exchanges.
Procedure
The participants were invited to take part in the study either by E-mail to operators within the New Zealand power generation company or through an online advertisement published in a major US power generation magazine. Through both sources, participants were directed to the domain address where they were able to access the study. They completed a number of brief demographic items that ascertained their years of experience within the domain as well as the extent to which they give/receive instructions over the telephone/radio in their position. The auditory readback task took approximately 20 min to complete.
RESULTS
Data reduction
For the auditory readback task, participants recorded a single rating of their assessment of the receiver's level of understanding of the instruction for each of the 32 communicative exchanges along a 7-point Likert scale, from 1 (did not understand at all) to 7 (understood completely).
Numeric digit span recall task manipulation
Immediately prior to rating the receiver's level of understanding, the numeric digit span recall task required participants to type in the eight, single digits that were visible on the screen for the duration of auditory communicative exchange. As the aim of this task was to restrict participants’ cognitive resources while listening to the communicative exchange, it was only appropriate to include ratings of understanding for an exchange where participants made an attempt to recall at least one of the eight digits. This method was selected as it ensured that participants were ascribing at least some cognitive resources to the secondary task, rather than focusing entirely on listening to the communicative exchanges. Of the 28 participants who were asked to respond to a total of 32 response items each, there were four instances where a participant failed to make an attempt to recall any of the numeric digits associated with a communicative exchange. Rather than removing these data points, the grand mean across participants for that particular auditory variable was substituted.
Native language as a covariate
Prior to testing differences in perceptions of nonunderstanding at a cohort level, it was important to establish whether participants’ native language influenced their responses to the dependent variables. Independent samples t tests were undertaken with native language as the grouping variable (native language: English, other) and the aggregated ratings of understanding for each linguistic and prosodic cue as the dependent variables. As there were no statistically significant differences between native English speakers and nonnative English speakers’ ratings of prosodic and linguistic cues for levels of understanding (p > .05), native language was not included as a covariate in subsequent analyses.
Analyses of hypotheses
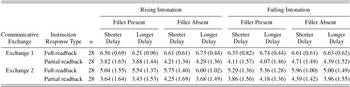
The data were analyzed using a 2 × 2 × 2 × 2 × 2 (Communicative Exchange [1, 2] × Instruction Response Type [full readback, partial readback] × Final Intonation [rising, falling] × Filler [present, absent] × Interturn Delay [shorter, longer]) within-subjects, repeated measures analysis of variance (ANOVA). The dependent variable comprised the ratings of level of understanding attributed to the receiver on a 7-point Likert scale. As several researchers have shown that Likert scales can be used effectively as interval data (e.g., Baggaley & Hull, Reference Baggaley and Hull1983; Carifio & Perla, Reference Carifio and Perla2007; Maurer & Pierce, Reference Maurer and Pierce1998), thus fulfilling the assumptions of ANOVA, the use of a repeated measures ANOVA was appropriate for the analyses undertaken in this study. Although a factorial analysis was used to reduce the risk of a Type 1 error, planned contrasts were used to assess the hypotheses. See Table 2 for mean ratings of understanding for each of the 32 conditions.
Mean (standard deviation) ratings of understanding as a function of auditory cue condition

Communicative exchange was included as a variable in the design of this study as a manipulation check to ensure that auditory cue use was not contingent on the semantic content of a particular communicative exchange. Although the two-level variable of communicative exchange (Exchange 1, Exchange 2) was not formally predicted to have an effect on ratings of understanding, a main effect was evident, F (1, 27) = 55.47, p < .001, ηp 2 = 0.67. This indicates that when participants heard the receiver read back the instruction from the first exchange, the receiver was perceived to have a greater level of understanding of the instruction (M = 5.36, SE = 0.14) in comparison to the readback from the second exchange (M = 4.71, SE = 0.18). Therefore, participants ascribed different levels of understanding to the receiver, depending upon the semantic content included in each of the two exchanges.
Based on this main effect, the interactions between communicative exchange and each of the auditory cues (instruction response type, final intonation, filler, and interturn delay) were examined to establish whether prosodic and linguistic cue use was contingent upon the semantic content of the exchange. While there was no significant interaction between communicative exchange and any of the prosodic cues: final intonation, F (1, 27) = 0.71, p = .405, ηp 2 = 0.03; filler, F (1, 27) = 0.00, p = .989, ηp 2 = 0.00; nor interturn delay, F (1, 27) = 1.28, p = .268, ηp 2 = 0.05, a statistically significant interaction was evident between communicative exchange and instruction response type, F (1, 27) = 23.34, p < .001, ηp 2 = 0.46. As these findings suggest that the importance of instruction response type during perceptions of nonunderstanding is related to the semantic content of a communicative exchange, the variable communicative exchange was included in the analyses relating to H1.
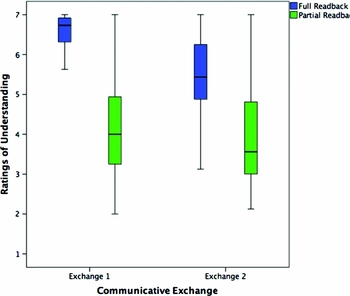
To examine the first hypothesis, the statistically significant interaction between communicative exchange and instruction response type was further investigated. The simple main effects analysis using a Bonferroni adjustment indicated that there was a statistically significant difference for ratings of understanding ascribed to the use of full and partial readbacks, for both Communicative Exchange 1 (p < .001) and Communicative Exchange 2 (p < .001; see Figure 2). This suggests that receivers who responded to an instruction with a full readback were rated as having a greater level of understanding of the instruction (for both communicative exchanges: Exchange 1, M = 6.55, SE = 0.09; Exchange 2, M = 5.49, SE = 0.18), compared to receivers who responded to an instruction with a partial readback (for both communicative exchanges: Exchange 1, M = 4.16, SE = 0.24; Exchange 2, M = 3.92, SE = 0.24). While the statistically significant interaction suggests that there is a greater difference in ratings of understanding between full and partial readbacks for Exchange 1 compared to Exchange 2, a statistically significant difference was recorded between full and partial readbacks for both exchanges, thereby providing support for H1.
This boxplot illustrates the significant two-way interaction between instruction response type and communicative exchange on ratings of understanding. The first and second box clusters display a significant simple main effect of instruction response type for Exchange 1 and Exchange 2 for ratings of understanding. Each box contains the middle 50% of scores for that variable, where the relatively thicker horizontal line within each box represents the median value. The upper and lower whisker specifies the top and bottom 25% of scores, respectively, excluding outliers. The short horizontal lines at the end of each whisker represent the maximum and minimum observation for each variable.

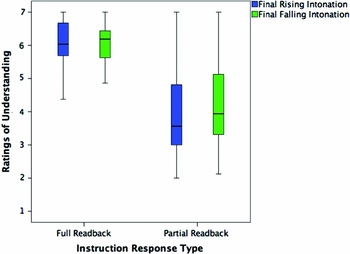
To examine the second set of hypotheses, the interaction between instruction response type and final intonation was investigated further. A statistically significant, two-way interaction was evident, F (1, 27) = 13.05, p = .001, ηp 2 = 0.33, suggesting that the influence of the type of final intonation on ratings of understanding differed for full and partial readback responses (see Figure 3). Subsequent main effects analysis using a Bonferroni adjustment indicated that there was a statistically significant difference in ratings of understanding for the type of intonation used at the end of partial readback responses (p = .001), where this effect was not evident for full readback responses (p = .459). This suggests that partial readbacks that ended with rising intonation attracted a lower mean rating of understanding (M = 3.88, SE = 0.25) compared to partial readbacks that ended with falling intonation (M = 4.21, SE = 0.23), providing support for H2b. In contrast, regardless of whether a full readback ended with rising (M = 6.05, SE = 0.12) or falling (M = 5.99, SE = 0.13) intonation, ratings of understanding did not differ, thereby failing to provide support for H2a.
This boxplot illustrates the significant two-way interaction between instruction response type and final intonation on ratings of understanding. The second box cluster displays a significant simple main effect of intonation within partial readback responses for ratings of understanding. Each box contains the middle 50% of scores for that variable, where the relatively thicker horizontal line within each box represents the median value. The upper and lower whisker specifies the top and bottom 25% of scores, respectively, excluding outliers. The short horizontal lines at the end of each whisker represent the maximum and minimum observation for each variable.

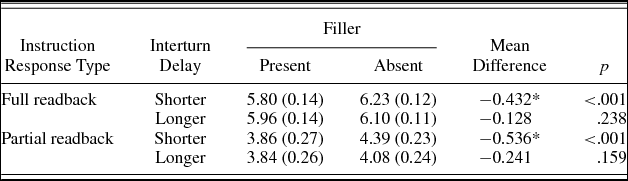
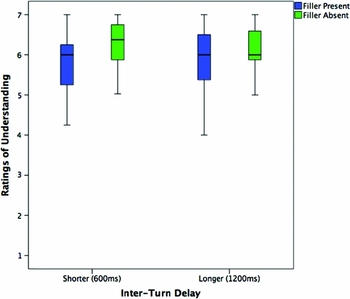
The third set of hypotheses examined whether the presence of a filler affected ratings of understanding when contained within a shorter or longer interturn delay for both full and partial readbacks. To assess these hypotheses, simple main effects analysis of the three-way interaction was conducted between instructional response type, filler, and interturn delay using a Bonferroni adjustment, and the specific comparisons relating to the hypotheses were inspected. See Table 3 for the means, standard errors, and p values for the simple main effects analysis. For readback responses that were preceded by a shorter delay, lower ratings were ascribed when the receiver used a filler (M = 5.80, SE = 0.14), compared to statements where no filler was used (M = 6.23, SE = 0.12; p < .001). This outcome provides support for H3a. For readback responses that were preceded by a longer delay, the use of a filler did not affect ratings of understanding ascribed to the part of the speaker (p = .238), thereby failing to provide support for H3b. See Figure 4 for the pictorial representation of H3a and H3b.
Summary of the mean (standard error) ratings of understanding and significance values for the interactions among instruction response type, filler, and interturn delay

*p = .05. The mean difference is significant at this level with Bonferroni adjustments for multiple comparisons.
This boxplot represents the relationship between interturn delay and filler contained within full readback responses. The first box cluster displays a significant simple main effect for filler on ratings of understanding when contained within a shorter interturn delay. Each box contains the middle 50% of scores for that variable, where the relatively thicker horizontal line within each box represents the median value. The upper and lower whisker specifies the top and bottom 25% of scores, respectively, excluding outliers. The short horizontal lines at the end of each whisker represent the maximum and minimum observation for each variable.

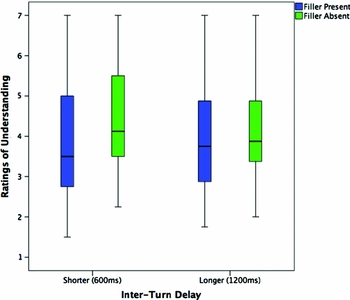
For partial readback responses that were preceded by a shorter delay, the use of a filler was associated with a lower mean rating of perceived understanding (M = 3.86, SE = 0.27) compared to statements where a filler was not used (M = 4.39, SE = 0.23; p < .001), thereby providing support for H3c. For partial readback responses that were preceded by a longer delay, the use of a filler did not affect ratings of understanding ascribed to the part of the speaker (p = .159), failing to provide support for H3d. See Figure 5 for the pictorial representation of H3c and H3d. Overall, fillers were useful during perceptions of understanding when they preceded both full and partial readbacks, but only when contained within a shorter interturn delay of 600 ms.
This boxplot represents the relationship between interturn delay and filler contained within partial readback responses. The first box cluster displays a significant simple main effect for filler on ratings of understanding when contained within a shorter interturn delay. Each box contains the middle 50% of scores for that variable, where the relatively thicker horizontal line within each box represents the median value. The upper and lower whisker specifies the top and bottom 25% of scores, respectively, excluding outliers. The short horizontal lines at the end of each whisker represent the maximum and minimum observation for each variable.

For the fourth set of hypotheses, the simple main effects analysis of the three-way interaction between instruction response type, filler, and interturn delay was also inspected, using a Bonferroni adjustment for multiple comparisons. The two-way interaction between instruction response type and interturn delay was not examined as “delay” would be collapsed across the different levels of the variable filler, introducing a potential confound as the fillers were preceded by different durations of silence. There was no statistically significant difference in ratings of understanding when a longer interturn delay preceded a full readback (M = 6.23, SE = 0.12), compared to a shorter interturn delay that preceded a full readback (M = 6.09, SE = –0.11), p = .080, thereby failing to provide support for H4a. In contrast, when a longer interturn delay preceded a partial readback, the receiver was rated with a relatively lower level of understanding of the instruction (M = 4.39, SE = 0.23), compared to a shorter interturn delay preceded a partial readback (M = 4.08, SE = 0.24; p = .033). This outcome provides support for H4b.
DISCUSSION
Summary of findings
The overall aim of the present study was to investigate the role of linguistic (namely, a full or partial readback) and prosodic (namely, final intonation, filler, and interturn delay) cues in hydroelectric power generation operators’ perceptions of nonunderstanding in simulated readbacks/hearback exchanges. Consistent with H1, the amount of linguistic information contained within an instruction response was associated with a receiver's perceived state of understanding. Specifically, when a response contained a full readback, operators perceived a greater level of understanding on the part of the receiver compared to an instruction with a partial readback.
An interaction between communicative exchange and instruction response type highlighted that the difference in assessments for full and partial readbacks was greater when participants listened to the first, compared to the second communicative exchange. This suggests that the weight that a listener placed on the type of response depended upon the semantic content of the exchange. The importance of semantic information during perceptions of nonunderstanding was also highlighted by the different ratings that participants ascribed to the two different semantic exchanges. This suggests that, controlling for all other linguistic and prosodic variables, operators perceived the speakers to have different levels of understanding of the instruction, based on semantic content of the exchange.
In final intonation, it appeared only perceptually relevant when heard at the end of partial readback responses (H2b). Specifically, when listeners heard speakers use rising intonation at the end of a partial readback response, listeners perceived that speakers held a lesser level of understanding of the instruction, compared to the use of a falling intonation. This effect of intonation was not evident for full readback responses, failing to provide support for H2a.
The utility of a filler as a prosodic cue was evident during perceptions of nonunderstanding when preceding both a full and a partial readback. However, it was only salient to listeners when contained within the shorter (600 ms) rather than longer (1200 ms) interturn delay. This pattern of results provides support for H3a and H3c, respectively. Because a filler did not affect perceptions of understanding when contained within the longer delay for either full or partial readbacks, no support was evident for H3b and H3d, respectively.
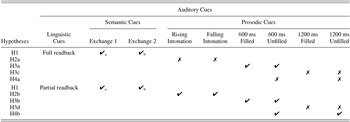
Summary of results with accompanying hypotheses

Note: The presence of two adjacent checkmarks indicates that the mean difference between the two variables was significant and therefore provided support for the corresponding hypothesis. The presence of two adjacent cross symbols indicates that the mean difference between the two variables was not significant and therefore did not support the corresponding hypothesis. For H1 only, the checkmarks with corresponding subscripts represent the mean differences being compared.
Interturn delay was only perceived as useful during assessments of understanding when exchanges contained partial readbacks. Specifically, a lower level of understanding was associated with a partial readback preceded by the longer interturn delay, in comparison to the shorter delay (consistent with H4b). No effect was evident for interturn delay when it preceded a full readback (inconsistent with H4a). See Table 4 for a summary of findings.
Salience of auditory cues during perceptions of nonunderstanding
Overall, the pattern of results from this study suggest that not all auditory cues are assigned the same level of importance when listeners are making judgments about speakers’ levels of understanding. In some circumstances, it was only in the absence of one cue that the presence of another cue became perceptually important to listeners. In other circumstances, the presence of one cue enhanced the salience attributed to another cue when judging a speaker's state of understanding.
Three key findings point to a potential hierarchy of auditory cues used during perceptions of nonunderstanding in the context of readbacks. First, the importance ascribed to the type of instruction response (full or partial readback) on ratings of understanding was greater for the semantic content of Exchange 1 compared to Exchange 2. This suggests that listeners take into consideration the semantic content of the exchange before relying on the type of readback response to make judgments of understanding.
Second, final intonation and interturn delay only became perceptually relevant to listeners when there was relatively less linguistic content evident in the readback response. This suggests that listeners rely more heavily on the linguistic content of a readback response over prosodic cues, and it is only in the absence of such rich content (i.e., during a partial readback response) that the prosodic cues of final intonation and interturn delay are engaged in assessments of nonunderstanding.
Third, although a filler was an important prosodic cue during both full and partial readbacks, it was only employed when the delay was relatively short between speakers. For example, a filler was only perceptually relevant when contained within shorter (600 ms) delays preceding both full and partial readbacks. During longer delays, the importance of a filler as an indicator of a speaker's understanding diminished. Not only is this indicative of a hierarchy, but it also suggests that the basis for this hierarchy may be the perception of a potential cause of a nonunderstanding where a filler (in the absence of delay) signals something about the cognitive state of a speaker (such as speech planning; Clark & Fox Tree, Reference Clark and Fox Tree2002) whereas the use of a delay suggests something more problematic in relation to a speaker's state of understanding.
The notion that listeners ascribe different diagnostic values to auditory cues when assessing speakers’ levels of understanding is not particularly surprising. For instance, Brennan and Williams’ (Reference Brennan and Williams1995) investigation into perceptions of uncertainty within a “trivia” game setting hinted at a particular preference to place greater weight on interturn delay, when a speaker's response ended in falling, rather than the more salient, rising intonation (Experiment 2). Of particular interest in the present study was how the semantic content of the communicative exchanges influenced perceptions of understanding. The notion that semantic content influences perceptions of understanding is not surprising, but it was primarily intended as a manipulation check. This decision was based on the relatively consistent ratings across the two communicative exchanges in Auton et al. (Reference Auton, Wiggins, Searle, Loveday and Xu Rattanasone2013), but it could simply be that these exchanges were more semantically homogeneous than the exchanges incorporated in the present study.
In considering the semantic content in future research, one element that might be considered is the complexity of the tasks requested by the sender. In their examination of over 50 hr of air traffic control and pilot exchanges from five airports in the United States, Prinzo et al. (Reference Prinzo, Hendrix and Hendrix2006) noted that, as the complexity and message length of controller's instruction increased, so did the frequency of readback errors made by pilots. The instruction contained within the first exchange in this study was more complex (based on the number of elements it contained; Prinzo et al., Reference Prinzo, Hendrix and Hendrix2006) compared to the instruction within the second exchange, which may have led listeners to perceive that speakers were less likely to have understood an instruction that was more complex when there was no linguistic evidence to confirm understanding. Although it is important to note that there was no relationship between semantic content and prosodic cues in this study, future research will need to consider this relationship more closely.
Implications for practice
One of the notable findings of this study was how the amount linguistic information contained within a readback response was used to establish common ground. This suggests that in practice, operators who have heard an instruction correctly but who fail to understand it have the capacity to conceal their lack of understanding through the use of an accurate readback. Nevertheless, replacing the full readback requirement with an acknowledgment (such as affirmative) is not necessarily the solution to curtail the potential for concealed nonunderstandings during radio communication.
The readback requirement is critical insofar as it provides the sender with an opportunity to monitor the accuracy of a receiver's readback, thereby reducing errors of mishearing (Schneider et al., Reference Schneider, Healy and Barshi2004). Moreover, a partial readback response in lieu of a full readback does not necessarily denote a lack of understanding on the part of the receiver. It may occur for other reasons, such as elevated workload or a time constraint (Cushing, Reference Cushing1994). Therefore, the outcomes of the present study simply suggest that operators should not rely solely on a full readback as evidence of a receiver's understanding during the grounding process. Operators could be trained to consider both an accurate readback and the specific prosodic cues contained with a readback when judging a receiver's state of understanding, particularly during high-risk maneuvers.
Consistent with previous research in the context of uncertainty (Brennan & Williams, Reference Brennan and Williams1995), prosodic cues differed in their association with perceptions of nonunderstanding. Specifically, shorter filled delays influenced perceptions of nonunderstanding during full readback responses, while final intonation, shorter filled delays, and unfilled delays influenced perceptions of nonunderstanding during partial readback responses. These results are not entirely consistent with Auton et al. (Reference Auton, Wiggins, Searle, Loveday and Xu Rattanasone2013), who found that, during full readback responses, both final intonation and filled delays (both shorter and longer) were used by operators to gauge a receiver's level of understanding. This discrepancy could be accounted for by slight methodological variations between the two studies.
In the present study, operators were asked to make judgments of understanding on both full and partial readbacks, whereas Auton et al. (Reference Auton, Wiggins, Searle, Loveday and Xu Rattanasone2013) only presented full readbacks to participants. As a result, the participants in Auton et al. were assessing responses that did not vary in the amount of linguistic information available, nor did they have full readbacks to contrast against partial readbacks. This prevented any investigation as to whether the use of prosodic cues differed according to the amount of linguistic information available. The results of the present study suggest that participants use final intonation and interturn delay as an important cue during perceptions of understanding, but only when linguistic information from a full readback is unavailable.
Although Auton et al. (Reference Auton, Wiggins, Searle, Loveday and Xu Rattanasone2013) reported that the duration of the interturn delay between speakers is not a useful prosodic cue for operators during perceptions of nonunderstanding during full readback responses, interturn delay was included in the present study to investigate whether it became useful to operators within a different domain and/or when the linguistic information of a full readback was unavailable. Consistent with Auton et al., the results demonstrate that the length of interturn delay that preceded a full readback did not affect ratings of understanding on the part of the speaker.
It was evident that interturn delay was a salient cue to operators when it preceded a partial readback response, suggesting a propensity to use this cue in the absence of any linguistic evidence of understanding. This pattern of results for interturn delay is not entirely consistent with the communicative literature that suggests a delay of 1 s, sometimes less, is perceived as signalling difficulties in everyday social communications (Davidson, Reference Davidson, Atkinson and Heritage1984; Jefferson, Reference Jefferson, Roger and Bull1989, Kendrick & Torreira, Reference Kendrick and Torreira2015; Roberts & Francis, Reference Roberts and Francis2013; Roberts et al., Reference Roberts, Francis and Morgan2006). The outcomes suggest that the tolerance for delay in operational contexts is greater when there is linguistic evidence of understanding (i.e., the presence of a full readback). However, when this evidence is absent (i.e., during partial readbacks), an interturn delay duration of over 1 s becomes indicative of trouble in communication, which is consistent with the threshold of delay in everyday social communicative exchanges.
Limitations and future research
There were three main limitations in this study. First, perceptions of nonunderstanding were not made by a participant within the communicative exchange, but rather, by a third-party participant listening to the exchange. This process is distinct from actual operational communication, where the sender is responsible for speaking when issuing instructions to the receiver, in addition to monitoring the readback for accuracy. There is evidence to suggest that the cognitive demands inherent in speaking can contribute to speakers overestimating their communication effectiveness (Keysar & Henly, Reference Keysar and Henly2002). This suggests that real-life senders may be less likely to perceive a communication error should this occur within the operational context.
To control for cognitive demands, participants in the present study were asked to retain a series of eight numeric digits in memory while listening to each exchange. Although future research is needed to establish whether perceptions of nonunderstandings differ between operators involved in an exchange and third-party listeners, the outcomes demonstrated that, under the cognitive load imposed by a secondary task, instruction response type, final intonation, filler, and interturn delay constitute important auditory cues attended to by hydroelectric power generation operators to gauge a receiver's level of understanding during responses to instructions.
Second, there was no investigation as to whether linguistic and prosodic cues incorporated within an instruction response were sufficiently salient to motivate operators to ensure that the instruction had been properly understood. It is important for future research to establish the practical relevance of these auditory cues to determine whether these critical semantic, linguistic, and prosodic cues influence not only operators’ perceptions of nonunderstanding on the part of the receiver but also their behavior subsequent to the receipt of such information (such as clarifying the instruction). Considering the relatively small effect sizes obtained in this study, it may be that the receipt of a readback response must contain a combination of critical cues (such as a partial readback, preceded by a filler, and ending in rising intonation) rather than a singular cue, to have any practical significance to operators during real-life experiences. The outcomes of such research could help inform tailored, cue-based learning approaches to assist the recognition of nonunderstandings on the part of the sender, thereby improving performance at the operational level.
Learning approaches that have focused on the training of critical cues have been successful in improving cue detection in a variety of industries, including aviation (Wiggins & O'Hare, Reference Wiggins and O'Hare2003), sport (Smeeton, Williams, Hodges, & Ward, Reference Smeeton, Williams, Hodges and Ward2005), organizational settings (Gary & Wood, Reference Gary and Wood2011), and general medicine (Litchfield, Ball, Donovan, Manning, & Crawford, Reference Litchfield, Ball, Donovan, Manning and Crawford2010). The results arising from the present study might provide a framework to direct the development of a cue-based learning approach in the auditory domain.
Third, there were two methodological limitations present in this study. The first is that while the 32 communicative exchanges were presented to participants in a randomized order, due to limitations inherent within the software used to conduct this research, the order was the same for each participant. Although Auton et al. (Reference Auton, Wiggins, Searle, Loveday and Xu Rattanasone2013) noted the same limitation, it may be that a potential learning effect influenced ratings of understanding as the study progressed. The second methodological limitation was the relatively small (n = 28) sample size. A strength of this study was the use of actual domain operators within hydroelectric power generation, but the sample size potentially limits the generalizability of the findings within or across domains. It also raises the possibility that the importance of, or between, auditory cues on perceptions of nonunderstanding went undetected, or that some spurious findings were detected. These concerns should be addressed with a larger operational sample in future studies.
The outcomes of this study were important insofar as they identified auditory cues that could potentially improve the recognition of nonunderstandings in the context of readback responses. It is unclear, however, whether operators could use the same cues to detect instances of misunderstanding that also frequently occur within technical environments (Billings & Reynard, Reference Billings, Reynard, Billings and Cheaney1981; Morrow et al., Reference Morrow, Rodvold and Lee1994). Within the domain of aviation, for example, Jones (Reference Jones2003) suggests that all runway incursions are evidence of misunderstandings, with more than 300 occurrences each year in the United States. Therefore, future research should address the cues associated with the identification of misunderstandings during readback exchanges.
Conclusion
Using an international sample of hydroelectric power generation operators, it was established that a shorter filled delay preceding a full readback response, and a shorter filled delay, final intonation, and interturn delay, when contained within partial readback responses, are important prosodic cues used during perceptions of nonunderstanding. The semantic content of the communicative exchange also affected perceptions of nonunderstanding and influenced the extent to which a full or partial readback response affected ratings of nonunderstanding. The outcomes of this study have implications for training and system design in technical environments.