Faye Brown was convicted of felony murder when a 1975 bank robbery resulted in the death of a law enforcement officer. Though she sat in the front seat on the passenger side of a car while a gunman in the back seat shot and killed a state trooper, a jury convicted and sentenced her to death. A court eventually resentenced Faye to life with parole. Over time, Faye grew past the sense of worthlessness that life in prison yields, accepting responsibility for her crime. During her forty-five years of incarceration, Faye mentored many women and provided kindness, generosity, leadership, and a shoulder to cry on. She worked various jobs within the prison and earned her way into the state’s work-release program.
After thirty years of incarceration, Faye lived a seemingly normal life on the outside, working full-time at a cosmetology school and returning to prison at night. On weekend passes, she stayed with family members who loved and supported her (Aspinwall, Blakinger, and Neff Reference Aspinwall, Blakinger and Neff2020). By every standard, Faye was fully rehabilitated and virtually reintegrated with society. At the age of fifty-seven, she had a realistic chance of earning freedom.
In 2010, Faye and three other prisoners sentenced to life in the 1970s sought to apply good time and gain time to what had been equated to an eighty-year sentence. Doing so would have put their parole-eligibility at forty years, but then – Governor Beverly Purdue stopped them, maintaining that “life means life” without entertaining clemency. The issue went before the state Supreme Court, which sided with the governor. Despite the fact all of these prisoners were over the age of fifty-five and had likely aged out of crime, they were sentenced to life without parole (LWOP) in everything but name.
Ten years passed and Faye continued working by day in the free world and living in prison at night, benefiting from old laws that gave her access to work release, cursed by the impact LWOP has had on the rest of the criminal justice system. When a COVID-19 outbreak struck the NC Correctional Institute for Women in May 2020, Faye knew she was vulnerable. As a sixty-seven-year-old African American woman with underlying health conditions, she was the first to die (Kane and Alexander Reference Kane and Alexander2020). Faye had thirty-five years left on her life sentence.
From “Tough on Crime” to a Geriatric Prison Crisis
Over 200,000 people in U.S. prisons serve sentences that they will never outlive: term sentences longer than fifty years, life (with or without parole), or death (see Mauer and Nellis Reference Mauer and Nellis2018). Thousands are serving for crimes committed when they were children. Some serving under three-strikes laws have never committed a crime of violence. No nation has incarcerated so many individuals until death, to more than five decades of imprisonment, or both. This system has been roundly criticized (see Alexander Reference Alexander2010; Clear and Frost Reference Clear and Frost2014; Enns Reference Enns2016) and most policymakers today, even the most conservative, have turned their backs to it (see Dagan and Teles Reference Dagan and Teles2016). Still, the vast majority of the harsh punishments enacted during the 1980s and 1990s remain in place.
As of 2020, we have about twenty-five years of experience with these "tough-on-crime" laws. An individual entering prison for a long term at age twenty-five would be fifty years old today. In twenty years, the United States will have more incarcerated septuagenarians than the world has ever known. These outcomes are neither surprises nor mistakes; they were anticipated outcomes from policies enthusiastically adopted by many state legislatures and the federal government during that “tough-on-crime” period. In this article, we ask a simple question: How did we get here? What caused us to adopt policies with such unpopular, draconian consequences?
Our answer focuses on agenda-setting, policy framing, emotions, and bounded rationality. In the 1980s and 1990s, politicians of all stripes and at all levels of government enacted radical punishments for crime, establishing long sentences without considering the long-term consequence: an inevitable boom in the geriatric prison population. We present a sobering assessment of how this human rights catastrophe in the making will overwhelm our correctional facilities and state budgets in the decades to come. We show how the political system makes mistakes that have decades of expensive consequences. Bryan Jones and colleagues refer to these as “policy bubbles,” akin to financial bubbles when investors base their decisions on expectations that others will do similarly. We are paying the price for a political bidding-war, where each party sought to prove that it was tougher on crime than the other (see Jones, Thomas, and Wolfe Reference Jones, Thomas and Wolfe2014).
We first review the historical trends, later analyzing their consequences. Next, we show the growth of “tough-on-crime” frames among political leaders. crime experts, and the media. We also show, through a mathematical simulation, the expected age distribution of a generic prison population when parole is eliminated. We then document these trends across the United States and in one state. Last, we illustrate these facts with personal stories drawn from inside prison.
Crime Hits the Agenda, the Public Mood Turns Punitive, and Policies Change
Figure 1 illustrates the “perfect storm” conditions where public concern with crime as a major national problem, public support for punitive policies, and a dramatically rising crime rate came together. It shows, first, that the FBI violent crime rate per 100,000 people rose from less than 200 to over 700 in the period from 1960 to 1995, before declining once again. Second, the figure shows the percent of the public responding “crime” to the Gallup organization’s question: “What is the most important problem facing the nation?” This surged twice, once in response to the urban insurrections of the mid-1960s, and again in the 1990s. Third, it illustrates Peter Enns’ estimate of “public opinion punitiveness” (see Enns Reference Enns2014, Reference Enns2016). The fourth panel presents the three series standardized to have a mean value of zero with a standard deviation of one. This allows an overlay of all three series on the same scale.
The violent crime rate and public opinion on crime
Source: Violent Crime, FBI (http://www.ucrdatatool.gov/); Most Important Problem, Comparative Agendas Project (https://www.comparativeagendas.net/us); Punitiveness, Enns Reference Enns2014.

Concern with crime rose dramatically in the late 1960s, in response to the many instances of unrest in major metropolitan areas. During this period, however, the national crime rate was still relatively low, and the state of public opinion was near its lowest point in terms of support for punitive criminal justice policies. When crime rose again on the agenda in the 1990s, the crime rate had grown to unprecedented levels, and the public mood had soured considerably. One might say that the 1960s saw a surge of concern for crime but also for the disadvantaged who were protesting in the streets. By the 1990s, the attitude was different: Throw away the key.
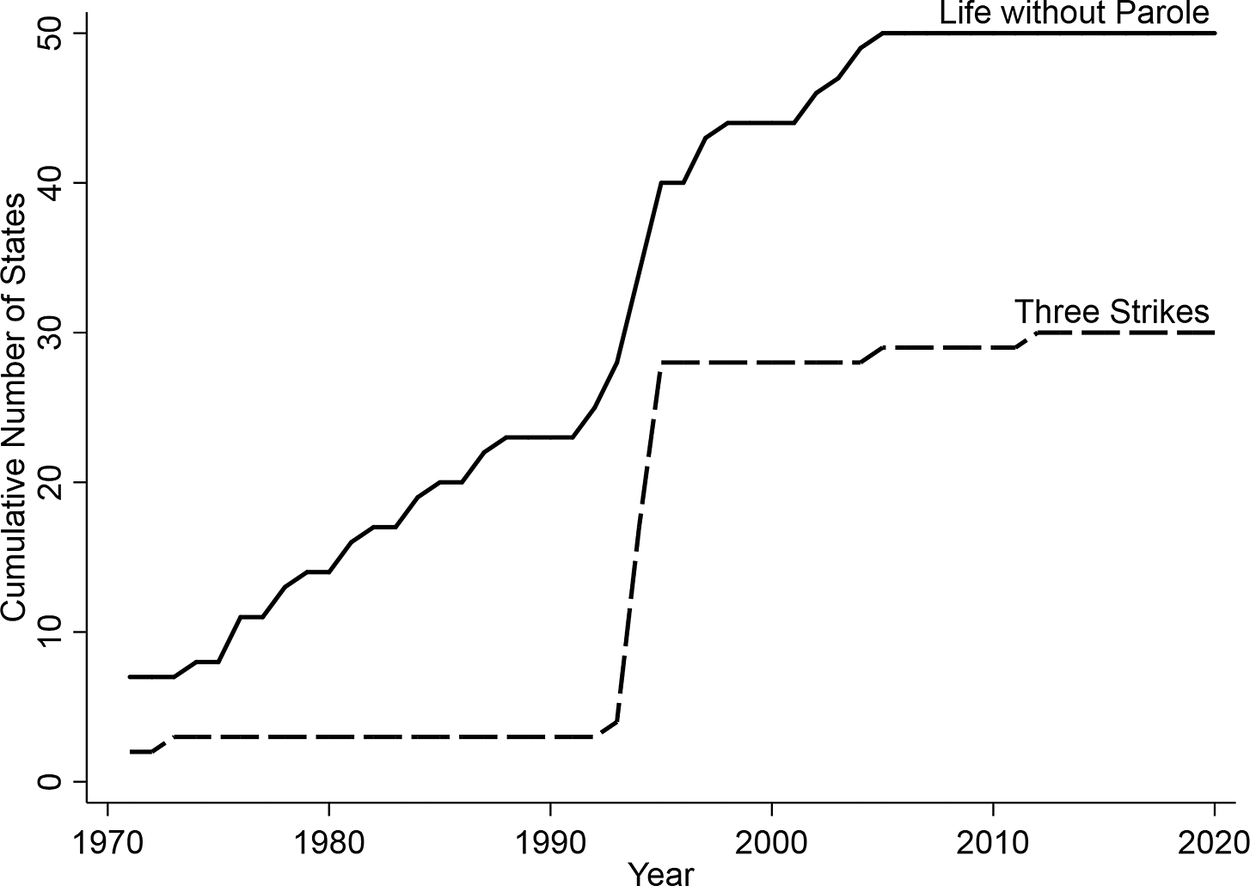
Figure 2 gives an idea of the rapid spread of these beliefs through the states (refer to table A-1 in the online appendix for a list of states and years associated with figure 2). It shows the cumulative number of states with a punishment of life without parole, and the number with “three-strikes” laws. Both policies expanded greatly in the 1990s.
The rapid diffusion of LWOP and three-strikes laws
Source: Refer to the online appendix.

Setting the Stage for Harsh Punishments
Several things had to come together to justify the one-sided criminal justice policies of the 1980s and 1990s. Without reviewing the entire growth of mass incarceration, on which excellent work has already been published (Zimring and Hawkins Reference Zimring and Hawkins1995; Zimring, Hawkins, and Kamin Reference Zimring, Hawkins and Kamin2001; Alexander Reference Alexander2010; Ogletree and Sarat Reference Ogletree and Sarat2012; Page Reference Page2013; Gottschalk Reference Gottschalk2015;), we focus here on a few key points. Policymakers had to accept several intellectual principles in order to adopt these policies. First, they had to abandon the idea that prison serves a rehabilitative purpose. Second, those involved in criminal behavior had to be dehumanized—this included racializing the issue. They had to believe that there was a new generation of “irredeemable” children who would never be productive adults: the “super-predator” frame served this purpose. Only if policymakers assumed that criminal offenders could never be rehabilitated could they accept the idea of never-ending punishment. Political leaders and criminal justice professionals adopted these views in the 1980s and 1990s.
In addition to accepting these frames, people also had to ignore or minimize other facts. These include the uncomfortable aspects of incarcerating the elderly, including their relative lack of danger to society, the high cost of incarcerating them, their vulnerability within the prison population, the human rights element of incarcerating the infirm and the disabled, and the questionable value of continued punishment after a long punishment has already been served.
How can a complicated matter like what to do about crime, an issue that societies have debated for centuries, be reduced to such over-simplifications? As discussion moves from a community of professionals onto the front pages of the papers and into the offices of political leaders, it gets simplified. Where professionals may have a complicated, nuanced, and relatively complete understanding of the complexities of the underlying social problems, this is not the case of the politicians who get involved when issues hit the agenda. Oversimplification is common.
The process we describe here is but one example of a larger phenomenon. Frank Baumgartner and Bryan Jones (Reference Baumgartner and Jones1993) give numerous examples of “waves of enthusiasm” for various public policies in post-war American history later to be replaced with “waves of criticism.” The government did all it could to promote civilian nuclear power in the 1950s, only later to turn against the technology as attention turned to aspects of it that had been overlooked in the earlier period. Smoking and tobacco were promoted until smoking was banned in public places. It should be no surprise that public policy response to crime would be irrational. Crime is an emotional subject and in the environment of the 1980s and 1990s, politicians saw little need for balance. A one-sided enthusiasm for a tough approach was a widespread norm, and it was popular.
Framing Never-Ending Punishment
In assessing how the political system developed oversimplified ideas about punishment in the 1980s and 1990s, it is important to look below the political system to the professional community of experts. The development of a consensus from the professional community is key, because political leaders typically do not have the expertise to adjudicate among competing professional perspectives (see Walker Reference Walker1977, Kingdon Reference Kingdon1984). Political leaders and policymakers focus on the problems (e.g., the need to “do something” about crime) and look to experts within the professional community to offer solutions. As Goodman, Page, and Phelps (Reference Goodman, Page and Phelps2017) explain, an apparent professional consensus may represent a perspective accepted by the dominant players in a professional community, but by no means by everyone. Indeed, those on the losing side of the debate may start immediately on the work to bring their perspective back to influence and power.
The first dramatic step along this discredited path was the publication by criminologist Robert Martinson in Reference Martinson1974 of an article entitled “What Works? Questions and Answers about Prison Reform” (Martinson Reference Martinson1974). Martinson participated in a team of three scholars reviewing hundreds of studies from 1945 through 1967, evaluating prison rehabilitative programs of all sorts. Their conclusions, more fully reported in book form (Lipton, Martinson, and Wilks Reference Lipton, Martinson and Wilks1975), suggested that rehabilitative programs had not been conclusively demonstrated to reduce later recidivism. While the book was nuanced, the article that popularized it was not.
The influence of the 1974 Martinson article can be illustrated with a review of a report to the U.S. Senate as that body considered a comprehensive crime bill in 1983. Traditionally, sentencing guidelines assumed four purposes of incarceration: deterrence, incapacitation, just punishment, and rehabilitation (U. S. Senate 1983, 6 7). The 1983 bill removed rehabilitation from that list. Not long after this shift, the U.S. Supreme Court upheld federal guidelines that eliminated rehabilitation from sentencing considerations. The Court quoted the 1983 Senate report as fact: “The Report referred to the ‘outmoded rehabilitation model’ for federal criminal sentencing, and recognized that the efforts of the criminal justice system to achieve rehabilitation of offenders had failed” (Mistretta v. United States 1989, 366). A professional consensus had reached the highest levels of the government. The Senate and the Supreme Court agreed that rehabilitation was irrelevant, perhaps impossible. Previous generations of policy had assumed it was fundamental to the purpose of incarceration (see Morris and Rothman Reference Morris and Rothman1995).
The framing of “tough on crime” policies included the idea of the juvenile “super-predator.” A spike of young people committing violent crimes in the 1990s fostered anxiety that academic John J. DiIulio injected into the mainstream with his Reference DiIulio1995 article “The Coming of the Super-Predator.” The racial aspects of DiIulio’s concept are explicit. For one, he writes that those he dehumanized actually dehumanized their victims and used racial epithets in describing them: “And they place zero value on the lives of their victims, whom they reflexively dehumanize as just so much worthless ‘white trash’ if white, or by the usual racial or ethnic epithets if black or Latino.” (DiIulio Reference DiIulio1995). But the author goes further: “Among other puzzles, the moral poverty theory explains why, despite living in desperate economic poverty, under the heavy weight of Jim Crow, and with plenty of free access to guns, the churchgoing, two-parent black families of the South never experienced anything remotely like the tragic levels of homicidal youth and gang violence that plague some of today’s black inner-city neighborhoods.” “There is even some evidence that juveniles are doing homicidal violence in ‘wolf packs’ … often murdering their victim in groups of two or more” (DiIulio Reference DiIulio1995).
Of course, by 2000, crime was going down and DiIulio later recanted, saying he was wrong to make predictions about crime rates in the first place (see Becker Reference Becker2001). Martinson (Reference Martinson1979) also disavowed his highly-cited conclusions, saying they had been overstated. But in both cases, the cat was out of the bag. This “research” was just what some politicians wanted to hear and was too widely cited for others to ignore. For a recent review of the powerful impact of DiIulio’s arguments, see Bogert and Hancock Reference Bogert and Hancock2020; for a similar review of Martinson, see Sarre Reference Sarre2001.
Ignoring the Counter-Arguments
The concept of the “super-predator” was contested even as it came to dominate the discourse. As Goodman, Page, and Phelps (Reference Goodman, Page and Phelps2017) describe, professionals whose views were being ignored by policymakers during the 1980s and 1990s were nonetheless making arguments and publishing dissenting views. What arguments were ignored? The fact that never-ending punishment would mean that thousands would grow elderly in prison; that many of these were children at the time of their incarceration; the health needs of geriatric prisoners; the high cost of incarcerating the elderly; the low public safety benefit of incarcerating individuals after they reach a certain age; and the disproportionality of three-strikes laws.
In an exchange of articles presenting opposing views on three-strikes laws, Nkechi Taifa (Reference Taifa1995) presents four arguments: That such a law is too punitive for minor felonies, that it may violate the Eighth Amendment proportionality clause, that it may discriminate against African Americans, and that it is too expensive. She notes expense in two ways: growing incarceration expenses as prisoners age (noting that the elderly may be three times as expensive to house as younger prisoners), and the high cost of incarceration weighed against lower odds of reoffending among elderly prisoners. In response, Morton Feldman (Reference Feldman1995), the Executive Vice President of the National Association of Chiefs of Police, argues that costs simply don’t matter: the law will focus on “violent” offenders,Footnote 1 and these people should be incarcerated no matter the cost. Taifa notes that the policies will require the government to “keep elderly men and women incarcerated through their seventies, eighties, and nineties” (Reference Taifa1995, 723). As Goodman, Page, and Phelps (Reference Goodman, Page and Phelps2017) note, just because one set of professional ideas reaches ascendancy and is congenial to policymakers at a given moment means neither that it is correct nor the object of a consensus.
Several scholars targeted the issue of the cost of incarcerating elderly prisoners. Ronald Aday (Reference Aday1994) gives an overview of the various adjustments corrections officials needed to make as elderly prison populations explode: a) greater need for medical attention; b) special programs and facilities, such as special diets, 24-hour nursing care, and different work programs; c) building new facilities or altering old ones to accommodate residents with limited mobility; and d) protecting older prisoners who are vulnerable to attack by younger prisoners (see Vega and Silverman Reference Vega and Silverman1988). Numerous studies (including McCarthy Reference McCarthy1983; Gewerth Reference Gewerth, McCarthy and Langworthy1988; Marquart, Marianos, and Doucet Reference Marquart, Merianos and Doucet2000; and Fazel et al. Reference Fazel, Hope, O’Donnell, Piper and Jacoby2001; LaMere, Smyer, and Gragert Reference LaMere, Smyer and Gragert1996) indicated that the average geriatric prisoner suffers from at least one (often several) chronic health conditions, and that people sentenced to LWOP present even greater health risks due to higher rates of mental illness, substance abuse, physical abuse, and less access to adequate health care throughout their lives. Long prison terms create over-crowding, of course, or require the construction of costly new prisons. Wright notes that “if society considers true life-without-parole sentences to be meaningful and appropriate punishments for murder, society also may need to think in terms of designing some prisons as ‘maximum security convalescent homes’” (Reference Wright1990, 564).
In sum, the 1980s and 1990s saw an apparent professional consensus, projected to the White House, the Senate, the Supreme Court, state legislatures, and policymakers, that a new kind of criminal had emerged, that rehabilitation was impossible, and that we had no choice but to adopt the toughest punishments the world has ever known. Dissenting voices screamed out through the professional journals, but to no avail. While the complexity of the situation was never lost on the professionals, policymakers wanted to do something dramatic. With public support, they adopted the laws we experience today.
Media Frames
One reason that the public and the nation’s political leaders supported tough-on-crime policies is the media’s use of the super-predator and other inflammatory frames. Local media coverage has been known to follow the maxim “if it bleeds it leads,” reflecting an overemphasis on crime, particularly violent crime (see Gilliam et al. Reference Gilliam, Iyengar, Simon and Wright1996; Beale Reference Beale2006; Britto and Noga-Styron Reference Britto and Noga-Styron2014; Seeds Reference Seeds2018). However, a typical reader would be exposed to little discussion of the geriatric prison crisis to come. Our review of news coverage of policy questions related to life without parole using the Nexis-Uni database identified a total of 1,772 stories from 1982 to 2019. Of these, only 2.65% had any mention of aging of the prison population as a result of life without parole; the vast majority of the stories adopted the “irredeemability” or the “tough on crime” frame (refer to table A-2 in the online appendix for our search terms and the number of articles associated with each).
In our analysis, those few articles discussing aging in the context of LWOP included critiques of LWOP bills pointing out such things as “the bill would make prisons into geriatric wards for criminals and hold them way beyond the time they pose a realistic threat to society” (Capital Times 1994). These remarks, however, were infrequent and, when they did occur, they did not fully capture the humanitarian and monetary cost of imprisoning elderly individuals. Though politicians would point to the fact that it was “easy to see that life without parole will create gigantic geriatric prison wards” (Hunter Reference Hunter1994), they rarely talked about the realities of large parts of the prison population being confined to a bed due to age-related illness for extended parts of their sentences. There may be two sides to every story, but when it comes to discussions of crime policy in the media, one side is stronger than the other.
Getting What You Wished For
When U.S. policymakers enacted the harsh policies of the 1980s and 1990s, the consequences were predictable. While today many may say that policymakers overreacted, few public officials said so at the time, and few journalists pointed this out. The effects of never-ending punishment are can be felt in rapidly-graying prison populations and state budgets (Program Evaluation Division 2018), as the costs of caring for the elderly and the chronically ill spiral upward. We show that this is indeed occurring, though the most consequential impacts of these policies will come later. The first demonstration is through a mathematical simulation, and the second is through a review of prison statistics. Our final section illustrates these trends with personal stories of those growing old in prison.
The Impact of Eliminating Parole: A Mathematical Simulation
One of the most important policy reforms of the "tough-on-crime" era was eliminating parole. This reform had large and predictable consequences that we can illustrate by simulating age distributions in prison populations under otherwise identical scenarios, one with parole and one without. Our simulation has 1,000 individuals enter prison in each time period, with mean age at entry of twenty-six and standard deviation of 3. Individuals exit prison only by death or parole; our simulation ignores those serving short terms. We use an age-specific mortality rate based on CDC (2020) estimates; annual morality increases from 0.07% for the youngest group up to 19% for those aged ninety and over. (These rates are likely higher in incarcerated populations.)
In our parole simulation, individuals become eligible after twenty-five years and 10% those eligible earn parole annually. (These precise values are not of primary interest. Rather, the comparison of parole and no parole is.) After iterating the simulation many times, each system reaches an equilibrium age distribution. In figure 3, we simulate a system with parole for 100 time periods, then eliminate parole. Bars indicate the numbers of prisoners of different age groups: below 30, over 60, and in between. In both cases there is a transition period before the system reaches equilibrium. The first is not of interest. The second, however, reflects where we are today, not even yet at where the system inevitably will lead us.
Simulated prison population with parole, then without

Eliminating parole increases the total prison population by over 50%, increases the median age by over nine years, and generates a four-fold increase in the share of older members in the prison population. All of these are purely mathematical; no further policy is required other than the elimination of parole. We present one simulation here, but we have run many. No matter what specific parameters are used, eliminating parole causes a population to grow larger and older—so much so that those aged 60 and over quickly outnumber those under 30 (refer to the online appendix for additional simulations). In the next section, we make clear that we are transitioning to a new demographic reality in U.S. prisons, one entirely understandable by the fact of eliminating parole.
The Beginnings of the Geriatric Explosion in U.S. Prisons
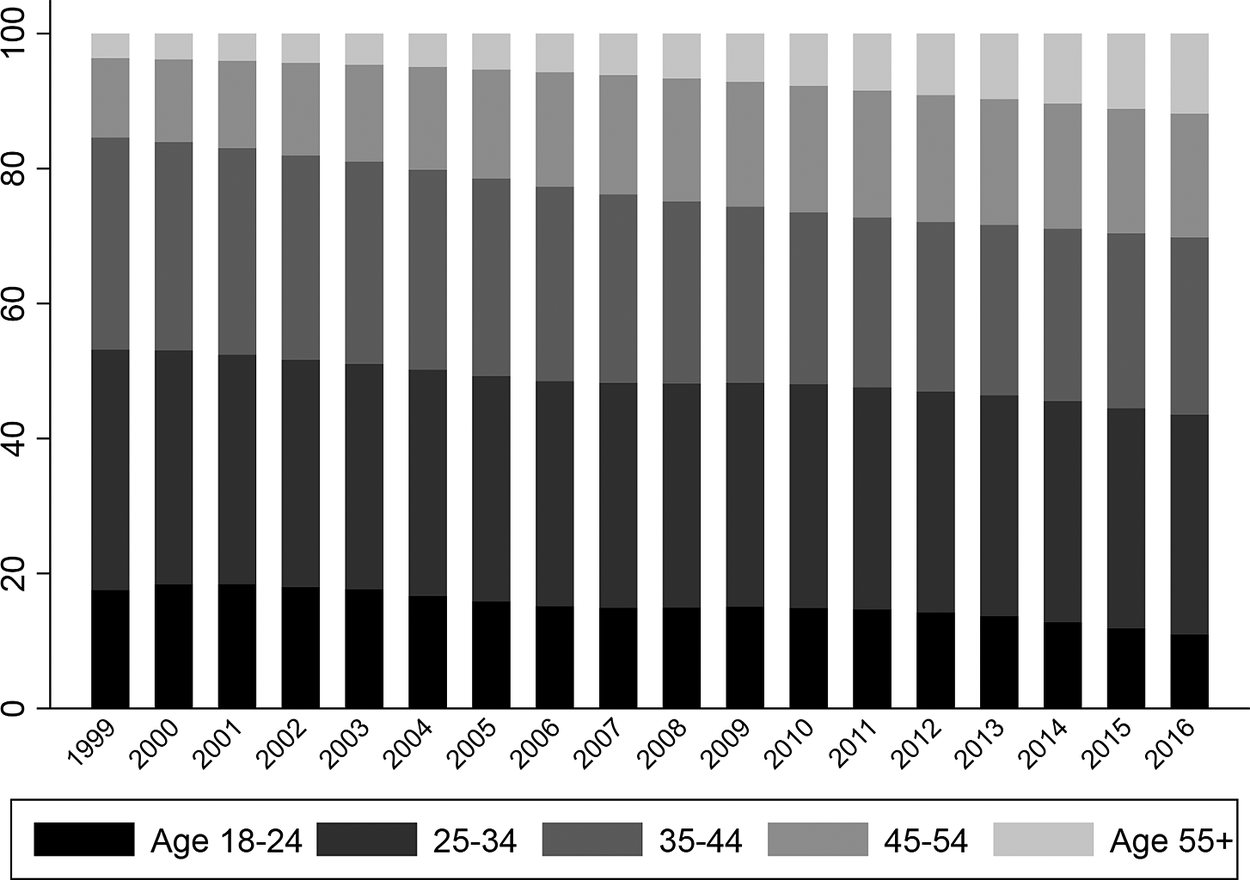
By reviewing prison population statistics, we find support for the trends detailed in the previous section. We use data available through the National Corrections Reporting Program, which provides data on state and federal prisons (not local jails) from 1999 through 2016 (United States Department of Justice 2018). Figure 4 shows the distribution of ages of incarcerated individuals across the nation.
The changing age distribution of the U.S. prison population

Looking at the top two age groups in figure 4, it is clear that over time, they grow to be a much larger share of the prison population. Younger groups represent a correspondingly smaller share of the total over time. If we define older prisoners as those aged 55 or higher, and youthful ones as those aged eighteen to twenty-four, we can compare the two groups directly; see figure 5.
The elderly now outnumber the young

Figure 5 shows that the elderly now outnumber the young in the nation’s prisons. A quick glance at figure A-1 in the online appendix, based on our simulations, shows that the trends in figure 5 are precisely what one could expect from the policies we have discussed.
Of course, the trends in figures 4 and 5 are national, but each state adopted these policies at slightly different times. It is instructive to review the experience of a single state in some detail, looking at how the demographic trends in prison population reflect, with a predictable time lag, the elimination of parole and the adoption of longer sentences. North Carolina increased the severity of punishment for many crimes in the 1990s. Sentencing reforms effective in 1994 eliminated the traditional concept of parole and enhanced the length of punishment for the most serious crimes, while reducing punishment levels for other crimes. We make use of publicly available data from the North Carolina Department of Public Safety (refer to the online appendix for more detail).
In 1975, 140 individuals were serving sentences of over fifty years in North Carolina; by 2020 this number had increased to 3,820. Figure 6 shows the age distribution of prisoners in each year from 1975 to the present.
Age distribution of North Carolina prison population

In 1975, 6,934 individuals, over half of the 12,727 individuals incarcerated, were under the age of 30; just 366 individuals were aged 60 or older. By 2020, the number of older prisoners had increased to 3,038, whereas the number of those under the age of 30 had declined to 5,368 (despite the rapid rise in total prison population that figure 6 makes clear). Prisoners in their 30s, 40s, and 50s grew substantially as well. Figure 7 breaks down the group of prisoners aged 50 and over to show the dramatic rise in those over fifty beginning in the late-1990s, almost immediately following the implementation of the 1994 sentencing reform.
Population aged 50+, 60+, and 70+ in North Carolina prisons

The number of prisoners aged fifty and older, which had never been above 1,500 before 1990, rose to almost 9,000 in 2018. Those sixty and older increased from fewer than 500 in every year before 1988 to over 3,000 in 2020; those over seventy numbered fewer than 100 in every year before 1987, but rose to 650 by 2020. These changes in ages are more due to shifts in sentencing policies, particularly the dramatic rise in the numbers of people serving very long sentences, than they are due to increased age of entry. On average, the median age at entry is 34 both for those currently incarcerated as well as for those incarcerated at any time since 1975.
Finally, these policies dramatically affect the racial mix of the prison system. Blacks represented fewer than 45% of those admitted to North Carolina prisons from 1975 until the late 1980s, but their share grew to over 55% in the years following reform. Nationally, Nellis and King (Reference Nellis and King2009) document similar trends: Blacks were 37.5% of the general prison population, but 48% of those serving life sentences and 56% of those serving LWOP. In North Carolina, over 75% of those serving “habitual felon” or “violent habitual felon” sentences are Black (see Baumgartner and Johnson Reference Baumgartner and Johnson2020).
So far, we have made our arguments with numbers. In the next section we illustrate the human aspect of the policies we have been describing.
Illustrating the Human Costs of Never-Ending Punishment with Examples
Co-author Lyle May has been incarcerated in North Carolina since 1997, when he was nineteen. We rely here on his lived experience as he introduces the reader to individuals whose stories illustrate the trends we discuss. Some of the names and small details of these vignettes have been changed to protect the anonymity of those whose stories we present.
Virtual Life without Parole
Carl was twenty-one in the late 1990s when he and two friends, high on methamphetamines, went on a robbery and shooting spree. While no one died, Carl and his friends were charged with attempted murder, armed robbery, evading the police, and other felonies. Once arrested, Carl’s co-defendants testified against him in exchange for twenty-year plea-bargains. At trial, the jury convicted Carl on every charge. A judge gave Carl 127 years in prison.
With no release before his 85% minimum in the year 2107, Carl continued doing in prison what he had on the street. There was no incentive to do otherwise. Carl abused any available drugs, fought other prisoners, and assaulted staff. He spent more time in solitary confinement than at work. The lack of programs and extended periods of solitary confinement eroded his mental health.
Twenty years later, maturity calmed Carl’s desire to fight and rebel. At the age of 43, he considers whether another stint on lock-up is worth the next rule infraction. Usually his answer is no. In another twenty years, if Carl survives his life choices, chronic disease will cripple him—hepatitis C or HIV from IV drug use, hypertension and heart disease from a poor diet, and arthritis from decades of sleeping, sitting, and walking on concrete and steel. The costs of his continued incarceration will be much higher than those of younger prisoners and bear little relation to the public safety benefits they generate. Long after the victims, prosecutors, and co-defendants have moved on with their lives, Carl will still be in prison. If we consider that he may have aged out of crime in his fifties, Carl would still have sixty-seven years to serve.
LWOP as Mercy
LWOP is the second most punitive sentence available for first-degree murder and only alternative to the death penalty. LWOP is the standard sentence for anyone who pleads guilty to avoid the death penalty and therefore represents the “mercy” offered to capitally sentenced juveniles, mentally ill, and intellectually disabled defendants.
Jimmy was convicted of homicide as a teenager in 1976 and received a parole-eligible life sentence from which he earned release after seventeen years in prison. A hyperactive, mentally ill, and intellectually disabled man, Jimmy struggled to keep a job. He had difficulties interacting with people because he rambled and jumped topics in conversation, and had poor hygiene habits. While on parole, Jimmy began using crack and absconded. Not long after, in the grips of a binge, Jimmy got into an argument and killed a woman who had been abusing drugs with him. This time he was charged with first-degree murder and sentenced to death.
On death row, away from drugs and alcohol, Jimmy’s mental deficiencies were apparent. He had few friends because he failed to comprehend ordinary rules of conversation, was anxious, excitable, and easily influenced. Staff and prisoners abused Jimmy’s agreeableness and eagerness to be liked, coaxing him to do and say things he might not do or say on his own. One time a warden called him out to “perform” for the amusement of a tour group, asking Jimmy to sing and dance for them. The warden knew of Jimmy’s disability.
Everyone who knew Jimmy questioned why he was not in a hospital. It took his appellate attorneys twenty years to prove Jimmy’s intellectual deficiency and for a court to agree. His death sentence was commuted to LWOP, condemning a sixty-three-year-old man with a low IQ to an often predatory and violent general prison population where the old and weak are frequently victimized. There are no special programs for intellectually disabled or mentally ill people who receive LWOP. Being resentenced to LWOP was the only “mercy” that Jimmy received.
COVID and Prison Health Care
Smokey had been on death row since the early 1990s for a shootout with law enforcement officers that resulted in the death of two innocent bystanders. Though they were unintentional deaths, any homicide committed in the act of another felony is a capital offense.
While Smokey appealed the decision, he grew old and sick. Hepatitis C from IV drug use, hypertension, diabetes, and an infection that collapsed both lungs hospitalized Smokey over a dozen times in three years. When he turned 66 in 2020, Smokey began experiencing symptoms of a stroke. He complained to a nurse, who informed him that unless he was unconscious or bleeding, only COVID-19 patients were being seen. Later that evening, Smokey had two strokes and was hospitalized.
During the pandemic, prisoners with chronic illnesses have been denied routine check-ups. As a result, emergency hospital visits have increased. In November 2020, over twenty prisoners from one North Carolina facility—most of them over age fifty-five—required emergency care. Each of them required two custody staff as escorts, which drew much-needed personnel away from an already understaffed prison. The cost of incarcerating elderly prisoners is high because they have a greater need for medical attention and special care, as discussed earlier. When medical needs are not addressed, they worsen, generating greater costs and affecting other areas such as the safety and security of a facility. Since security is paramount, the aged prisoners’ medical needs can be ignored, generating conditions inconsistent with the Constitution’s prohibition on cruel and unusual punishments.
Preferring Death
Jay was convicted and sentenced to death for a 1986 murder and second-degree sexual assault. High and strung out on drugs when he committed the crimes, he found sobriety, clarity, and remorse while incarcerated. Jay felt deeply responsible for the harm he caused to the victim and her family, doing his best to atone by leaving behind the person he used to be.
After six years, Jay’s death sentence was overturned on appeal. While awaiting a sentencing hearing in the general prison population, Jay availed himself of every rehabilitative program offered. One of those included the Shaw University Cape Program, which provided a bachelor’s degree in business to eligible prisoners who completed the requisite course work. Jay did so, earning his bachelor’s degree shortly before the 1994 Violent Crime Control and Law Enforcement Act eliminated federal funding for college programs in prison. Jay was resentenced to death.
Back on death row, Jay tried to use what he learned to help other prisoners, teaching some to read or engage in the difficult process of accepting responsibility for their crimes. Jay watched his three children grow older in photos and did his best to stay in touch through letters. Prison is not designed to help families maintain their bonds. After fourteen years in prison, his first grandchild was born. After thirty-two years, his first great-grandson was born.
At age sixty-four, Jay often wonders if he will get a second chance. Since he was convicted under the Fair Sentencing Act, which provides parole-eligible life sentences for murder, a reasonable chance for release exists. When his death sentence was overturned on appeal, Jay rehabilitated himself, maintained ties with family, and became a model prisoner. He did everything the parole board requires of prisoners except, when Jay’s sentencing hearing occurred in 1995, it was at the height of the public concern about crime. Though Jay’s crimes were no different from other offenders who received parole-eligible life sentences, he was caught up in the national trend to “throw away the key.”
Life without Parole
Kyle was sentenced to death for two gang-related murders that occurred in his late teens. On death row, Kyle grew out of the irrational choices of his youth, maturing around aging prisoners and staying out of trouble. Because Kyle’s co-defendants pled guilty and testified against him in exchange for reduced sentences, and he had a learning disability, a judge resentenced Kyle to LWOP.
Once in the general prison population, Kyle discovered most rehabilitative programs are for prisoners with release dates. The only jobs he could hold as a lifer were on the road squad cleaning up trash and storm debris, working in the kitchen, in the prison warehouse, or as a janitor. If he stayed infraction-free in medium custody, Kyle might even have gotten on a waiting list for the Inmate Construction Program, travelling on a prison bus around North Carolina to refurbish old prisons or build new ones.
Whatever the job, forced labor would not make up for his lack of education. Nor would working 40–60 hours a week for forty cents a day make up for the lack of family and friends. Kyle scraped by one day, week, month, and year at a time until the thought of never getting out, of growing old and infirm in prison, exhausted his ability to resist depression and despair. His daily existence was the misery that makes many lifers wish for death. Nearly twenty years into Kyle’s permanent incarceration he was discovered dead in his cell, the result of an accidental drug overdose or an intentional suicide; the world will never know. Kyle’s unclaimed body was buried in a local cemetery.
Conclusions
No matter what one may think of the merits of tough-on-crime penalties, the process we have described shows serious drawbacks. To generate support for these policies, several factors had to be in place: public fear of crime, a dismissal of the possibility of rehabilitation, and a dehumanization of those who were incarcerated. Racially-charged depictions of crime contributed to the dehumanization. Today, not only are we paying the consequences of these policies, but many of the underlying assumptions that made them possible have been demonstrated to be false.
Ours is far from the first study of the policy process where we find such over-reach. Indeed, we present, in some ways, just another example in a string of cases showing how policy frames can become so powerful that they overwhelm more complex ways of thinking about a complicated matter of public policy, such as what to do about crime. The policy bubble that we describe burst eventually (Jones, Thomas, and Wolfe Reference Jones, Thomas and Wolfe2014). But, as in the case of financial bubbles, it has left massive destruction in its wake.
The United States is on the verge of an explosion of geriatric prisoners, generating a grave human rights issue. No nation has ever sentenced as many to grow old and die incarcerated, nor to remain incarcerated as infirm and elderly individuals who pose little threat to the community. The coronavirus pandemic has demonstrated the risks of vulnerable populations, and elderly individuals with underlying health conditions living inside correctional institutions are certainly at the center of that concern. Prost et al. (Reference Prost, Novisky, Rorvig, Zaller and Williams2020) propose an urgent “call to action” among gerontologists to address the growing crisis of elderly prisoners in the face of the pandemic. In sum, the human rights issues that will inevitably follow from our collective decision to incarcerate thousands of individuals until they die are already happening.
Our nation’s political leaders, with the active support of the media and policy experts concerned about crime, adopted policies in the 1980s and 1990s for which the costs are now becoming apparent. The intellectual justifications that undergirded these policies have been demonstrated to be false, though they remain powerful. The racialization, the dehumanization, and the stereotyping associated with these policies made it so that thousands of children, many of color, were sentenced to die in prison, where they are currently growing into their middle ages. These decisions exemplify the ability of decision-makers to focus their attention on a narrow slice of a complicated problem, ignoring complex trade-offs in order to “do something” about an important national problem. We hope that professionals within the criminal justice community, social activists, voters, and political leaders at all levels of government can now move to address the problems that a wave of fearmongering and tunnel vision generated a generation ago.
Supplementary Materials
Table A-1. The Rapid Diffusion of LWOP and Three-strikes Laws.
Table A-2. Keywords used for Nexis-Uni Search of Media Coverage.
Table A-3. Stimulated Prison Populations with Parole after 20 Years, or No Parole.
Figure A-1. Changes in Simulated Prison Demographics with and without Parole. Construction of the North Carolina Prison Population Dataset
To view supplementary material for this article, please visit http://dx.doi.org/10.1017/S153759272100164X.