Nomenclature
-
 ${C_L}$
-
lift coefficient
-
${C_D}$
-
drag coefficient
-
${C_m}$
-
pitching moment coefficient
-
${C_Y}$
-
lateral force coefficient
-
${C_n}$
-
yawing moment coefficient
-
${C_l}$
-
rolling moment coefficient
-
${C_R}$
-
residual thrust coefficient
-
${C_T}$
-
thrust coefficient
-
$V$
-
velocity
-
$\beta $
-
sideslip angle
-
$\alpha $
-
angle-of-attack
-
$p$
-
roll rate
-
$q$
-
pitch rate
-
$r$
-
yaw rate
-
$\phi $
-
roll angle
-
$\theta $
-
pitch angle
-
$\psi $
-
yaw angle
-
$m$
-
mass
-
$Q$
-
dynamic pressure
-
$S$
-
wing area
-
$b$
-
wingspan
-
$c$
-
chord
-
$g$
-
gravitational acceleration
-
${I_x}$
-
moment of inertia around x-axis
-
${I_y}$
-
moment of inertia around y-axis
-
${I_z}$
-
moment of inertia around z-axis
-
${I_{xz}}$
-
product of inertia of xz-axis
-
$T$
-
power of the culvert fan
-
${\delta _l}$
-
rudder surface deflection of left V-tail
-
${\delta _r}$
-
rudder surface deflection of right V-tail
-
${\delta _a}$
-
differential deflection of aileron
-
${\delta _{al}}$
-
differential deflection of left aileron
-
${\delta _{ar}}$
-
differential deflection of right aileron
-
${d_p}$
-
original value of the input of neural network
-
${m_p}$
-
sample mean
-
${s_p}$
-
sample variance
-
${n_p}$
-
normalised value
-
$\eta $
-
power differential factor


1.0 Introduction
Distributed propulsion vehicle is a new layout and new concept flight vehicle, whose propulsion system consists of multiple electric propellers or small culvert fans distributed on the fuselage or wings [Reference Isikveren, Seitz, Bijewitz, Mirzoyan, Isyanov, Grenon, Atinault, Godard and Stückl1–Reference Steiner, Seitz, Wieczorek, Plötner, Isikveren and Hornung3]. The use of distributed ducted fan is suitable for hybrid systems and will greatly reduce the manufacturing cost of distributed propulsion vehicle [Reference Nasoulis, Protopapadakis, Ntouvelos, Gkoutzamanis and Kalfas4, Reference Pornet, Gologan, Vratny, Seitz, Schmitz, Isikveren and Hornung5]. It reduces the requirements and design difficulties associated with a single large engine, mitigates aircraft noise and enhances wind disturbance resistance [Reference Gohardani, Doulgeris and Singh6, Reference Fard, He, Huang and Cao7]. Additionally, distributed propulsion improves the safety of the propulsion system and shortens takeoff and landing distances [Reference Gohardani8]. Due to these benefits, it has wide applications in both commercial and military fields [Reference Stoll, Stilson, Bevirt and Pei9, Reference Finger, Braun and Bil10]. A new propulsion fuselage aircraft layout is used in the distributed propulsion vehicle, significantly improving the aerodynamic performance of the vehicle [Reference Seitz and Gologan11–Reference Seitz, Bijewitz, Kaiser and Wortmann13]. However, the new layout and propulsion method introduce several challenges [Reference Ma, Zhang, Zhang, Zhang and Zhong14–Reference Stoll, Bevirt, Moore, Fredericks and Borer16]. One significant issue is the strong coupling between vehicle-thrust-control in distributed propulsion vehicles, which utilise multiple thrust units and aerodynamic rudder surface cooperative control [Reference Felder, Kim and Brown17, Reference Rothhaar, Murphy, Bacon, Gregory, Grauer, Busan and Croom18]. This coupling necessitates a control system with fast response, high manoeuverability, and strong robustness [Reference Mike19].
Dynamics modeling is an important foundation for designing flight controller, and establishing an accurate and low-complexity model is a prerequisite for designing efficient and strongly robust controller [Reference Willis and Beard20, Reference Parker, Serrani, Yurkovich, Bolender and Doman21]. Aerodynamic modeling is the key to dynamics modeling, which has attracted extensive attention from scholars in related fields. Benjamin et al. established an aerodynamic model of the LA-8 distributed tilt-rotor electro propulsive vehicle based on a system identification method using wind tunnel test data [Reference Simmons and Murphy22]. Neural networks have been used in aerodynamic modeling due to their powerful learning and perception capabilities, and the method can also significantly reduce the modeling cost of aerodynamic models. Li et al. established a deep neural network-based aerodynamic model, introduced experimental and simulation data into the loss function, and adjusted the weight of the model accuracy and cost by setting the weighting factor [Reference Li, Kou and Zhang23]. Distributed propulsion vehicle has more power units and is a multi-input and multi-output system, if the traditional polynomial modeling/interpolation modeling method is used, a large amount of experimental data is needed and the modeling cost is excessively high. Therefore, neural network is an effective method for aerodynamic modeling of distributed propulsion vehicle.
Distributed propulsion vehicle can allocate the control authority of each power unit according to the flight state and flight environment, taking into account factors such as manoeuverability, stability and energy use efficiency [Reference Wang, Zhang and Yang24]. Compared with conventional layout vehicles, the dynamics of distributed propulsion vehicle are more complex and nonlinear, and there are close coupling relationships between the propulsion system and the flight control [Reference Kim, Perry and Ansell25]. The aerodynamics and the propulsion system, and the transverse and longitudinal dynamics, which have a great impact on the performance and stability of the vehicle [Reference Weng, Zhang, Yao, Bu and Li26, Reference Deere, Viken, Viken, Carter, Wiese and Farr27]. In some advanced flight controller design efforts, the longitudinal dynamics of the vehicle are modeled and the controller is designed in order to simplify the derivation and analysis process [Reference Dong, Li, Lv and Zuo28–Reference Dong, Li, Zheng, Zhou and Wu30]. However, the dynamics of distributed propulsion vehicles are highly nonlinear and tightly coupled. Consequently, the longitudinal model fails to accurately capture their dynamical response characteristics. Therefore, a six-degree-of-freedom dynamics model is necessary to support the design of distributed propulsion flight controllers.
A six-degree-of-freedom flight dynamics model of the distributed propulsion vehicle with pure thrust control is established, and a full envelope nonlinear flight controller is designed to guarantee stable flight according to the dynamics model [Reference Suiçmez and Kutay31]. Jeffrey et al. established a six-degree-of-freedom linear time-invariant state space model of distributed electric propulsion vehicle and verified the validity of the model using open-loop simulation [Reference Freeman and Klunk32]. Eric et al. established a six-degree-of-freedom linearised distributed propulsion vehicle model, realising the joint optimal design of the control law and the shape under the H-
 $\infty $
control framework [Reference Van, Alazard, Döll and Pastor33, Reference Van, Alazard, Döll and Pastor34]. Based on linearised flight dynamics model and approximate electric thruster dynamics model, Kou et al. proposed a layered model predictive control method for distributed propulsion vehicle dynamic yaw control [Reference Kou, Wang and Liang35]. However, the dynamics of distributed propulsion vehicles are more complex than those of traditional vehicles. This complexity arises from strong interactions between the dynamics and the propulsion system. The dynamic behaviour of such systems exhibits greater nonlinearities. In addition, the vehicle is inevitably disturbed by uncertainties such as sudden winds, which exacerbates the nonlinearity of the vehicle [Reference Dong, Li and Lv36, Reference Dai, He, Zhang, Gu, Yang and Xu37]. Therefore, only establishing a linearised model is not enough to support the controller design of a distributed propulsion vehicle.
Based on the preceding analysis, this paper establishes a control-oriented six-degree-of-freedom nonlinear dynamics model for distributed propulsion vehicles. The main work and innovations are summarised as follows:
-
• Compared to the linear models proposed in [Reference Stoll, Bevirt, Moore, Fredericks and Borer16–Reference Mike19], the proposed nonlinear model offers more accurate and comprehensive characterisation of distributed propulsion vehicle dynamics. This provides a foundation for advanced nonlinear controller design.
-
• A deep neural network is utilised to train the aerodynamic coefficient model, which can accurately reflect the effects of flight state, rudder deflection angle and fan thrust on lateral and longitudinal aerodynamic coefficients.
-
• Based on the designed controller, the effectiveness of the dynamics model of distributed propulsion vehicle in executing climb, descent and turn commands is verified.
The rest of the paper are organised as follows: Section 2.0 describes the layout and performs aerodynamic characterisation of distributed propulsion vehicle, Section 3.0 establishes the dynamics model of distributed propulsion vehicle, Section 4.0 designs the controller, Section 5.0 provides the simulation validation results and analyses, and Section 6.0 concludes the work.
2.0 Layout and aerodynamic characterisation of distributed propulsion vehicle
2.1 The layout of distributed propulsion vehicle
Considering the layout of the distributed propulsion vehicle depicted in Fig. 1. Multiple small culvert fans are arranged side-by-side on the wing near the fuselage. By differentially controlling the power on both sides, thrust and differential yaw moment can be provided to the vehicle. The tail adopts V-tail configuration, which is deflected to generate yaw moment and pitching moment. The outer trailing edge of the wing is an aileron, which is differentially deflected to generate roll moment.
The layout of distributed propulsion vehicle.

2.2 The wind tunnel test
The test is carried out in a large-scale low-velocity wind tunnel, which can carry out 1:1 scale wind tunnel test with power. The weight of distributed propulsion vehicle is 120 kg, the length is 3.7 m and the wingspan is 4.7 m. The distributed propulsion vehicle employs a high-lift configuration, the power system of the vehicle consists of ten small electric ducted fans. In the design of the wind tunnel test programme, the typical flight state of the vehicle is firstly selected, including cruise, power differential yaw, slope turn. Then a certain grid density is selected to divide the typical flight states. Through the wind tunnel test, the basic longitudinal performance of the vehicle, the V-tail rudder efficiency, the aileron rudder efficiency, the effect of the power differential are tested and the values of aerodynamic forces and aerodynamic moments at the key state points are obtained. Considering the layout, power system, weight and size of the vehicle, the maximum flight velocity of the vehicle is designed to be 50 m/s. In consequence, four flow velocity of 25 m/s, 33 m/s, 42 m/s, 50 m/s are carried out in the wind tunnel experiment, the input power of the ducted fans contains four kinds: 0, 1.45 kW, 2.54 kW, 3.03 kW. The ambient temperature is 15
 ${{\mathrm{\;}}^{\circ} }$
C, the atmospheric pressure is 1.225 kg/m
 ${{\mathrm{\;}}^3}$
, and the Reynolds number ranged from
 $9.4132 \times {10^5}\sim 1.8826 \times {10^6}$
.
2.3 The aerodynamic characterisation based on wind tunnel tests
The power of the culvert fan is selected to be either 0 or 3.03 kW. The incoming flow velocity is set at 25 m/s. The sideslip angle is maintained at 0. The left and right rudder deflections of the V-tail are both 0. The lift coefficient
 ${C_L}$
, the residual thrust coefficient
 ${C_R}$
, and the pitching moment coefficient
 ${C_m}$
change with the angle-of-attack
 $\alpha $
, as shown in Fig. 2. The residual thrust coefficient
 ${C_R} = {C_D} - {C_T}$
is the difference between the drag coefficient
 ${C_D}$
and the thrust coefficient
 ${C_T}$
, which means that the thrust is greater than the drag if
 ${C_R}$
is negative, and the thrust is less than the drag if
 ${C_R}$
is positive.
The longitudinal aerodynamic coefficients at the incoming flow velocity of 25 m/s: (a) the lift coefficient, (b) the residual thrust coefficient, (c) the pitching moment coefficient.

As shown in Fig. 2, the blue curve indicates the lift coefficient when the culvert fan power is 0, and the black curve indicates the aerodynamic coefficient when the culvert fan power is 3.03 kW. As shown in Fig. 2(a), the lift coefficient increases nearly linearly with the increase of angle-of-attack when angle-of-attack is less than 18°, and the maximum value of the lift coefficient is more than 3. It is evident that the lift of the vehicle can be significantly increased by using the distributed propulsion method. In addition, the stall angle-of-attack increases significantly.
In order to show the pitching rudder effect of the V-tail, the power of culvert fan is selected to be 1.45 kW, the incoming flow velocity is 42 m/s, the sideslip angle is 0, and the rudder deflection angle of the V-tail is selected to be: downward deflection of 10
 ${{\mathrm{\;}}^{\circ}}$
(
 ${\delta _l} = {\delta _r} = {10^{\circ}}$
) or upward deflection of 10
 ${{\mathrm{\;}}^{\circ}}$
(
 ${\delta _l} = {\delta _r} = - {10^{\circ}}$
), and the changes of the lift coefficient, the coefficient of the residual thrust, and the coefficient of the pitching moment with the angle-of-attack are shown in Fig. 3.
The longitudinal aerodynamic coefficients at the incoming flow velocity of 42 m/s: (a) the lift coefficient, (b) the residual thrust coefficient, (c) the pitching moment coefficient.

As can be seen from Fig. 3, the V-tail deflection has a certain effect on the lift coefficient, and the lift coefficient is reduced by about 0.1 for 10
 ${{\mathrm{\;}}^{\circ}}$
upward deflection of the rudder surface than downward deflection of 10
 ${{\mathrm{\;}}^{\circ}}$
, the V-tail deflection has little effect on the residual thrust coefficient, and it has a translation effect on the pitching moment coefficient.
In order to further study the effect of V-tail deflection on the aerodynamic characteristics of the transverse heading, the power of culvert fan is selected to be 1.45 kW, the incoming flow velocity is 42 m/s, the sideslip angle is 0, and the rudder deflection angle of the V-tail is selected as follows: the left side upward deflection of 5
 ${{\mathrm{\;}}^{\circ}}$
, the right side downward deflection of 5
 ${{\mathrm{\;}}^{\circ}}$
(
 ${\delta _{al}} = - {5^{\circ}},{\delta _{ar}} = {5^{\circ}}$
) and the left side upward deflection of 20
 ${{\mathrm{\;}}^{\circ}}$
, the right side downward deflection of 20
 ${{\mathrm{\;}}^{\circ}}$
(
 ${\delta _{al}} = - {20^{\circ}},{\delta _{ar}} = {20^{\circ}}$
). The lateral force coefficient, the yaw moment coefficient, and the roll moment coefficient are changed with the heading angle, as shown in Fig. 4, indicating that the differential deflection of the V-tail has a large effect on the lateral force coefficient, yaw moment coefficient and roll moment coefficient.
The differential rudder effect of V-tail at the incoming flow velocity of 42 m/s: (a) the lateral force coefficient, (b) the yaw moment coefficient, (c) the rolling moment coefficient.

In order to further study the effect of aileron deflection on the aerodynamic characteristics of the transverse heading, the power of culvert fan is selected to be 1.45 kW, the incoming flow velocity is 42 m/s, the sideslip angle is 0, and the aileron rudder deflection is selected to be: left side upward deflected by 5
 ${{\mathrm{\;}}^{\circ}}$
, right side downward deflected by 5
 ${{\mathrm{\;}}^{\circ}}$
(
 ${\delta _{al}} = - {5^{\circ}},{\delta _{ar}} = {5^{\circ}}$
) and left side upward deflected by 20
 ${{\mathrm{\;}}^{\circ}}$
, right side downward deflected by 20
 ${{\mathrm{\;}}^{\circ}}$
(
 ${\delta _{al}} = - {20^{\circ}},{\delta _{ar}} = {20^{\circ}}$
). The changes of lateral force coefficient, the yawing moment coefficient, and the rolling moment coefficient along with the heading angle are shown in Fig. 5, revealing that the differential deflection of the aileron has a greater effect on the lateral force coefficient and roll moment coefficient, and the increase of the differential rudder deflection of the aileron will increase the slope of the yaw moment coefficient curve.
The differential rudder effect of aileron at the incoming flow velocity of 42 m/s: (a) the lateral force coefficient, (b) the yaw moment coefficient, (c) the rolling moment coefficient.

3.0 Dynamics modeling for distributed propulsion vehicle
3.1 Six-degree-of-freedom dynamics modeling for distributed propulsion vehicles
In the aerodynamic model, the thrust coefficient is combined with the drag coefficient to form the residual thrust coefficient, and the six-degree-of-freedom dynamics model of a distributed propulsion vehicle can be expressed as:
 \begin{align}\left\{ {\begin{array}{*{20}{l}}{\dot V} & = \,{{f_V} + {g_V}{\mathrm{\Phi }} + {d_V},}\\[3pt]{\dot \beta} & = \,{\frac{1}{{mV}}{\mathrm{cos}}\beta QS{C_Y} + p{\mathrm{sin}}\alpha - r{\mathrm{cos}}\alpha + \frac{1}{V}g{\mathrm{cos}}\theta {\mathrm{sin}}\phi, }\\[3pt]{\dot{\alpha}} & = \,\begin{array}{l} - \frac{1}{{mV{\mathrm{cos}}\beta }}QS{C_L} + \frac{1}{{{\mathrm{cos}}\beta }}\left( { - p{\mathrm{cos}}\alpha {\mathrm{sin}}\beta + q{\mathrm{cos}}\beta - r{\mathrm{sin}}\alpha {\mathrm{sin}}\beta } \right)\\[3pt] + \frac{1}{{V{\mathrm{cos}}\beta }}g{\mathrm{cos}}\theta {\mathrm{cos}}\phi, \end{array}\\[3pt]{\dot{p}} & = \,\begin{array}{l}\frac{{{I_z}}}{{{I_x}{I_z} - I_{xz}^2}}QSb{C_l} + \frac{{{I_x}}}{{{I_x}{I_z} - I_{xz}^2}}QSb{C_n} + \frac{{{I_{xz}}\left( {{I_x} - {I_y} + {I_z}} \right)}}{{{I_x}{I_z} - I_{xz}^2}}pq\\[3pt] + \frac{{{I_z}\left( {{I_y} - {I_z}} \right) - I_{xz}^2}}{{{I_x}{I_z} - I_{xz}^2}}qr,\end{array}\\[3pt]{\dot q} & = \,{\frac{{QSc{C_m} + \left( {{I_z} - {I_x}} \right)pr + {I_{xz}}\left( {{r^2} - {p^2}} \right)}}{{{I_y}}},}\\[3pt]{\dot r} & = \,\begin{array}{l}\frac{{{I_{xz}}}}{{{I_x}{I_z} - I_{xz}^2}}QSb{C_l} + \frac{{{I_x}}}{{{I_x}{I_z} - I_{xz}^2}}QSb{C_n} + \frac{{{I_{xz}}\left( {{I_x} - {I_y} + {I_z}} \right)}}{{{I_x}{I_z} - I_{xz}^2}}qr\\[3pt] + \frac{{{I_x}\left( {{I_x} - {I_y}} \right) - I_{xz}^2}}{{{I_x}{I_z} - I_{xz}^2}}pq,\end{array}\\[3pt]{\dot \phi} & = \,{p + \left( {r{\mathrm{cos}}\phi + q{\mathrm{sin}}\phi } \right){\mathrm{tan}}\theta, }\\[3pt]{\dot \theta} & = \,{q{\mathrm{cos}}\phi - r{\mathrm{sin}}\phi, }\\[3pt]{\dot \psi} & = \,{\frac{1}{{{\mathrm{cos}}\theta }}\left( {r{\mathrm{cos}}\phi + q{\mathrm{sin}}\phi } \right)}\end{array}} \right.\end{align}
where
 $V,\beta, \alpha, p,q,r,\phi, \theta, \psi $
are the velocity, sideslip angle, angle-of-attack, roll rate, pitch rate, yaw rate, roll angle, pitch angle and yaw angle of the aircraft respectively;
 $m,Q,S,b,c,g$
are the mass, dynamic pressure, wing area, wingspan, chord of the aircraft and gravitational acceleration, respectively;
 ${I_x},{I_y},{I_z}$
are the moments of inertia of the aircraft around x-axis, y-axis and z-axis, and
 ${I_{xz}}$
is the product of inertia of xz-axis;
 ${C_L},{C_R},{C_Y},{C_l},{C_m},{C_n}$
can be outputted on-line by using the aerodynamic coefficient model trained by deep neural network.
3.2 Deep neural network-based modeling of aerodynamic coefficients
While wind tunnel tests can accurately simulate the flow field environment under real flight conditions and provide aerodynamic coefficients for aircraft, they are not devoid of challenges. Specifically, wind tunnel tests are associated with high costs and difficulties in acquiring comprehensive aerodynamic data. On the other hand, neural networks offer a promising alternative. They map input data to the output space through multiple layers and adjust parameters like connection weights and bias to align network outputs with actual results. In theory, neural networks possess the capability to approximate nonlinear functions with arbitrary precision and learn the internal operational laws of models. Consequently, they are well-suited for training aerodynamic coefficient models of distributed propulsion vehicles.
To enable the model to represent various flight conditions, this paper selected a total of 1,763 samples under different sideslip angles, different angles of attack, different power of the ducted fan, and different rudder deflection angles as training data. The inputs of the deep neural network are
 ${\left[ {T,\alpha, V,\beta, {\delta _l},{\delta _r},{\delta _a}} \right]^T}$
, where
 $T$
denotes the power of the culvert fan,
 ${\delta _l}$
denotes the rudder surface deflection of left V-tail,
 ${\delta _r}$
denotes the rudder surface deflection of right V-tail and
 ${\delta _a}$
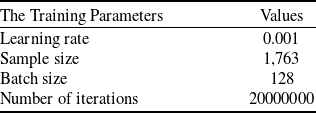
denotes the differential deflection of aileron. The stochastic gradient descent algorithm is used to optimise the parameters of the neural network, the input layer contains 7 nodes, there are 4 hidden layers, the number of nodes are 256, 1,024, 1,024, 256, and the output layer contains 6 nodes. The neural network training parameters are shown in Table 1 and the training schematic is shown in Fig. 6.
The training parameters for neural networks

The training schematic diagram of neural network.

In order to make the input data have a uniform scale numerically and avoid the problem of excessive numerical differences between different features to improve the training effect of neural network, the normalisation process is as follows:
 \begin{align}{n_p} = \left( {{d_p} - {m_p}} \right)/{s_p}\end{align}
where
 ${d_p}$
denotes the original value of the input of neural network,
 ${m_p}$
denotes the sample mean,
 ${s_p}$
denotes the sample variance and
 ${n_p}$
denotes the normalised value.
Setting
 ${\left[ {V,\beta, {\delta _l},{\delta _r},{\delta _a}} \right]^T} = {\left[ {42,0,0,0,0} \right]^T}$
, the culvert fan power is 0, 1.45 kW, 2.54 kW and 3.03 kW, respectively, the varies from −5
 ${{\mathrm{\;}}^{\circ}}$
to 20
 ${{\mathrm{\;}}^{\circ}}$
with an interval of 1
 ${{\mathrm{\;}}^{\circ}}$
, and the longitudinal aerodynamic coefficients are shown in Fig. 7. With the increase of culvert fan power, the lift coefficient increases significantly and the drag coefficient decreases significantly, indicating that the deep neural network-based aerodynamic coefficient model learns the law of increasing lift and decreasing drag for distributed propulsion. The black dots denote the sample data, which shows that the longitudinal aerodynamic coefficients can be accurately predicted using the deep neural network-based aerodynamic model, reflecting the change rule of the lift coefficient with the angle-of-attack and the culvert fan power, as well as the change rule of the stall angle-of-attack.
The prediction of longitudinal aerodynamic coefficients: (a) the lift coefficient, (b) the residual thrust coefficient, (c) the pitching moment coefficient.

Setting
 ${\left[ {T,V,\alpha, {\delta _r},{\delta _a}} \right]^T} = {\left[ {1.45,42,0,0,0} \right]^T}$
, the left rudder deflection of the V-tail is 0
 ${{\mathrm{\;}}^{\circ}}$
, 5
 ${{\mathrm{\;}}^{\circ}}$
, 10
 ${{\mathrm{\;}}^{\circ}}$
, 15
 ${{\mathrm{\;}}^{\circ}}$
and 20
 ${{\mathrm{\;}}^{\circ}}$
, respectively, and the sideslip angle changes from 0
 ${{\mathrm{\;}}^{\circ}}$
to 20
 ${{\mathrm{\;}}^{\circ}}$
with an interval of 1
 ${{\mathrm{\;}}^{\circ}}$
, the lateral force coefficient and yaw moment coefficient are as shown in Fig. 8. The absolute value of the lateral force coefficient increases as the side slip angle increases, and the yaw moment coefficient keeps increasing. In addition, the yaw moment also increases with the increase of V-tail deflection. Setting, the aileron differential rudder deflection is 0
 ${{\mathrm{\;}}^{\circ}}$
, 5
 ${{\mathrm{\;}}^{\circ}}$
, 10
 ${{\mathrm{\;}}^{\circ}}$
, 15
 ${{\mathrm{\;}}^{\circ}}$
and 20
 ${{\mathrm{\;}}^{\circ}},$
respectively, the sideslip angle changes from 0
 ${{\mathrm{\;}}^{\circ}}$
to 20
 ${{\mathrm{\;}}^{\circ}}$
with an interval of 1
 ${{\mathrm{\;}}^{\circ}}$
, and the coefficient of roll moment is shown in Fig. 8(c). The roll moment coefficient is increasing with the increase of aileron differential rudder deflection. In addition, it can be seen that the side-slip angle also has a great influence on the roll moment coefficient.
The prediction of lateral aerodynamic coefficients: (a) the lateral force coefficient, (b) the yaw moment coefficient, (c) the rolling moment coefficient.

3.3 The aerodynamic modeling of power differential
In order to investigate the effect of power differential on flight, the aerodynamic force and aerodynamic moment of different power differential scenarios are tested: (1) the power of the left culvert fan is 3.03 kW and the power of the right culvert fan is 0; (2) the power of the left culvert fan is 3.03 kW and the power of the right culvert fan is 2.54 kW.The incoming velocity is 42 m/s and the angle-of-attack is 2
 ${{\mathrm{\;}}^{\circ}}$
, and the model of the effect of power differential is established by using the polynomial fitting method as follows:
 \begin{align}\left\{ {\begin{array}{*{20}{l}}{{C_L} = {C_L} - 0.1933\eta, }\\{{C_D} = {C_D} + 0.0905\eta, }\\{{C_Y} = {C_Y} - 0.0139\eta, }\\{{C_m} = {C_m} + 0.1049\eta, }\\{{C_n} = {C_n} + 0.0215\eta, }\\{{C_l} = {C_l} + 0.0229\eta }\end{array}} \right.\end{align}
where
 $\eta $
denotes the power differential factor, which is related to the power differential between the left- and right-side culvert fans.
4.0 Controller design
The controller design for a six-degree-of-freedom distributed propulsion vehicle is challenging due to the high-order nature of its dynamics model and the coupling of internal dynamics. The backstepping method, a recursive design approach that proceeds from inputs to outputs, offers a systematic and structured framework for controller design, particularly suited for high-order systems. Consequently, the backstepping method is employed to design the flight controller, aiming to validate the six-degree-of-freedom dynamics model of the distributed propulsion vehicle.
4.1 The velocity controller
The velocity subsystem in Equation 1 can be expressed as:
 \begin{align}\dot V = {f_V}\left( x \right) + {g_V}\left( {x,u} \right)\end{align}
where
 $x = {\left[ {V,\beta, \alpha, p,q,r,\phi, \theta, \psi } \right]^T}$
denotes the flight state,
 $u = {\left[ {T,{\delta _l},{\delta _r},{\delta _a}} \right]^T}$
denotes the control input.
The coupling relationship between flight states and flight states and control inputs is very complex. In order to facilitate the controller design, the weak coupling terms inside the system are ignored. Since the velocity is mainly affected by the thrust, the influence of rudder deflection on the velocity is ignored when designing the velocity controller and then Equation (4) can be considered as:
 \begin{align}\dot V \approx {f_V}\left( x \right) + {g_V}\left( x \right){C_R}\left( {x,T} \right)\end{align}
where
 ${f_V}\left( x \right) = - g{\mathrm{sin}}\theta $
,
 ${g_V}\left( x \right) = - \dfrac{1}{m}\,QS$
.
The velocity tracking error is defined as
 ${e_V} = V - {V_{ref}}$
, where
 ${V_{ref}}$
denotes the velocity reference signal. The velocity controller is designed as:
 \begin{align}T = - {k_{V1}}{e_V} - {k_{V2}}\mathop \int \nolimits_0^t {e_V}dt\end{align}
where
 ${k_{V1}}$
and
 ${k_2}$
are the velocity control parameters to be designed.
4.2 The altitude controller
Using a similar analysis to that of the velocity controller, the altitude subsystem can be considered for ease of design of the altitude controller, ignoring the effects of thrust and aileron differential on the altitude:
 \begin{align}\left\{ {\begin{array}{*{20}{l}}{\dot h = V\,{\mathrm{sin}}\,\gamma, }\\{\dot \alpha = {f_\alpha }\left( x \right) + {g_\alpha }\left( x \right){\mathrm{cos}}\theta, }\\{\dot \theta = Q,}\\{\dot q \approx {f_q}\left( x \right) + {g_q}\left( x \right){C_m}\left( {x,{\delta _l},{\delta _r}} \right)}\end{array}} \right.\end{align}
where
 ${f_\alpha }\left( x \right) = - \dfrac{1}{{mV{\mathrm{cos}}\beta }}QS{C_L} + \dfrac{1}{{{\mathrm{cos}}\beta }}\left( { - p{\mathrm{cos}}\alpha {\mathrm{sin}}\beta + q{\mathrm{cos}}\beta - r{\mathrm{sin}}\alpha {\mathrm{sin}}\beta } \right)$
,
 ${g_\alpha }\left( x \right) = \dfrac{1}{{V{\mathrm{cos}}\beta }}g{\mathrm{cos}}\phi $
,
 ${f_q}\left( x \right) = \dfrac{{\left( {{I_z} - {I_x}} \right)pr + {I_{xz}}\left( {{r^2} - {p^2}} \right)}}{{{I_y}}}$
,
 ${g_q}\left( x \right) = \frac{{QSc}}{{{I_y}}}$
.
Define the altitude tracking error as
 ${e_h} = h - {h_{ref}}$
, where
 ${h_{ref}}$
denotes the altitude reference signal. The altitude controller is designed as:
 \begin{align}\bar h = {\mathrm{arcsin}}\left[ {{1 \over V}\left( { - {k_{h1}}{e_h} - {k_{h2}}\mathop \int \nolimits_0^t {e_h}dt} \right)} \right]\end{align}
where
 ${k_{h1}}$
and
 ${k_{h2}}$
are the altitude control parameters to be designed.
Defining the tracking error of angle-of-attack
 ${e_\alpha }$
, the tracking error of pitch angle
 ${e_\theta }$
, and the tracking error of pitch rate
 ${e_q}$
as:
 \begin{align}\left\{ {\begin{array}{*{20}{l}}{{e_\alpha } = \alpha - \bar h,}\\{{e_\theta } = \theta - \bar \alpha, }\\{{e_q} = q - \bar \theta }\end{array}} \right.\end{align}
where the controller of angle-of-attack
 $\bar \alpha $
, and the controller of pitch angle
 $\bar \theta $
are designed as:
 \begin{align}\left\{ {\begin{array}{*{20}{l}}{\bar \alpha = - {k_\alpha }{e_\alpha },}\\{\bar \theta = - {k_\theta }{e_\theta }}\end{array}} \right.\end{align}
where
 ${k_\alpha }$
and
 ${k_\theta }$
are the control parameters to be designed.
Given that V-tail deflection influences both pitch and yaw motions, the V-tail rudder deflection control law is comprehensively designed after taking the transverse heading control into account.
4.3 The transverse heading controller
The design formulas of the transverse heading controller mainly refer to [Reference Stevens and Lewis38]. By employing an analogous analysis to that utilised for the altitude controller, the transverse heading subsystem is examined to facilitate the design of the transverse heading controller:
 \begin{align}\left\{ {\begin{array}{*{20}{l}}{\dot{x} \,\,= V\,{\mathrm{cos}}\,\gamma {\mathrm{sin}}\,\psi }\\{\dot \psi = \,{f_\psi }\left( x \right) + {g_\psi }\left( x \right)r,}\\{\dot \phi \,= \,{f_\phi }\left( x \right) + p,}\\{\dot r \,\,\approx \,{f_r}\left( x \right) + {g_r}\left( x \right){C_n}\left( {x,{\delta _l},{\delta _r}} \right),}\\{\dot p \,\,\approx \,{f_p}\left( x \right) + {g_p}\left( x \right){C_l}\left( {x,{\delta _a}} \right)}\end{array}} \right.\end{align}
where
 ${f_\psi }\left( x \right) = \frac{{q{\mathrm{sin}}\phi }}{{{\mathrm{cos}}\theta }},{g_\psi }\left( x \right) = \frac{{{\mathrm{cos}}\phi }}{{{\mathrm{cos}}\theta }},{f_\phi }\left( x \right) = \left( {r{\mathrm{cos}}\phi + q{\mathrm{sin}}\phi } \right){\mathrm{tan}}\theta, {f_r}\left( x \right) = \frac{{{I_{xz}}}}{{{I_x}{I_z} - I_{xz}^2}}QSb{C_l} + \,\frac{{{I_{xz}}\left( {{I_x} - {I_y} + {I_z}} \right)}}{{{I_x}{I_z} - I_{xz}^2}}qr {}+ \frac{{{I_x}\left( {{I_x} - {I_y}} \right) - I_{xz}^2}}{{{I_{}}{I_z} - I_{xz}^2}}pqq,{g_r}\left( x \right) = \frac{{{I_x}}}{{{I_x}{I_z} - I_{xz}^2}}QSb,{f_p}\left( x \right) = \frac{{{I_x}}}{{{I_x}{I_z} - I_{xz}^2}}QSb{C_n} + ({I_x}z({I_x} - {I_y} + {I_z}))/({I_x}{I_z} - {I_x}{z^2})pq + ({I_z}({I_y} - {I_z}) - {I_x}{z^2})/({I_x}{I_z} - {I_x}{z^2})qr,{g_p}(x) = {I_z}/({I_x}{I_z} - {I_x}{z^2})QSb.$
The aileron rudder deflection control law is designed as:
 \begin{align}{\delta _a} = {k_a}\left( {\phi - \bar \phi } \right) - {k_p}p\end{align}
where
 ${k_a}$
and
 ${k_p}$
are the control parameters to be designed, and
 $\bar \phi $
is the roll angle desired signal.
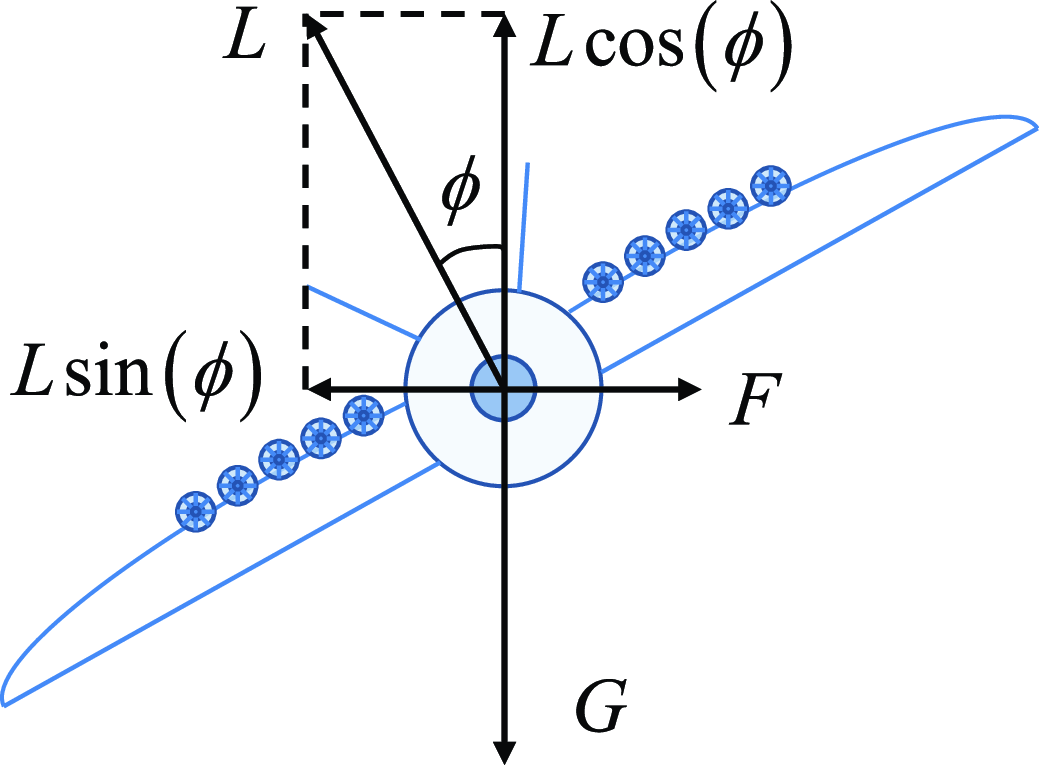
When the aircraft coordinated turn, the force analysis diagram is shown in Fig. 9, for the centripetal force on the coordinated turn. The force balance equations in the horizontal and vertical directions are:
 \begin{align}\left\{ {\begin{array}{*{20}{l}}{L\,{\mathrm{cos}}\left( \phi \right) = mg,}\\{L\,{\mathrm{sin}}\left( \phi \right) = mV\dot \psi }\end{array}} \right.\end{align}
The force analysis diagram of coordinated turn.

The relationship between the roll angle and yaw rate in a coordinated turn is given by:
 \begin{align}\dot \psi = \frac{{g\,{\mathrm{tan}}\left( \phi \right)}}{V} \approx \frac{{g\phi }}{V}\end{align}
According to Equations (12) and (14), the desired signal of yaw rate can be mapped to the desired signal of roll rate during a coordinated turn with the following mapping relationship:
 \begin{align}{\delta _a} = {k_a}\left( {\phi - \frac{{\bar rg}}{V}} \right) - {k_p}p\end{align}
Combining the altitude tracking control and transverse heading tracking control, the V-tail rudder yaw angle control law is designed as:
 \begin{align}{\delta _l} &= - {k_q}{e_q} - {k_r}r - {k_\psi }\left( {\psi - \bar \psi } \right)\end{align}
 \begin{align}{\delta _r} &= - {k_q}{e_q} + {k_r}r + {k_\psi }\left( {\psi - \bar \psi } \right)\end{align}
where
 ${k_q}$
,
 ${k_r}$
and
 ${k_\psi }$
are the control parameters to be designed, and
 $\bar \psi $
is the desired signal of yaw angle.
In order to avoid instability caused by too large roll angle, the roll angle boundary protection control law is set as follows:
 \begin{align}{\delta _{ac}} = \left\{ {\begin{array}{*{20}{l}}{ - \phi - \frac{{30}}{{57.3}},} {}&\quad {if{\mathrm{\;\;}}\phi \lt - \frac{{30}}{{57.3}},}\\[4pt]{{\delta _a},} &\quad {if{\mathrm{\;\;}} - \frac{{30}}{{57.3}} \le \phi \le \frac{{30}}{{57.3}},}\\[4pt]{ - \phi + \frac{{30}}{{57.3}},} &\quad {if{\mathrm{\;\;}}\phi \gt \frac{{30}}{{57.3}}}\end{array}} \right.\end{align}
The power range of the culvert fan is
 $\left[ {0,6kW} \right]$
, the deflection range of the V-tail and aileron is
 $\left[ { - {{20}^{\circ}},{{20}^{\circ}}} \right]$
, the six-degree-of-freedom dynamics model of distributed propulsion vehicle and controller block diagram are shown in Fig. 10.
The block diagram of the dynamics model and controller.

5.0 The simulation results and analysis
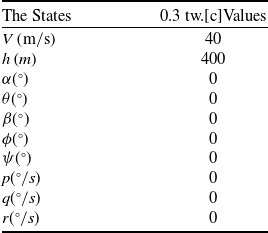
Simulation is utilised to verify the validity of the dynamics model and the controller, including three scenarios: climb phase, descent phase and turn phase. The initial states of the vehicle are shown in Table 2, and the parameters of controller are set as follows:
 ${k_{V1}} = 6,{k_{V2}} = 1,{k_{h1}} = 2,{k_{h2}} = 0.5,{k_\alpha } = 1,{k_\theta } = 2,{k_a} = 0.8,{k_p} = 2,{k_q} = 0.8,{k_r} = 0.7,{k_\psi } = 0.8$
.
The initial states of the vehicle

The flight path of climbing phase.

5.1 Scenario 1: climbing phase
The altitude reference signal is generated by the following second-order filter when the altitude is increased from 400 m to 600 m, the velocity is maintained at 40 m/s, and the transverse heading remains unchanged:
 \begin{align}\frac{{{h_{ref}}\left( s \right)}}{{{h_c}\left( s \right)}} = \frac{{{{0.11}^2}}}{{{s^2} + 2 \times 0.8 \times 0.11 \times s + {{0.11}^2}}}\end{align}
where
 ${h_c}\left( s \right)$
denotes the step signal of altitude command.
The trajectory and attitude curves pertaining to the climb phase of the distributed-propulsion vehicle are depicted in Figs. 11–14. Specifically, Fig. 11 illustrates the flight trajectory during the climb phase, with the vehicle transitioning to level flight upon completion of the climb. Figure 12 displays the velocity tracking and culvert fan power curves, revealing that the velocity accurately tracks the velocity reference signal after a minimal overshoot, and the culvert fan power exhibits no high-frequency oscillations. Additionally, Fig. 13 shows the flight altitude and rudder deflection, indicating that the flight altitude accurately tracks the altitude reference signal, while the left and right rudder deflections of the V-tail do not exhibit high-frequency oscillations. The ailerons remain undeflected due to the absence of lateral manoeuvers. Figure 14 presents the angle-of-attack, pitch angle and pitch rate, which converge to steady-state values after a brief period of fluctuation.
The velocity and culvert fan power of climbing phase.

The altitude and rudder declination of climbing phase.

The angle-of-attack, pitch angle and pitch rate of climbing phase.

The flight path of decline phase.

The velocity and culvert fan power of decline phase.

5.2 Scenario 2: decline phase
The altitude reference signal is generated by the second-order filter shown in equation by decreasing from 600 m to 400 m, keeping the velocity at 40 m/s and the transverse heading remains unchanged.
The trajectory and attitude of the descent phase are shown in Figs. 15–18. Figure 15 shows the flight trajectory of the descent phase, and the vehicle turns to level flight after completing the climb. Figure 16 shows the velocity and culvert fan power, because the vehicle is in a dive state, the potential energy is large, the culvert fan power down to 0 when the vehicle is still in an accelerated state, in the descent slope slow down when the flight velocity began to decrease, the velocity after fluctuations in the final stabilised, and is always greater than the stall velocity. Figure 17 shows the flight altitude and rudder deflection, the flight altitude can accurately track the reference signal, the rudder deflection has no high-frequency oscillation phenomenon, and the actuator can realise the corresponding rudder deflection command. Figure 18 shows the heading angle, pitch angle and pitch rate, there is no high frequency oscillation and converges to the steady-state value.
The altitude and rudder declination of decline phase.

The angle-of-attack, pitch angle and pitch rate of decline phase.

5.3 Scenario 3: turning phase
In order to verify the effectiveness of the proposed model for lateral motion, the altitude is kept at 600 m, the velocity is kept constant at 40 m/s, and the 90
 ${{\mathrm{\;}}^{\circ}}$
turn command is executed at a yaw rate of 4.5
 ${{\mathrm{\;}}^{\circ}}$
/s. The model is used for the turn phase.
The trajectory curves and attitude curves for the turning phase are shown in Figs. 19-25. Figure 19 shows the flight trajectory in the turning phase. Figure 20 shows the velocity and culvert fan power, and Fig. 21 shows the flight altitude and rudder deflection, which show that the velocity and altitude can be stabilised. Figure 22 shows the heading angle, pitch angle as well as pitch rate without buffeting and converge to the steady-state values. The yaw angle, yaw rate, roll angle, roll rate, lateral displacement and sideslip angle are shown as Figs. 23–25. Therefore, the proposed dynamic model is capable of simulating the flight states of distributed propulsion vehicle and can provide model support for controller design.
The flight path of turning phase.

The velocity and culvert fan power of turning phase.

The altitude and rudder declination of turning phase.

The angle-of-attack, pitch angle and pitch rate of turning phase.

The yaw angle and yaw rate of turning phase.

The roll angle and roll rate of turning phase.

The lateral displacement and side-slip angle of turning phase.

6.0 Conclusion
A control-oriented dynamics model of distributed propulsion vehicle is established. A deep neural network is utilised to establish the aerodynamic coefficient model, which can accurately reflect the six-degree-of-freedom dynamics characteristics of the distributed propulsion vehicle. The effectiveness of the model for longitudinal and lateral manoeuvers is verified by simulation, indicating that the model can be used as a model basis for the controller design of distributed propulsion vehicle. In the future, the research on intelligent control of distributed propulsion vehicle will be carried out in combination with artificial intelligence.
Acknowledgements
Gratitude is conveyed to the following individuals for their contributions to the analysis and work presented in this technical article: Yinghao Wang, China Aerodynamics Research and Development Center; Longkai Guo, China Aerodynamics Research and Development Center; Yuan Yi, China Aerodynamics Research and Development Center.
Competing interests
The authors declare no potential conflict of interests.